例8 按要求写程序
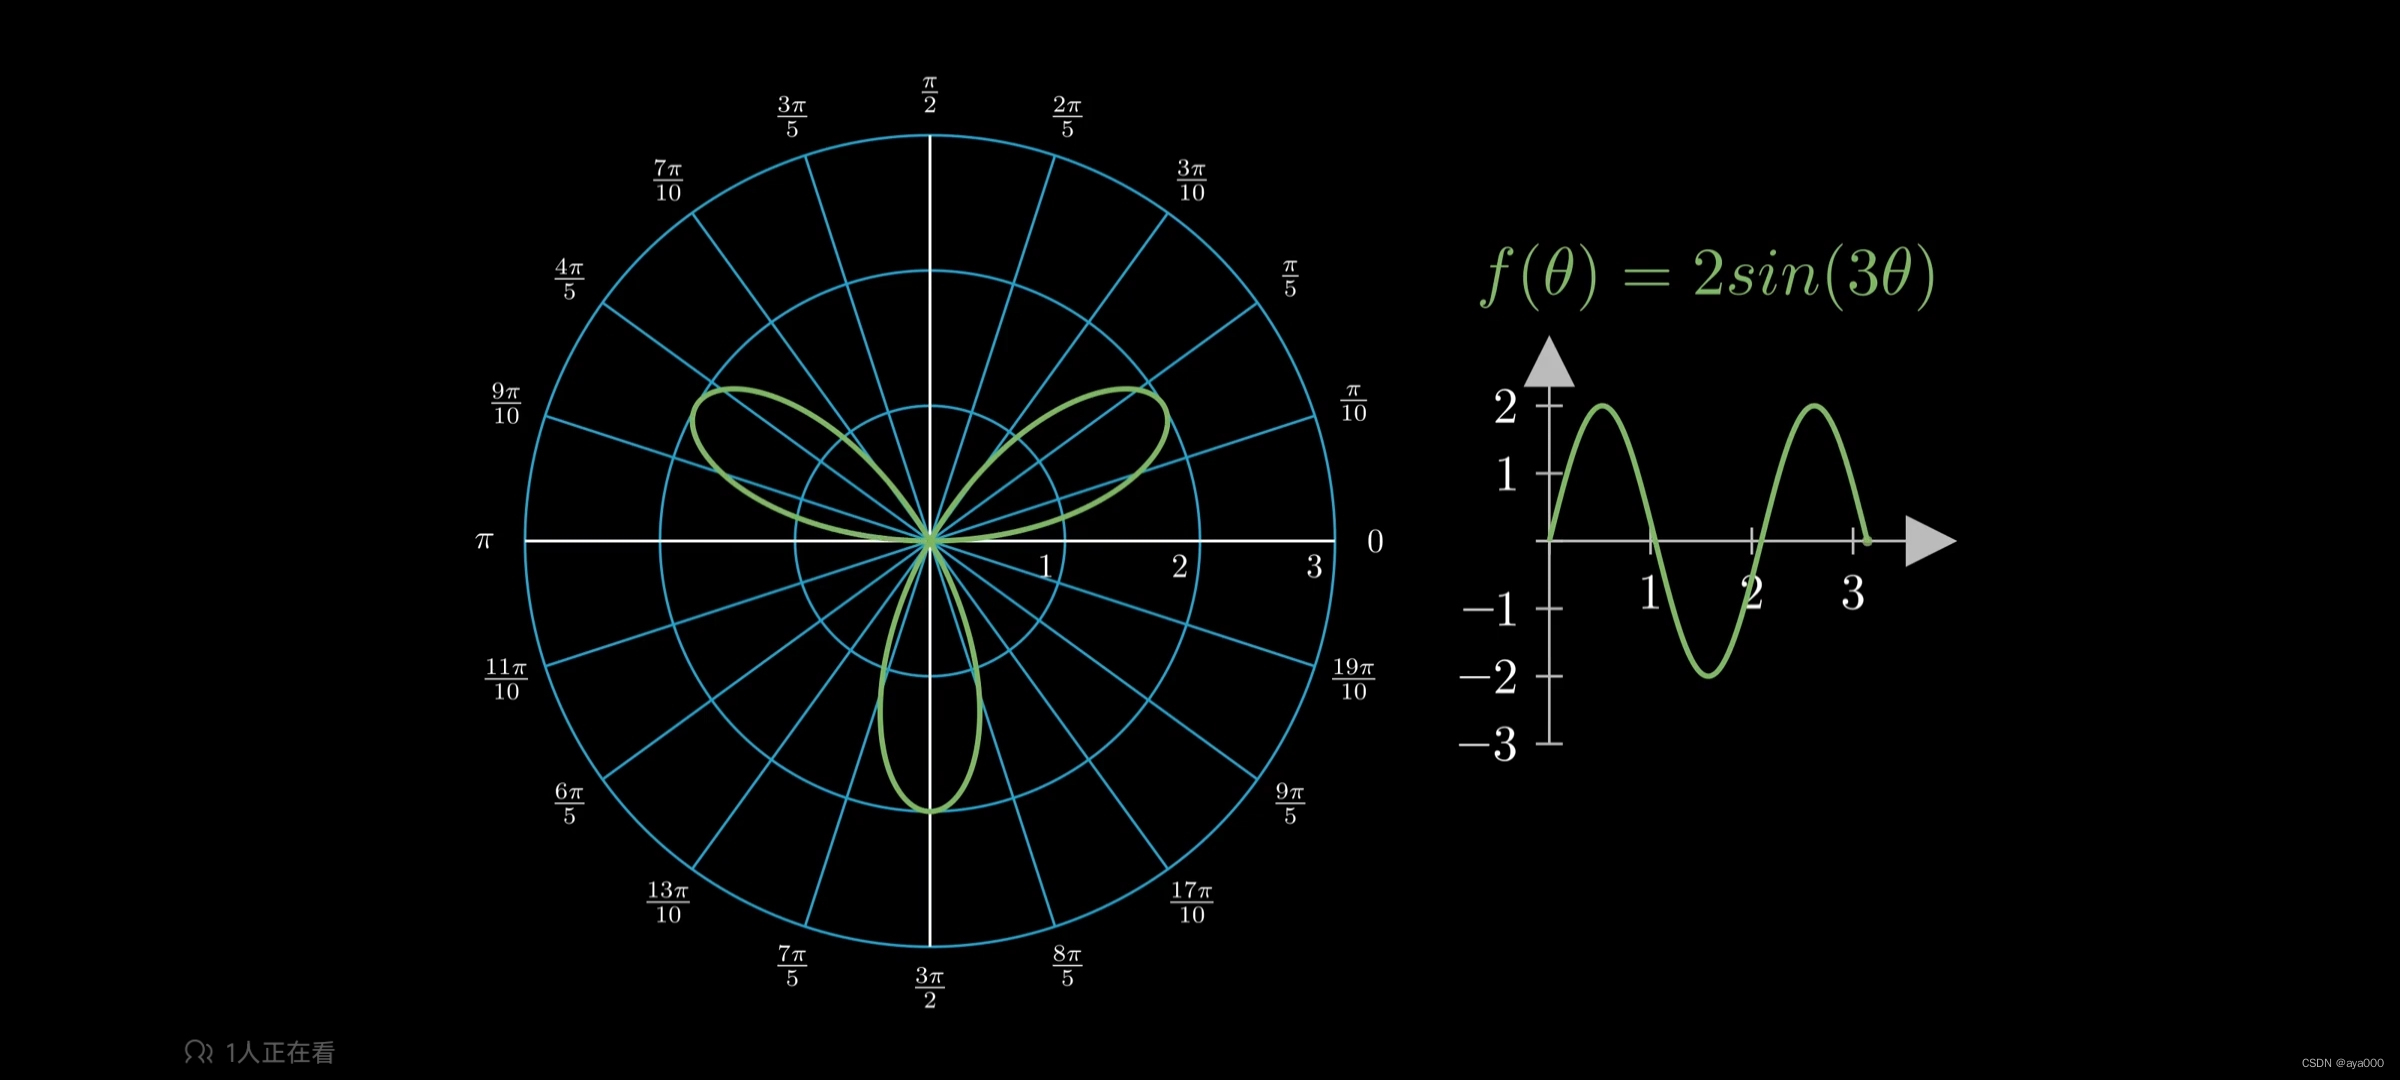
- 创建极坐标系,最大半径3,给该极坐标系添加标签;
- 设置该坐标系位置左2
- 在坐标系中实时重绘图形fx=2sin3x,显示范围是0到e,期中e是一个可以追踪的变量
- 在图像1的末端实时重绘一个绿色半透明的点
- 再创建一个二维坐标系,x范围0到4间隔1,y范围-3到3间隔1,各轴长度为3
- 坐标系位置右4,并添加标签
- 坐标系中实时重绘图形fx=2sin3x,显示范围是0到e,期中e是一个可以追踪的变量
- 在图像2的末端实时重绘一个绿色半透明的点
- 创建该公式放在坐标系上方缓冲0.5,绿色
- 动画逐步画出极坐标系,二维坐标系,公式
- 添加图像和点到坐标系
- 现在让变量e开始变化,10个单位时间从0.01变化到PI,我们能够看到,两个图像被创建的过程
class Tute2(Scene):
  def construct(self):
    #定义一个可以追踪变化的变量,初始值为0.01
    e = ValueTracker(0.01) #Tracks the end value of both functions
    #创建一个极坐标系,最大半径为3,给坐标系添加标签
    plane = Polarplane(radius_max=3).add_coordinates()
    #设置坐标系位置
    plane.shift(LEFT*2)
    #创建一个实时重绘图形,图像范围是[0,e],绿色,图像函数2sin(3x)
    graph1 = always _redraw(
      lambda : ParametricFunction(lambda t :
      plane.polar_to_point(2*np.sin(3*t),t),
      t_range = [0, e.get_value()],
      color = GREEN))
    #创建一个实时重绘的点,绿色点,位置一直在图像1的尾部
    dot1 = always_redraw(lambda : Dot(fill_color = GREEN, fill_opacity = 0.8).scale(0.5).move_to(graph1.get_end())
    #创建一个坐标系,设置位置在右4
    axes = Axes(x_range =[0,4, 1], x_length=3, y_range=[-3,3,1], y_length=3).shift(RIGHT*4)
    #给坐标系添加标签
    axes.add_coordinates()
    #创建一个实时重绘图像
    graph2 = always_redraw(
      lambda : axes.get_graph(lambda x:
      2*np.sin(3*x), x_range = [0, e.get_value()],
      color = GREEN))
    #实时重绘一个点在图像的末端
    dot2 = always_redraw(lambda : Dot(fill_color = GREEN, fill_opacity = 0.8).scale(0.5).move_to(graph2.get_end())
    #创建公式,颜色绿色,位置在二维坐标系上方
    title = MathTex("f(\\theta)= 2sin(3\\theta)",color = GREEN).next_to(axes,UP,buff=0.2)
    #依次播放动画,画极坐标系,二维坐标系,公式
    self.play(Laggedstart(Write(plane), Create(axes), Write(title), run_ time=3, lag_ratio=0.5)
    #添加图像1和图像2,点1和点2
    self.add(graph1, graph2, dot1, dot2)
    #现在让变量e开始变化,10个单位时间从0.01变化到PI
    self.play(e.animate.set_value(PI), run_time = 10, rate_func = linear)


 510
510


 被折叠的 条评论
为什么被折叠?
被折叠的 条评论
为什么被折叠?
 到【灌水乐园】发言


