


import random
import string
from datetime import datetime

def generate_random_string(length=3):
    characters = string.ascii_uppercase
    return ''.join(random.choice(characters) for _ in range(length))

def generate_timestamped_string(separator='_'):
    timestamp = datetime.now().strftime('%y%m%d') # %H%M%S
    random_part = generate_random_string(length=3)
    return random_part+separator+timestamp

timestamped_string = generate_timestamped_string()
print('【{0}】'.format(timestamped_string))
【Talk is cheap】
import pandas as pd
import matplotlib.pyplot as plt
import seaborn as sns
# 读取数据
users = pd.read_csv('./data/user_loss.csv', encoding='gbk')
info = pd.read_csv('./data/info_new.csv', encoding='utf-8')
print('客户信息表的维数:', users.shape)
print('订单详情表的维数:', info.shape)
客户信息表的维数: (2431, 36)
订单详情表的维数: (6611, 21)
users.head()| USER_ID | MYID | ACCOUNT | NAME | ORGANIZE_ID | ORGANIZE_NAME | DUTY_ID | TITLE_ID | PASSWORD | ... | MODIFYER | TEL | stuNo | weixin | sex | poo | address | age | type | |||
|---|---|---|---|---|---|---|---|---|---|---|---|---|---|---|---|---|---|---|---|---|---|
| 0 | 3300 | NaN | 艾朵 | a2328 | 330 | 统计17级 | NaN | NaN | 202cb962ac59075b964b07152d234b1752 | NaN | ... | NaN | 18688882452 | 2019351 | NaN | NaN | 男 | 广东汕尾 | 广州 | 26 | 非流失 |
| 1 | 3497 | NaN | 艾国真 | a2525 | 330 | 统计17级 | NaN | NaN | 202cb962ac59075b964b07152d234b1949 | NaN | ... | NaN | 18688882649 | 2019548 | NaN | NaN | 男 | 广东汕尾 | 广州 | 43 | 非流失 |
| 2 | 2863 | NaN | 艾锦程 | a1891 | 330 | 统计17级 | NaN | NaN | 202cb962ac59075b964b07152d234b1315 | NaN | ... | NaN | 18688882015 | 2018914 | NaN | NaN | 男 | 广东汕尾 | 佛山 | 58 | 已流失 |
| 3 | 3006 | NaN | 艾穹 | a2034 | 330 | 统计17级 | NaN | NaN | 202cb962ac59075b964b07152d234b1458 | NaN | ... | NaN | 18688882158 | 2019057 | NaN | NaN | 女 | 四川广安 | 广州 | 22 | 已流失 |
| 4 | 3160 | NaN | 艾融乐 | a2188 | 330 | 统计17级 | NaN | NaN | 202cb962ac59075b964b07152d234b1612 | NaN | ... | NaN | 18688882312 | 2019211 | NaN | NaN | 女 | 广东中山 | 广州 | 20 | 非流失 |
5 rows × 36 columns
info.head()| info_id | emp_id | number_consumers | mode | dining_table_id | dining_table_name | expenditure | dishes_count | accounts_payable | use_start_time | ... | lock_time | cashier_id | pc_id | order_number | org_id | print_doc_bill_num | lock_table_info | order_status | phone | name | |
|---|---|---|---|---|---|---|---|---|---|---|---|---|---|---|---|---|---|---|---|---|---|
| 0 | 1326 | 3556 | 4 | NaN | 1485 | 1006 | 423 | 13 | 423 | 2016/2/5 19:08 | ... | 2016/2/5 19:15 | NaN | NaN | NaN | 330 | NaN | NaN | 1 | 18688882708 | 麻庶汐 |
| 1 | 1327 | 1874 | 7 | NaN | 1516 | 1038 | 1101 | 29 | 1101 | 2016/1/4 11:51 | ... | 2016/1/4 12:09 | NaN | NaN | NaN | 330 | NaN | NaN | 1 | 18688881026 | 濮明智 |
| 2 | 1328 | 3484 | 5 | NaN | 1504 | 1010 | 437 | 20 | 437 | 2016/1/29 13:31 | ... | 2016/1/29 13:37 | NaN | NaN | NaN | 330 | NaN | NaN | 1 | 18688882636 | 姜萌萌 |
| 3 | 1329 | 3639 | 2 | NaN | 1482 | 1003 | 251 | 8 | 251 | 2016/1/19 12:02 | ... | 2016/1/19 12:14 | NaN | NaN | NaN | 330 | NaN | NaN | 1 | 18688882791 | 封振翔 |
| 4 | 1330 | 3835 | 2 | NaN | 1480 | 1002 | 363 | 6 | 363 | 2016/7/18 12:35 | ... | 2016/7/18 12:45 | NaN | NaN | NaN | 330 | NaN | NaN | 1 | 18688882987 | 白子晨 |
5 rows × 21 columns
# 将时间转为时间格式
users['CREATED'] = pd.to_datetime(users['CREATED'])
info['use_start_time'] = pd.to_datetime(info['use_start_time'])
info['lock_time'] = pd.to_datetime(info['lock_time'])

# 客户流失与年龄的关系
a = users.loc[users['type'] == '已流失', ['age', 'type']]['age'].value_counts().sort_index()
b = users.loc[users['type'] == '非流失', ['age', 'type']]['age'].value_counts().sort_index()
c = users.loc[users['type'] == '准流失', ['age', 'type']]['age'].value_counts().sort_index()

df = pd.DataFrame({'已流失': a.values,
                   '非流失': b.values,
                   '准流失': c.values},
                   index=range(20, 61, 1))
df.head()| 已流失 | 非流失 | 准流失 | |
|---|---|---|---|
| 20 | 7 | 11 | 25 |
| 21 | 24 | 29 | 54 |
| 22 | 17 | 32 | 49 |
| 23 | 13 | 25 | 48 |
| 24 | 15 | 20 | 33 |
plt.rcParams['font.sans-serif'] = 'SimHei'  # 设置中文显示
plt.rcParams['axes.unicode_minus'] = False
plt.figure(figsize=(8, 4))
sns.lineplot(data=df)
plt.xlabel('年龄(岁)')
plt.ylabel('客户流失数量(人)')
plt.title('客户流失数量与年龄的关系')
Text(0.5, 1.0, '客户流失数量与年龄的关系')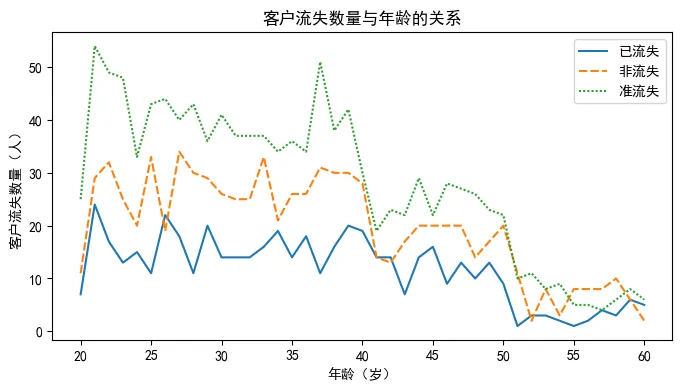
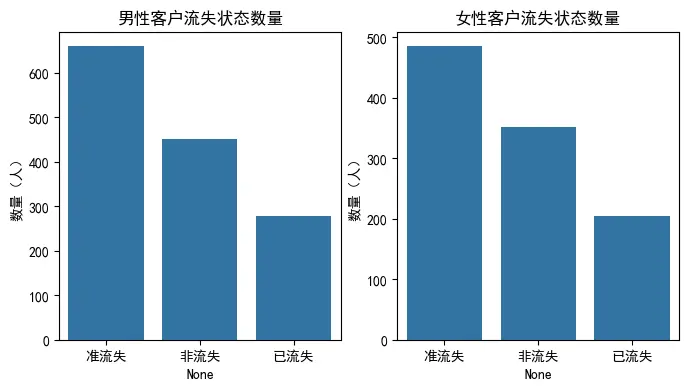
count1 = pd.DataFrame(users[users['sex']=='男']['type'].value_counts())
count1.columns=['数量(人)']
count2 = pd.DataFrame(users[users['sex']=='女']['type'].value_counts())
count2.columns=['数量(人)']
index1 = count1.index
index2 = count2.index
fig,axes=plt.subplots(1, 2, figsize=(8, 4))
sns.barplot(x=index1, y=count1['数量(人)'], ax=axes[0])
axes[0].set_title('男性客户流失状态数量')
sns.barplot(x=index2, y=count2['数量(人)'], ax=axes[1])
axes[1].set_title('女性客户流失状态数量')
Text(0.5, 1.0, '女性客户流失状态数量')
print('订单详情表重复值个数:',
info.duplicated(subset=['name', 'use_start_time']).sum())
订单详情表重复值个数: 0
ind = info[info.duplicated(['dining_table_id', 'use_start_time'])].index
print('同一时间桌子被不同人使用的订单:\n',
info[(info['dining_table_id'] == info.iloc[ind[1], :]['dining_table_id']) &
(info['use_start_time'] == info.iloc[ind[1], :]['use_start_time'])]
[['info_id', 'dining_table_id','use_start_time']])
同一时间桌子被不同人使用的订单:
info_id dining_table_id use_start_time
2052 3392 1484 2016-03-26 21:55:00
2140 3480 1484 2016-03-26 21:55:00
info.drop(index=ind, inplace=True)
info = info.reset_index(drop=True)
print('异常值个数:', len(ind))
print('去除异常值订单详情表维数:', info.shape)
异常值个数: 17
去除异常值订单详情表维数: (6594, 21)
print('客户信息表缺失值个数:', info.isnull().sum().sum())
print('订单详情表缺失值个数:', users.isnull().sum().sum())
客户信息表缺失值个数: 46158
订单详情表缺失值个数: 50842
info.head()| USER_ID | number_consumers | expenditure | |
|---|---|---|---|
| 0 | 3556 | 4 | 423 |
| 1 | 1874 | 7 | 1101 |
| 2 | 3484 | 5 | 437 |
| 3 | 3639 | 2 | 251 |
| 4 | 3835 | 2 | 363 |
for i in range(len(users)):
    info1 = info.iloc[info[info['name'] == users.iloc[i, 2]].index.tolist(), :]
    if sum(info['name'] == users.iloc[i, 2]) != 0:
        users.iloc[i, 14] = max(info1['use_start_time'])
# 获取订单状态为1的订单
info = info.loc[info['order_status'] == 1, ['emp_id', 'number_consumers', 'expenditure']]
info = info.rename(columns={'emp_id': 'USER_ID'})  # 修改列名
user = users[['USER_ID', 'LAST_VISITS', 'type']]

# 合并两个表
info_user = pd.merge(user, info, left_on='USER_ID', right_on='USER_ID', how='left')
print('合并表缺失值个数:\n', info_user.isnull().sum())
info_user.dropna(inplace=True)

info_user.to_csv('./tmp/info_user.csv', index=False, encoding='utf-8')

print('处理缺失值数据维度:\n', info_user.shape)
合并表缺失值个数:
 USER_ID               0
LAST_VISITS         152
type                  0
number_consumers      4
expenditure           4
dtype: int64
处理缺失值数据维度:
 (6460, 5)
# 构建特征
info_user = pd.read_csv('./tmp/info_user.csv', encoding='utf-8')

# 统计每个客户的用餐次数
info_user1 = info_user['USER_ID'].value_counts()
info_user1 = info_user1.reset_index()
info_user1.columns = ['USER_ID', 'frequence']  # 修改列名

# 求出每个客户的消费总金额
# 分组求和
info_user2 = info_user[['number_consumers',
                        'expenditure']].groupby(info_user['USER_ID']).sum()
info_user2 = info_user2.reset_index()
info_user2.columns = ['USER_ID', 'numbers', 'amount']
# 合并客户的用餐次数和消费总金额
data_new = pd.merge(info_user1, info_user2,
                      left_on='USER_ID', right_on='USER_ID', how='left')

# 提取数据
info_user = info_user.iloc[:, :4]
info_user = info_user.groupby(['USER_ID']).last()
info_user = info_user.reset_index()
# 合并
info_user_new = pd.merge(data_new, info_user,
                      left_on='USER_ID', right_on='USER_ID', how='left')
print(info_user_new.head())

# 求人均消费金额,并保留2为小数
info_user_new['average'] = info_user_new['amount'] / info_user_new['numbers']
info_user_new['average'] = info_user_new['average'].apply(lambda x: '%.2f' % x)

# 计算每个客户最近一次点餐的时间距离观测窗口结束的天数
# 修改时间列,改为日期
info_user_new['LAST_VISITS'] = pd.to_datetime(info_user_new['LAST_VISITS'])
datefinally = pd.to_datetime('2016-7-31')  # 观测窗口结束时间
time = datefinally - info_user_new['LAST_VISITS']
info_user_new['recently'] = time.apply(lambda x: x.days)  # 计算时间差
# 特征选取
info_user_new = info_user_new.loc[:, ['USER_ID', 'frequence',
                             'amount', 'average', 'recently', 'type']]
info_user_new.to_csv('./tmp/info_user_clear.csv', index=False, encoding='gbk')
print(info_user_new.head())
USER_ID  frequence  numbers   amount     LAST_VISITS type  number_consumers
0     2361         41    237.0  34784.0  2016/7/8 11:31  非流失               7.0
1     3478         37    231.0  33570.0  2016/7/7 12:54  非流失               5.0
2     3430         34    224.0  31903.0  2016/7/9 12:53  非流失               5.0
3     3762         33    208.0  30394.0  2016/7/7 12:51  非流失              10.0
4     3307         33    199.0  30400.0  2016/7/9 12:56  非流失               2.0
   USER_ID  frequence   amount average  recently type
0     2361         41  34784.0  146.77        22  非流失
1     3478         37  33570.0  145.32        23  非流失
2     3430         34  31903.0  142.42        21  非流失
3     3762         33  30394.0  146.12        23  非流失
4     3307         33  30400.0  152.76        21  非流失
import pandas as pd
from sklearn.metrics import confusion_matrix

# 自定义评价函数
def test_pre(pred):
    # 混淆矩阵
    hx = confusion_matrix(y_te, pred, labels=['非流失', '准流失'])
    print('混淆矩阵:\n', hx)
    # 精确率
    P = hx[1, 1] / (hx[0, 1] + hx[1, 1])
    print('精确率:', round(P, 3))
    # 召回率
    R = hx[1, 1] / (hx[1, 0] + hx[1, 1])
    print('召回率:', round(R, 3))
    # F1值
    F1 = 2 * P * R / (P + R)
    print('F1值:', round(F1, 3))
# 读取数据
info_user = pd.read_csv('./tmp/info_user_clear.csv', encoding='gbk')
# 删除流失客户
info_user = info_user[info_user['type'] != '已流失']
model_data = info_user.iloc[:, [1, 2, 3, 4, 5]]
# 划分测试集、训练集
from sklearn.model_selection import train_test_split

# 构建模型
from sklearn.tree import DecisionTreeClassifier as DTC
dtc = DTC(random_state=12345)
dtc.fit(x_tr, y_tr)  # 训练模型
pre = dtc.predict(x_te)
# 评价模型
test_pre(pre)

print('真实值:\n', y_te[:10].to_list())
print('预测结果:\n', pre[:10])
混淆矩阵:
 [[159   8]
 [ 17 198]]
精确率: 0.961
召回率: 0.921
F1值: 0.941
真实值:
 ['准流失', '非流失', '准流失', '非流失', '准流失', '准流失', '准流失', '准流失', '准流失', '准流失']
预测结果:
 ['准流失' '非流失' '准流失' '非流失' '准流失' '准流失' '准流失' '准流失' '准流失' '准流失']
from sklearn.svm import LinearSVC
svc = LinearSVC(random_state=123)
svc.fit(x_tr, y_tr)
pre = svc.predict(x_te)
test_pre(pre)

print('真实值:\n', y_te[:10].to_list())
print('预测结果:\n', pre[:10])
混淆矩阵:
 [[113  54]
 [  0 215]]
精确率: 0.799
召回率: 1.0
F1值: 0.888
真实值:
 ['准流失', '非流失', '准流失', '非流失', '准流失', '准流失', '准流失', '准流失', '准流失', '准流失']
预测结果:
 ['准流失' '准流失' '准流失' '非流失' '准流失' '准流失' '准流失' '准流失' '准流失' '准流失']


F:\python3.9\Scripts\venv_pdfgpt\lib\site-packages\sklearn\svm\_base.py:1244: ConvergenceWarning: Liblinear failed to converge, increase the number of iterations.
  warnings.warn(


 7419
7419

 被折叠的 条评论
为什么被折叠?
被折叠的 条评论
为什么被折叠?
 到【灌水乐园】发言


