


背景:老板提供了一份txt数据集,是关于视频点播时长的统计,包括视频ID和播放时长两个数据变量,部分数据格式如下:
“视频id” “播放时长”
“00000000020000047018” “00:29:59”
“00000000020000047031” “00:34:59”
“00000000040001292551” “01:05:00”
“00000000040001294405” “01:05:00”
“00000000040001242053” “00:41:00”
“00000000020000675981” “0”
“00000000020000050729” “00:30:00”
“00000000020000050735” “00:09:34”
“00000000020000050741” “00:04:53”
“00000000020000799816” “0”
“00000000020000675988” “0”
“00000000020000675989” “0”
“00000000020000050777” “00:16:22”
“00000000040001297877” “01:05:00”
… …
要实现播放时长的统计规律,需要从中提取处理来第二个字段,并转化成秒长,排序后进行散点图绘制,在Ubuntu下使用python语言处理该数据集,效果很好,代码如下:
import numpy
import io
import csv

import time
import sys,re

import numpy as np
import matplotlib.pyplot as plt

## function to change the type of time into seconds
def time2itv(sTime):

    p="^([0-9]+):([0-5][0-9]):([0-5][0-9])$"
    cp=re.compile(p)
    try:
        mTime=cp.match(sTime)
    except TypeError:
        return "[InModuleError]:time2itv(sTime) invalid argument type"

    if mTime:
        t=map(int,mTime.group(1,2,3))
        return 3600*t[0]+60*t[1]+t[2]
    else:
        return 0

##write the time into a csv,change it into seconds,and sort it
def write2csv(stime):
    with open('result.csv', 'wb') as csvfile:
        writer=csv.writer(csvfile)
    writer.writerow(['time'])
        writer.writerows([stime])

##read the time into numbers and time in txt,which are divided by'\t'
timelist=[];

for line in open("test.txt"):
    numbers,time =line.split("\t")
    time=time.strip()
    time=time.rstrip('"')
    time=time.lstrip('"')
    time=time2itv(time)
    timelist.append(time)

#    print time

timelist.sort(reverse=True);


#print "end"
#print timelist
write2csv(timelist)

##draw out the point

#x=1:len(timelist);

y=timelist;

plt.plot(y,marker='o')
plt.show()
运行结果下图:
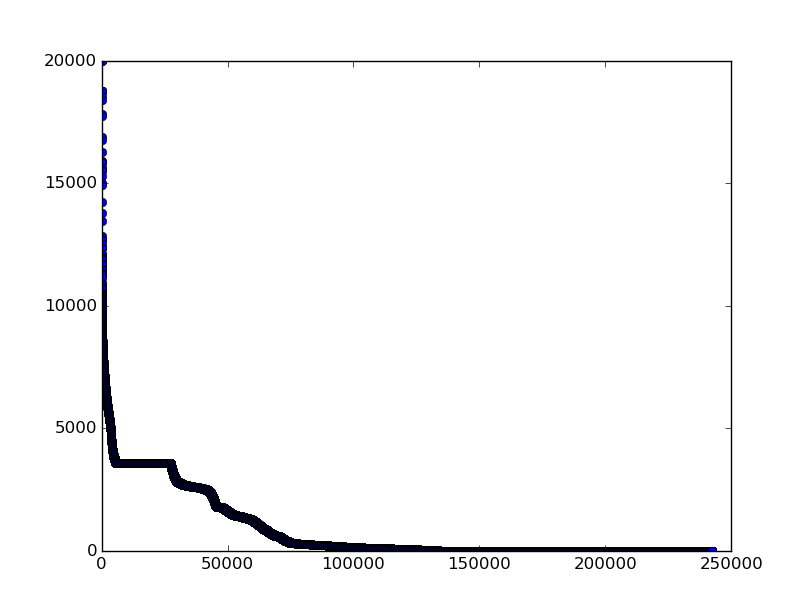
长尾分布特征十分明显,复合帕累托定律。
解决的问题
1. 利用python语言读取txt文件并写入csv文件;
2. 除去所需字段的非必要字符,如 空格,引号等;
2. 实现计时格式从XX:YY:ZZ到XXX格式的转化;
存在的问题:
1. 为了提取出有效数字,方便日后利用,选择使用 list存储播放时长,但是写入csv文件的时候出现问题,数据按行排列,并没有按照预期结果显示按列排列。
2. 下一步使用python中安装的SciPy库,对数据进行拟合。
一个月之后看自己写的代码一坨屎,
除了计算时间那个正则表达式像回事,不过貌似第copy别人的
重新写了一下这段代码
好歹看上去舒服点。
import time
from numpy import array
from numpy.random import normal
from matplotlib import pyplot

def get_time(filename):
    readfile=open(filename)
    stime=[]
    lines=readfile.readlines()
    for line in lines:
        video_id,time=line.split("\t")
        time=time.strip()
        time=time.strip('"')

        if time!='0':
            time = time.split(':')
            hour= int(time[0])
            minite = int(time[1])
            second = int(time[2])
            #total_time=time[0]*3600+60*time[1]+time[2]
            total_time=3600*hour+60*minite+second
        else:
            total_time=0
        stime.append(total_time)
    return array(stime)

def draw_hist(lenths):
    pyplot.hist(lenths,100)

    pyplot.xlabel('lenth')
    pyplot.xlim(0.0,10000)
    pyplot.ylabel('Frequency')
    pyplot.title('Lenth Of Fake Urls')
    pyplot.show()

stime=get_time("STAT_CONTENT_TIME.txt")
draw_hist(stime)


 1462
1462

 被折叠的 条评论
为什么被折叠?
被折叠的 条评论
为什么被折叠?
 到【灌水乐园】发言


