


This paper was accepted by the 3rd Workshop on Deep Learning in Medical Image Analysis (DLMIA 2017), MICCAI 2017.The system presented won first place in all of three tasks in Tumor Proliferation Challenge at MICCAI 2016.
This paper was submitted to CVPR2016. Here is the link .This study presents the dirst data-driven approach to characterize the severity of tumor groeth on a categorical and molecular level.,utilizing multiple biologically salient deep learning classifiers.
- dataset : Three dataset were used in this study. you can find the detailed information in this link. The primary dataset consists of 500 breast cancer cases. Each case is represented by one whole-slide image (WSI) and is annotated with a proliferation score (3 classes). The first auxiliary dataset consist of 73 images. Regions that contain mitotic figures with be marked,So it can be used train a mitosis detection model. The second suxiliary dataset consists of 148 images. Regions of interst of each image will ne marked.So it can be used to train a region of interest model.
- target : predict tumor proliferation score based on mitosis counting.
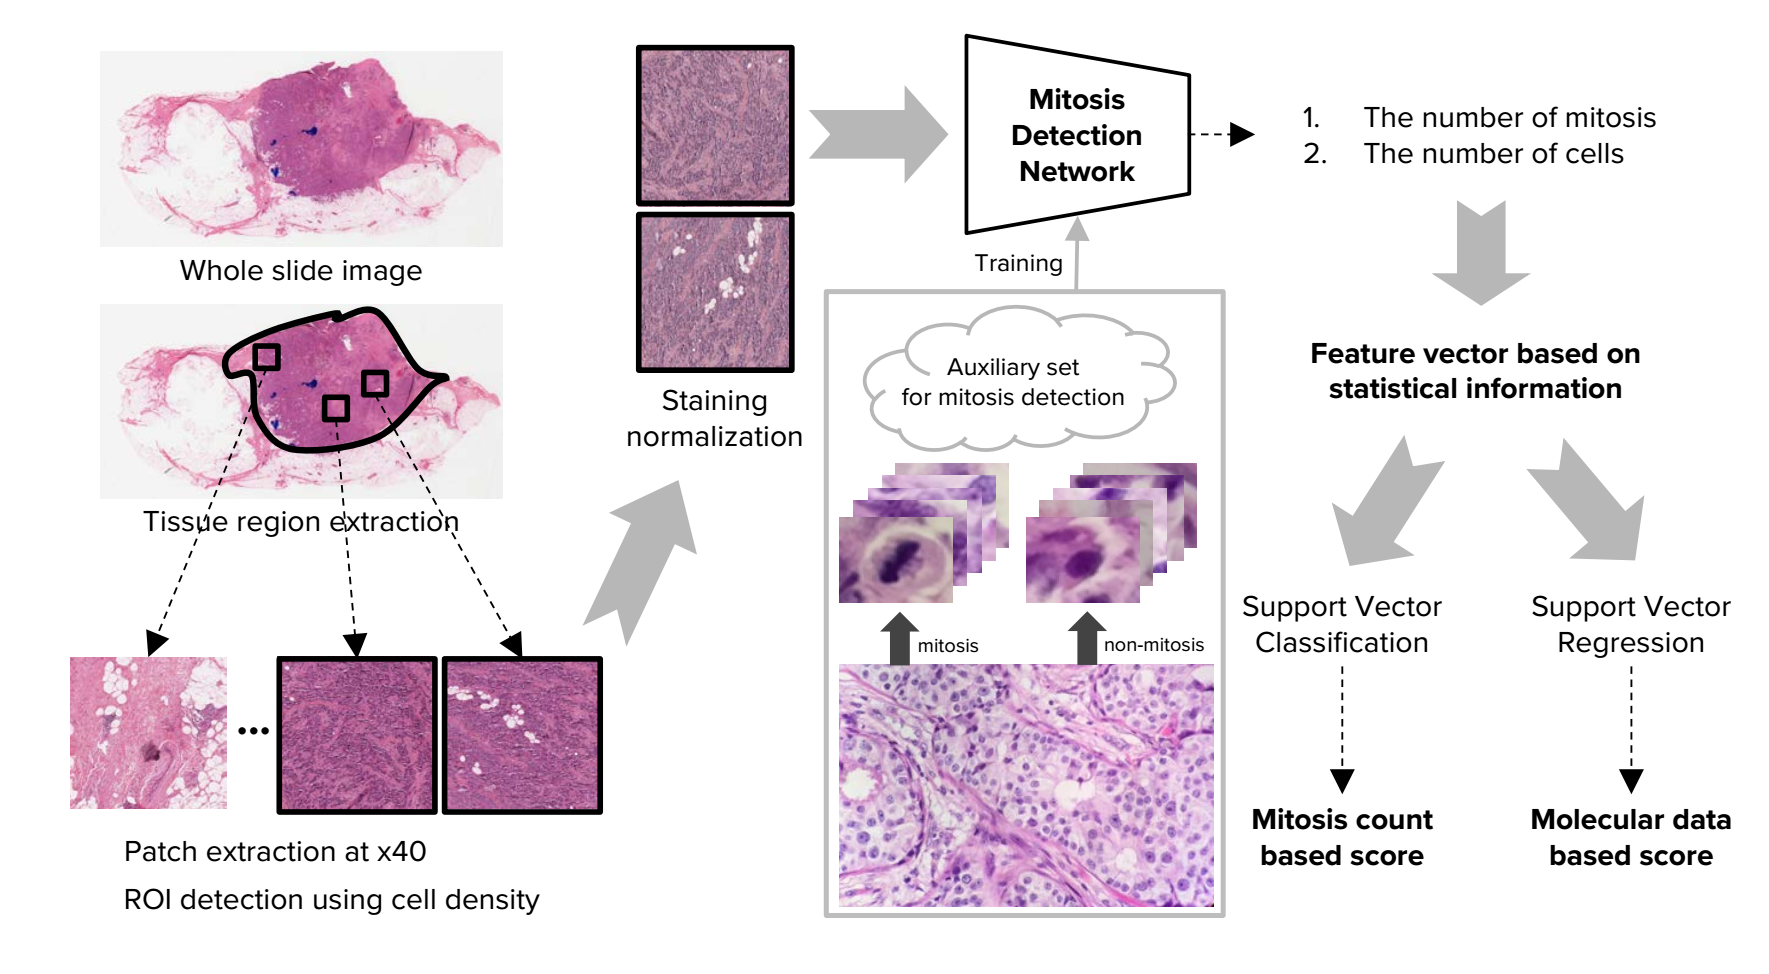
1, Whole Slide Images Handling
1) Tisuue region and patch extraction.The size of the patches is 10HPFs.
2) ROI detection. According to the number of cells in each patch,the top k patches are chosen as ROIs.In this paper,k equals 30.
3) Staining normalization
2,CNN based Mitosis Detection
1), we randomly extract 180,000 normal patches and 70,000 random translation augmented mitosis patches from the training dataset. We perform a first-pass training of the network by using this initial dataset, and perform inference with the trained network weights to extract a list of image regions that the network has identified as false positive mitoses cases. After that, we build a new, second training dataset which consists of the same ground truth mitosis samples and normal samples from before, but with an additional 100,000 normal samples (i.e., false positives) generated with random translation augmentation from the initially trained network. In total, the new dataset consists of 70,000 mitosis patches and 280,000 normal patches. In the second training step, the final detection network is trained from scratch using the new training dataset
2), Although we train the network using small patches (i.e.,specific mitosis regions), the patches we ultimately infer on during the test phase are 10 HPFs regions sampled from WSIs, which are approximately 6000 x 6000 pixels. One way to perform prediction is to divide the ROI patch into patches of equal size to the training images, but this would incur large computation costs.
Therefore, we convert the trained network to a fully convolutional network [10] at the inference stage, which allows our trained network to perform inference on an entire 10HPFs image with a single forward pass.However, the prediction results based on the fully convolutional network is
not identical to that of original network. We call this problem the zero padding effect. There are two reasons for the zero padding effect: (1) ResNet has a large receptive field because the depth of the network is very large. (2) The residual block in ResNet has many zero padding to retain the spatial dimension. Thus, the receptive field of the trained network includes zero padding regions as shown in Fig.4
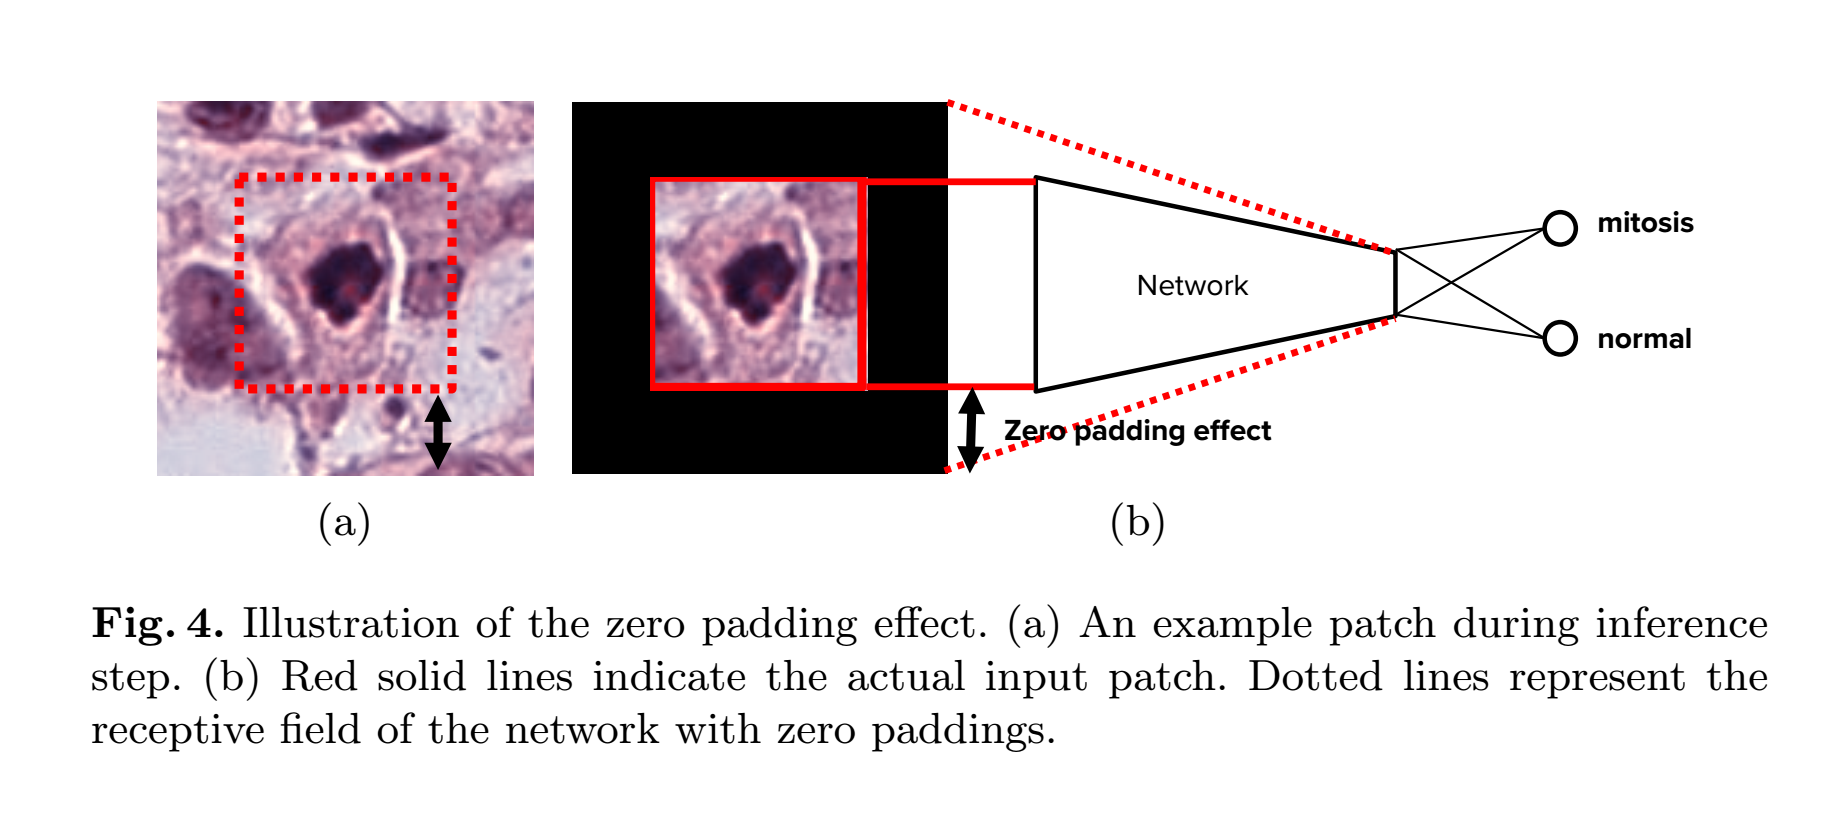
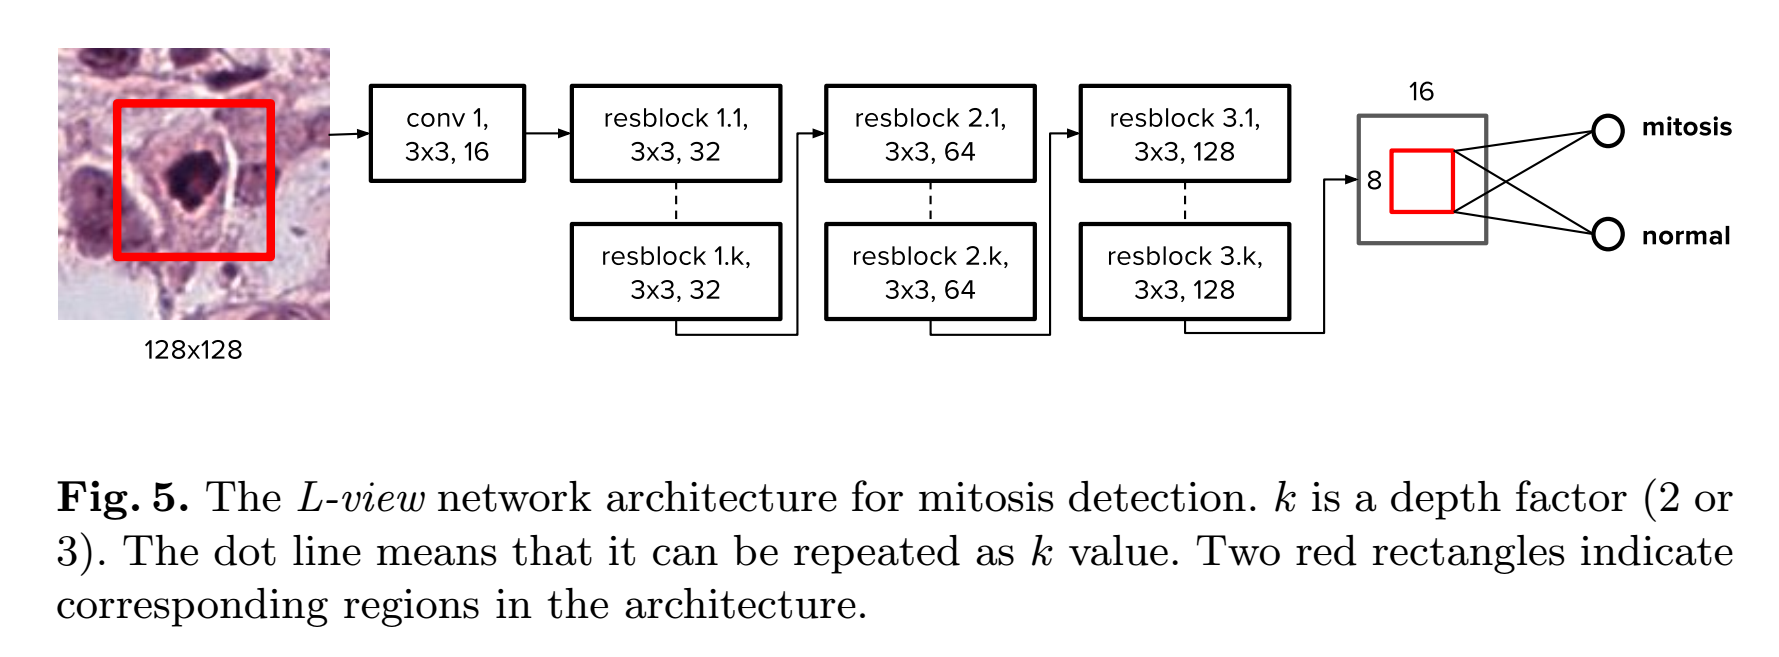
In order to alleviate this problem, we introduce a novel architecture named largeview (L-view) model(Fig.5). Although the L-view architecture has 128 x 128 input size, in the final layer(the result is a scalar,so it is not a layer and the last layer is the layer before the result), we only use a smaller region corresponding to a 64 x 64 region in the input patch. Fig. 5 shows the L-view architecture. Only the region corresponding to this smaller region is activated at the global pooling layer. This allows the zero padding region to be ignored in the training phase and consequently solves the problem of the zero padding effect.(难点 :将一个种input size 训练出来的FCN,应用到另外一种input size)
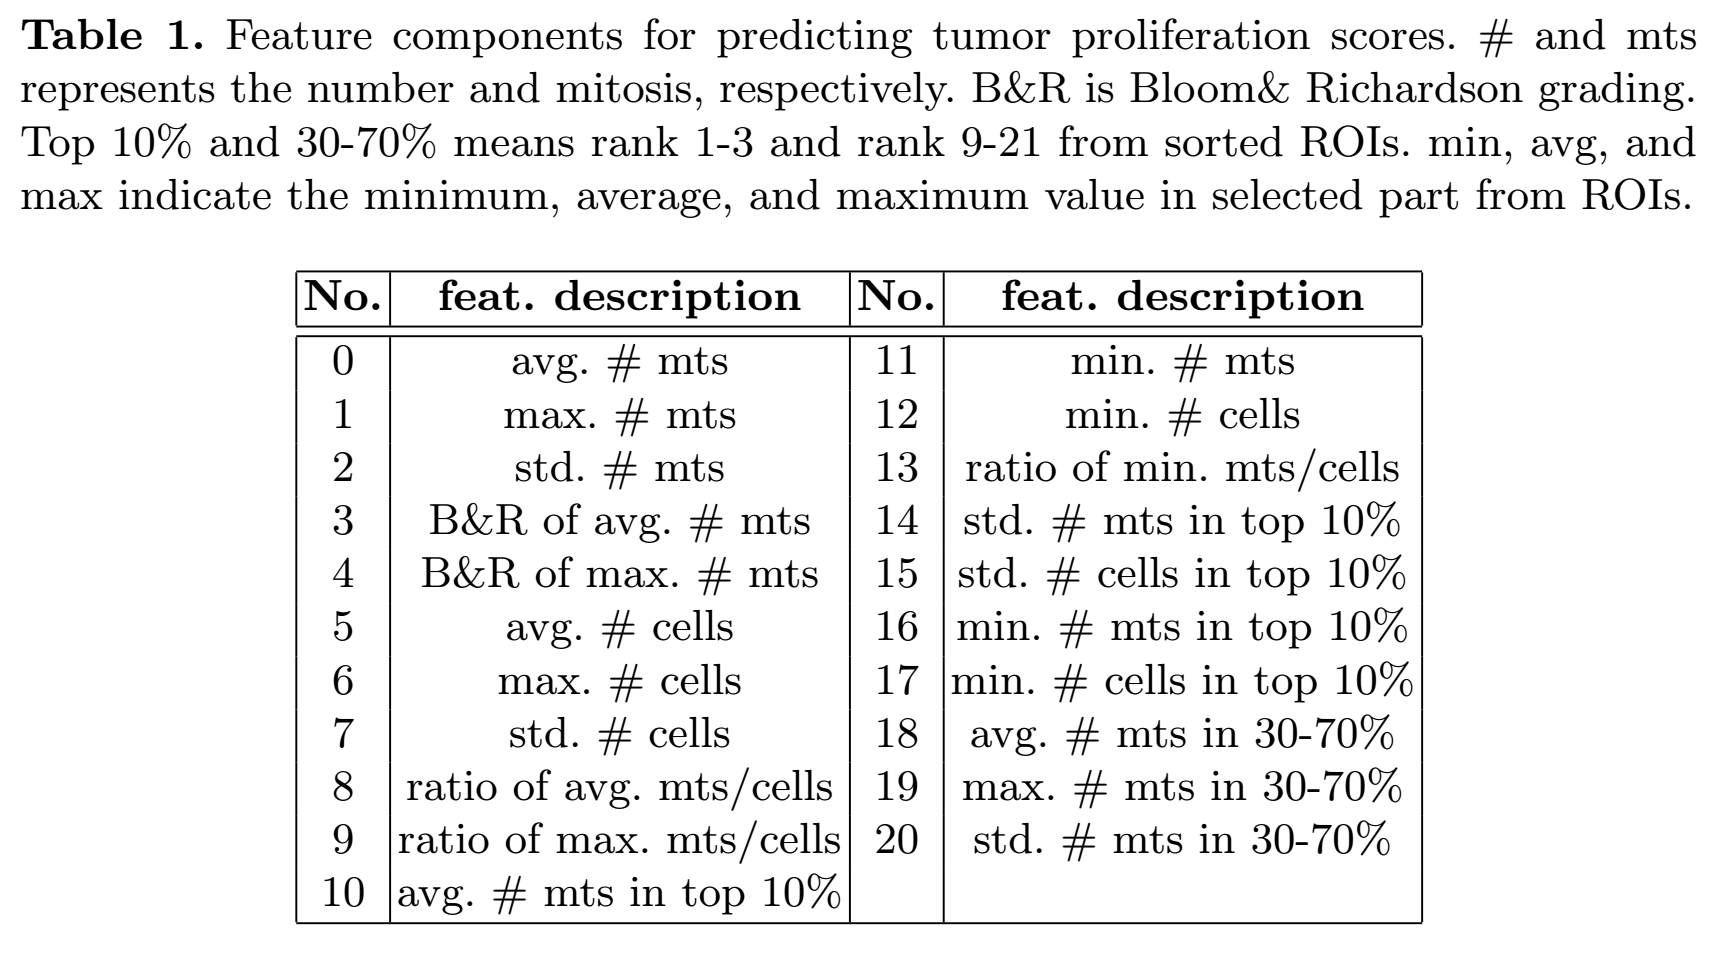
3, Tumor Proliferation Score Prediction. Apated SVM model and Features to bechoosen(Fig.6):
总结:这篇文章中利用了有丝分裂区域图像(小尺寸,128*128)训练了一个FCN网络,去完成在大尺寸图片中对有丝分裂区域的 detection。并注意到了 zero-padding 的影响。


 253
253


 被折叠的 条评论
为什么被折叠?
被折叠的 条评论
为什么被折叠?
 到【灌水乐园】发言


