


A Unified Framework(统一的框架) for Tumor Proliferation Score Prediction(肿瘤增值评分预测) in Breast Histopathology
在乳腺组织病理学上肿瘤增值评分预测的统一框架
代码位置:https://github.com/CODAIT/deep-histopath
摘要
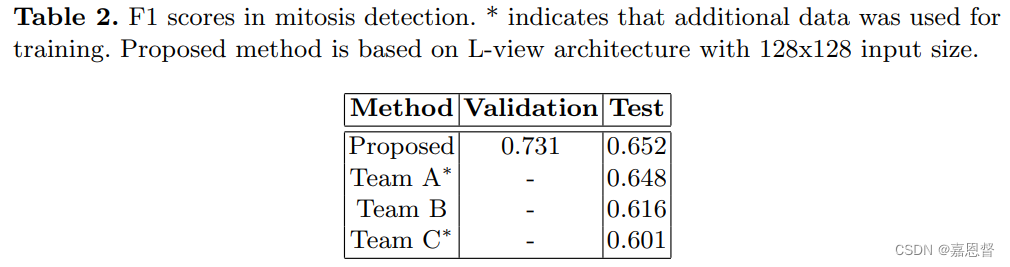
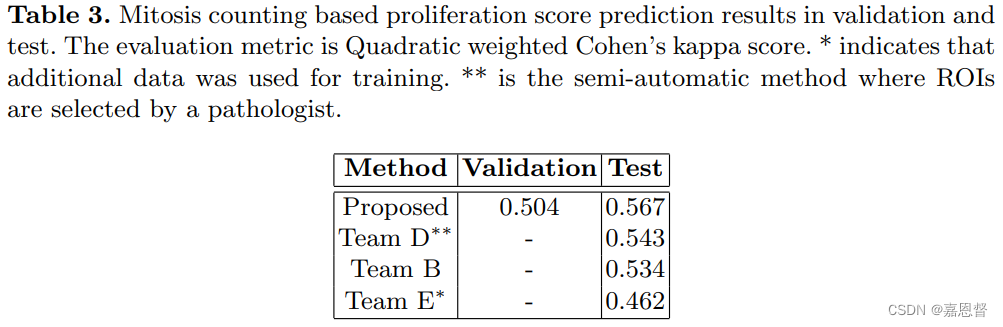
作者介绍了自己在2016 MICCAI grand challenge 由三个模块组成(数据处理、检测、评分)的自动化肿瘤增值评分方案。肿瘤评分预测的Quadratic Weighted Cohen’s Kappa分数为0.567,有丝分裂检测F1分数为0.652.
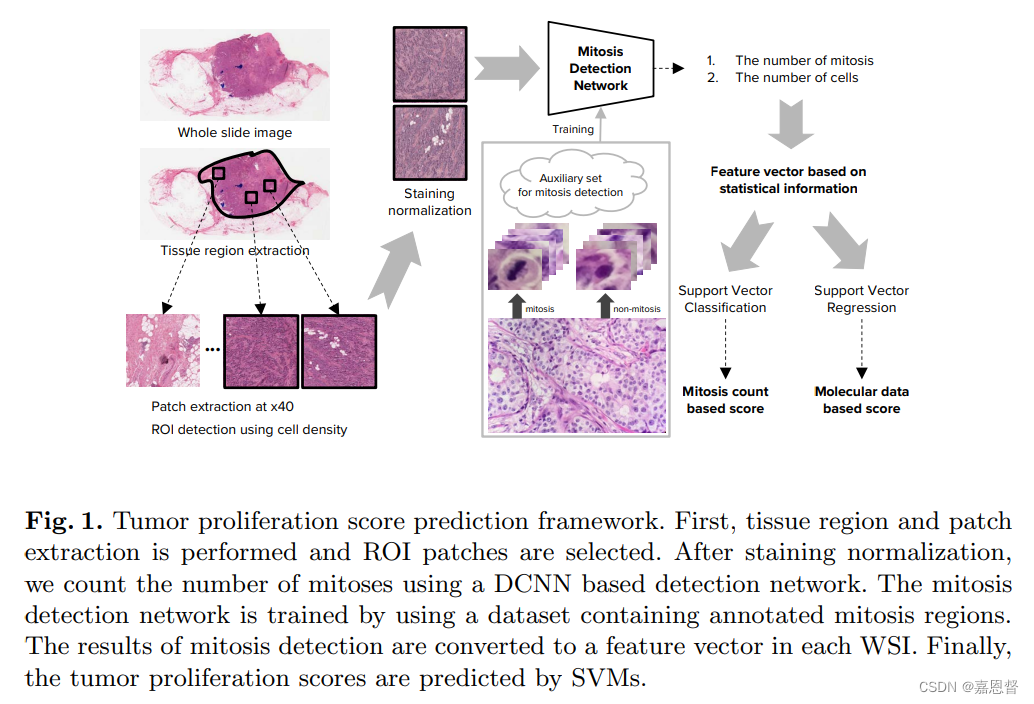
Our system offers a fully automated solution to predicting both a molecular(分子的) data-based, and a mitosis counting-based tumor proliferation score.
我们的系统提供了一个完全自动化的解决方案,它基于分子数据以及有丝分裂计数来实现肿瘤增殖的预测评分。
The framework integrates three modules, each fine-tuned to maximize the overall performance: An image processing component for handling whole slide images, a deep learning based mitosis detection network, and a proliferation scores prediction module.
本框架整合并微调三个模型来最大化总体系统性能,它们分别是:全视野数字切片(whole slide images, WSIs)图像处理组件,深度学习有丝分裂检测网络,以及增值预测评分模块。
We have achieved 0.567 quadratic weighted Cohen’s kappa in mitosis counting-based score prediction and 0.652 F1-score in mitosis detection.
我们在有丝分裂计数的基础上评分预测达到了0.567加权平方的Cohen’s kappa统计系数大小,以及有丝分裂检测的F1指标达到了0.652
用于评价多个医生诊断结果一致性的 Cohen’s Kappa 统计系数,Kappa还可用于评估替代分类的评估方法之间的一致性。
Kappa系数就可以解释为预测准确率减去Baseline得到的额外正确率,除以1减去baseline得到的剩余可提升正确率
Cohen’s Kappa
C
o
h
e
n
′
s
K
a
p
p
a
=
1
−
1
−
a
c
c
1
−
p
c
=
1
−
e
r
r
o
r
b
a
s
e
l
i
n
e
e
r
r
o
r
Cohen's \quad Kappa=1-\frac{1-acc}{1-p_c}=1-\frac{error}{baseline\quad error}
Cohen′sKappa=1−1−pc1−acc=1−baselineerrorerror
p
c
p_c
pc随机打乱预测的平均准确率
p
c
=
1
N
2
∑
k
n
k
1
n
k
2
p_c=\frac{1}{N^2}\sum_k n_{k1}n_{k2}
pc=N21k∑nk1nk2
其中k是第k个预测类别,
n
k
1
n_{k1}
nk1和
n
k
2
n_{k2}
nk2分别是真实值和预测值在第k个类别的个数。
Quadratic Weighted Cohen’s Kappa
Q
u
a
d
r
a
t
i
c
W
e
i
g
h
t
e
d
C
o
h
e
n
′
s
K
a
p
p
a
=
1
−
Q
u
a
d
r
a
t
i
c
W
e
i
g
h
t
e
d
e
r
r
o
r
Q
u
a
d
r
a
t
i
c
W
e
i
g
h
t
e
d
b
a
s
e
l
i
n
e
e
r
r
o
r
Quadratic\quad Weighted\quad Cohen's \quad Kappa=1-\frac{Quadratic\quad Weighted \quad error}{Quadratic Weighted\quad baseline\quad error}
QuadraticWeightedCohen′sKappa=1−QuadraticWeightedbaselineerrorQuadraticWeightederror
F1-score 又称为平衡F分数(balanced F Score)精确率和召回率的调和平均数
F 1 − S c o r e = 2 1 p r e c i s i o n + 1 r e c a l l = 2 × p r e c i s i o n × r e c a l l p r e c i s i o n + r e c a l l F1-Score = \frac{2}{\frac{1}{precision}+\frac{1}{recall}}=2\times \frac{precision\times recall}{precision+recall} F1−Score=precision1+recall12=2×precision+recallprecision×recall
引言
首先说明肿瘤增值速度评估的必要性,然后引出深度学习方法。同时说明从很大的全视野数字切片(WSI)中提取感兴趣的ROI区域需要专业人士进行标注。
Tumor proliferation speed is an important biomarker(生物标志物) for estimating the prognosis(预后) of breast cancer patients. The mitotic count is part of the Bloom & Richardson grading system, and a well-recognized prognostic factor.
肿瘤增值速度是是评估乳腺癌病人预后的重要生物指标。有丝分裂计数是Bloom & Richardson评分系统的一部分,是公认的预后影响指标。
The latter family of algorithms have advanced the performance of automatic mitosis detection to near-human levels, offering promise in addressing the problem of subjectivity and reproducibility
后一类算法已经将自动有丝分裂检测的性能提高到接近人类的水平,为解决主观性和重复性问题带来希望
Our system participated in a well-recognized challenge and was able to outperform other systems in each subtask, as well as in the final proliferation score prediction task, validating the design choices of each module, as well as the capability of the integrated system.
我们的系统参加了一个公认的挑战,在每个子任务和最终增殖分数预测任务中都优于其他系统,这验证了每个模块的选择设计与系统集成的能力。
Methodology(方法论)
Whole Slide Image Handling(全数字图像切片处理)
-
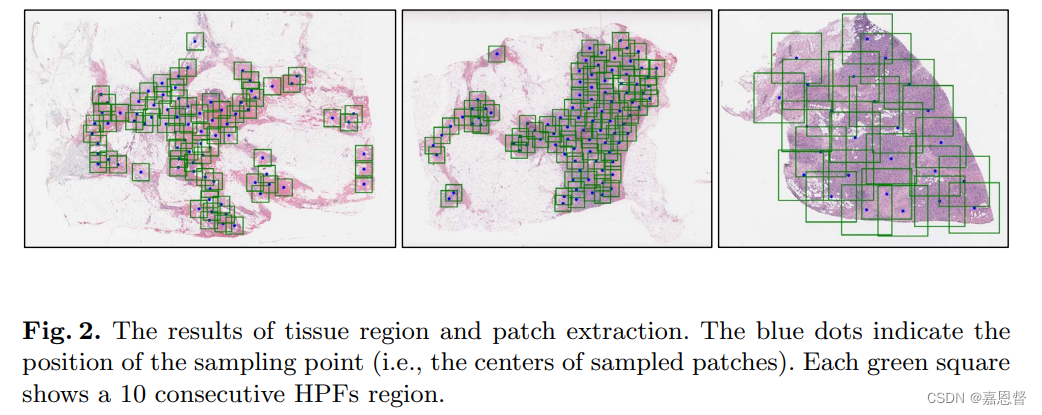
Tissue region and patch extraction(组织区域与斑块提取)
作者定义每个高功率谱区域为一个正方形(为啥不用圆?)
Recalling the fact that Bloom & Richardson (B&R) grading depends on the number of mitoses within a 10 consecutive high power fields (HPFs) region, an area of approximately 2 m m 2 2 mm^2 2mm2, we extract patches corresponding to 10 HPFs.
Bloom & Richardson (B&R)分级取决于10个连续高功率场(HPFs)区域内的有丝分裂数,这个区域面积约为 2 m m 2 2 mm^2 2mm2,我们提取对应于10HPFs的patch。
-
Region of interests detection(感兴趣区域检测)
作者估计了一个WSI的每个patch的细胞数量然后排序选取前K个细胞多的patch作为感兴趣区域,考虑到计算能力作者选择K=30
To select region of interests (ROIs) from the sampled patches, we utilize the fact that there are generally many mitoses in regions with high cell density. We use CellProfiler [3,7], to estimate the cell density of the patches.
我们用实际中细胞密度高的区域通常有许多有丝分裂细胞,来采样的斑块中选择感兴趣的区域(ROI),并使用CellProfiler方法来估计patch的细胞密度 -
Staining normalization(染色标准化)
网络训练与介绍
-
训练过程
patch的大小是 128 × 128 128\times 128 128×128,同时作者使用两阶段训练:在初始数据集上训练网络,然后识别后面的数据集中的假阳性有丝分裂区域进行数据增强,最后新的数据集包含7万个有丝分裂patch以及28万个正常区域。然后重新开始训练。 -
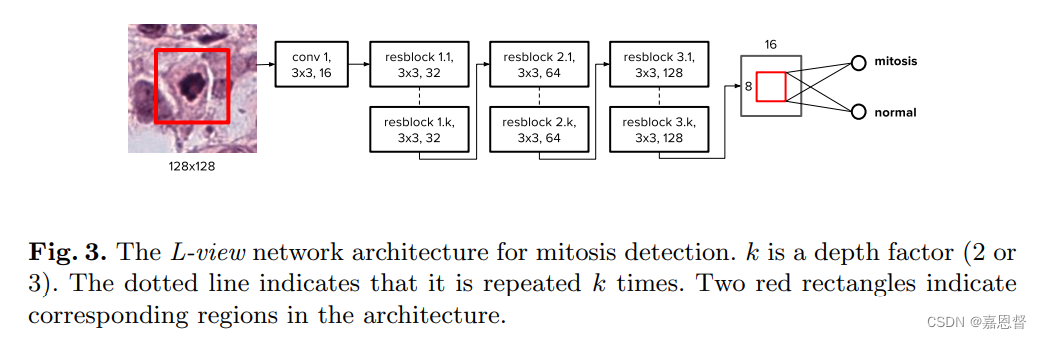
网络结构
作者使用的是ResNet,包含6或者9个残差块,其中作者说的标准细分方法我不明白是什么方法,然后作者提出了L-view网络来缓解零填充等导致的性能不足的问题:限制最后池化有效区域为Fig3中的红框区域,对应原图中心 64 × 64 64 \times 64 64×64的区域。
However, although the fully convolutional approach is much faster, it fails to exactly match the performance of the standard subdivision approach. This problem arises from the large discrepancy between the input size of the network during training and inference when using the fully convolutional technique, exacerbated by the ResNet’s large depth leading to a larger receptive field and corresponding larger zero-padding exposure.
然而,尽管完全卷积方法要快得多,但它不能完全匹配标准细分方法的性能。
这个问题是由于使用完全卷积技术时,在训练和推断期间,网络的输入大小之间存在较大的差异,ResNet的大深度导致更大的接收域和相应的更大的零填充,使得这一问题更加严重。
Although the L-view architecture has 128x128 input size, in the final global pooling layer, we only activate a smaller region corresponding to the central 64 x 64 region in the input patch.
虽然L-view架构的输入大小是
128
×
128
128\times128
128×128,但在最终的全局池化层中,我们只激活了一个较小的区域,对应于输入补丁中中央的
64
×
64
64 \times 64
64×64区域。
Tumor Proliferation Score Prediction(肿瘤评分预测)
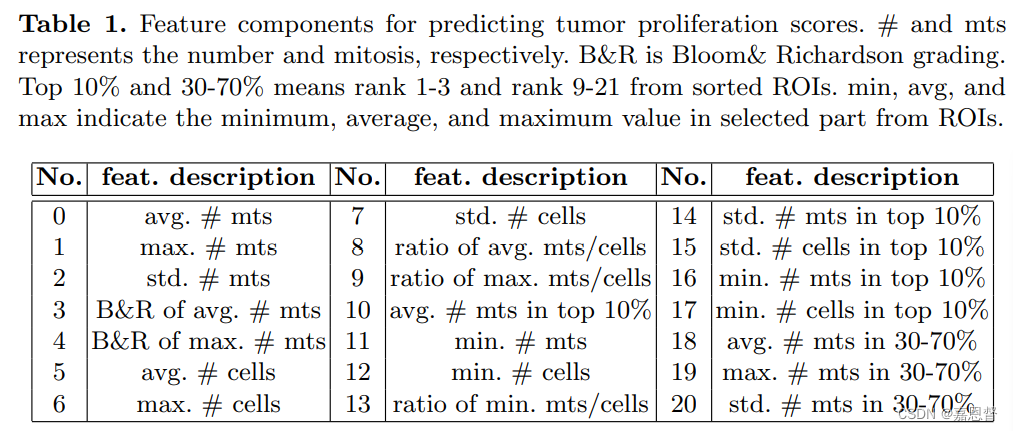
作者通过支持向量机来找相关性最大的特征,作者使用的特征包括每个patch的有丝分裂数、细胞数以及21个统计信息(如tabel1所示),作者最后补充实际只用了14个维度特征
We performed 10-fold cross validation using 500 training pairs with various C values of support vector machines (SVMs) with radial basis function (RBF) kernel in which the gamma of RBF kernel is fixed to 1/the dimension of feature.
我们使用500对不同C值的支持向量机(SVM)进行10倍交叉验证,核函数为径向基函数(RBF),其中的gamma为RBF核固定为1/特征维数
结果
数据集介绍
使用TUPAC数据集,其中的辅助数据集用于构建有丝分裂检测器,其他数据用于验证和测试
Secondly, to train the entire system, we used the main dataset which consists of 500 training
WSIs and 321 testing WSIs. Each WSI has two corresponding scores, a mitosis counting based score indicating one of three classes and a molecular data based score [10] which is a continuous value. To validate the entire system, we used10-fold cross validation.
其次,为了对整个系统进行训练,我们使用了包含500次训练的主数据集WSIs和321次测试WSIs。每个WSI都有两个相应的分数,一个基于有丝分裂计数的分数表示三个类别中的一个,一个基于分子数据的分数是一个连续的值。为了验证整个系统,我们使用10倍交叉验证。
实验
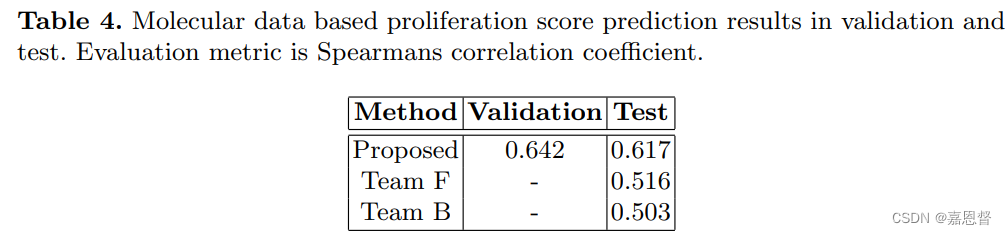
作者通过SVM结果证明了有丝分裂数量与瘤增殖速度具有高度的相关性,各个模块得分如表2到表4所示。
The performance of the entire system is based on two evaluation metrics: quadratic weighted Cohen’s kappa for the mitosis counting based score and Spearman’s correlation coefficient for the molecular based score.
整个系统的性能基于两个评价指标:有丝分裂计数基础评分的二次加权Cohen’s kappa和分子基础评分的斯皮尔曼相关系数
The learning rate is 0.1 for the first 8 epochs of the first training phase, and 0.1, 0.01 and 0.001 for 8, 12 and 14 epochs of the second training phase.
第一阶段前8个epoch的学习速率为0.1,第二阶段8、12、14个epoch的学习速率为0.1、0.01、0.001。
We evaluated quadratic weighted Cohen’s kappa score using 10-fold cross validation and found the best feature combination. The min related feature values were found to be unimportant, so features 11, 12, 13, 16, 17 were removed from the combination list. Finally, we found the best performance
to be shown by a 12 dimensional feature vector of the features 0, 1, 2, 3, 4, 5, 6, 7,10, 15, 18, 20 from TABLE 1. The C value of SVMs was 0.03125.
我们使用10倍交叉验证法评估二次加权Cohen’s kappa评分,并找到最佳特征组合。我们发现最小相关特征值不重要,将特征11、12、13、16、17从组合列表中删除。最后,我们发现由特征0、1、2、3、4、5、6、7组成的12维特征向量所表现出的最佳性能,表1中的10、15、18、20。支持向量机的C值为0.03125。
总结
这篇文章提出了三个模块,做数据处理、检测、评分;在检测方面通过两阶段训练,将假阳性数据提取出来进行数据增强,同时关注了zero-padding对网络性能的影响,并提出了SVM评分预测肿瘤增值。
词汇记录
tedious and subjective 乏味并主观的
reproducibility 再现性 scenario 场景,设想
In a practical scenario 在实际情况中
Recalling the fact that 提及
For generality 概括的讲
参考内容
[1] A Unified Framework for Tumor Proliferation Score Prediction in Breast Histopathology原文
[2] Cohen’s Kappa 统计系数:
[3] Quadratic Weighted Kappa 详解
[4] F1-score


 311
311


 被折叠的 条评论
为什么被折叠?
被折叠的 条评论
为什么被折叠?
 到【灌水乐园】发言


