


 该篇博客介绍了如何使用Python的matplotlib库来绘制观测值与预测值的对比图,并展示了如何保存图片、绘制多张图片以及创建多张子图的方法。示例代码中详细演示了不同图例、坐标轴限制、网格线以及图例设置等技巧。此外,还提到了如何通过for循环实现批量作图和设置子图大小。
需求描述:画图对比观测值和预测值,绘制对比图及多张子图
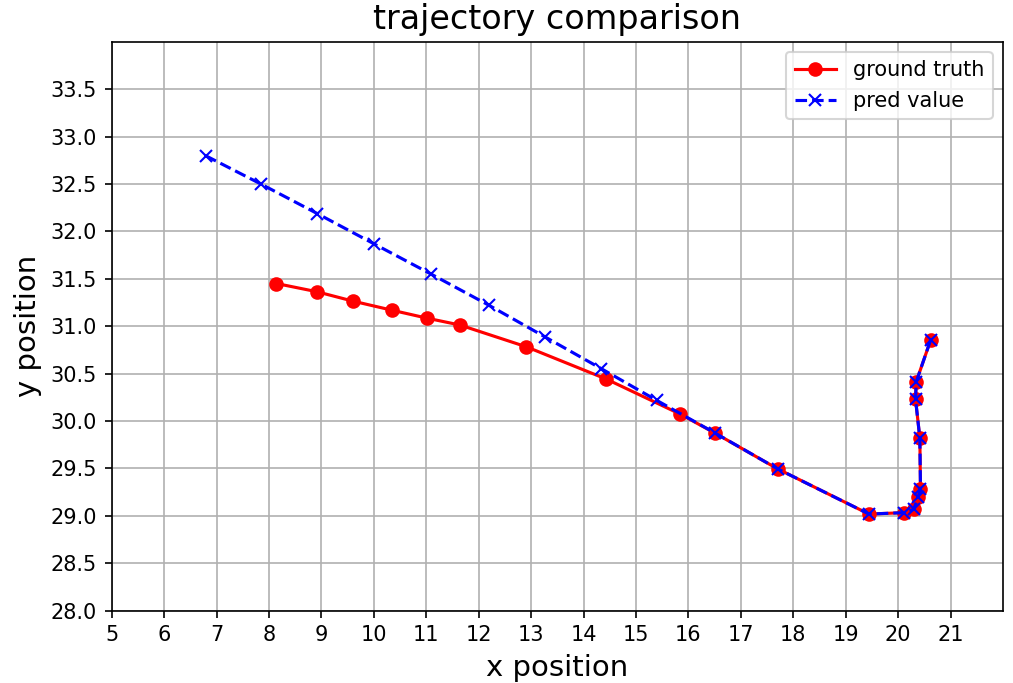
绘制对比图
-
示例代码
import matplotlib.pyplot as plt
import numpy as np

obs_x_data = [20.61782455, 20.3446064, 20.33182907, 20.41394997, 20.42613411, 20.38294792, 20.29493904, 20.11700439, 19.44220352, 17.69989204,
			  16.50032616, 15.84687519, 14.43702602, 12.91092873, 11.64278507, 11.01664066, 10.34288025, 9.60017872, 8.91129875, 8.14001083]

obs_y_data = [30.85092926, 30.41317368, 30.22782707, 29.81970787, 29.28694534, 29.19682884, 29.06859398, 29.03396034, 29.01906776, 29.49583817,
			  29.87446022, 30.07171631, 30.44148064, 30.78217125, 31.01222801, 31.08432961, 31.16893959, 31.26436996, 31.36372185, 31.45003319]

pred_x_data = [20.61782455, 20.3446064, 20.33182907, 20.41394997, 20.42613411, 20.38294792, 20.29493904, 20.11700439, 19.44220352, 17.69989204,
			   16.50027275, 15.39491463, 14.33294296, 13.27159023, 12.1923933, 11.0963583, 10.00212288, 8.92199039, 7.85391903, 6.7955761]

pred_y_data = [30.85092926, 30.41317368, 30.22782707, 29.81970787, 29.28694534, 29.19682884, 29.06859398, 29.03396034, 29.01906776, 29.49583817,
			   29.87576103, 30.21777916, 30.55349922, 30.88473892, 31.22133636, 31.54788208, 31.86850739, 32.18684769, 32.4966507, 32.79633331]

plt.figure(figsize=(12, 7.5))
plt.plot(obs_x_data, obs_y_data, 'ro', linestyle='solid',  label='ground truth')
plt.plot(pred_x_data, pred_y_data, 'bx', linestyle='dashed', label='pred value')
plt.xlim(5, 22)
plt.ylim(28, 34)
x_ticks = np.arange(5, 22, 1)
y_ticks = np.arange(28, 34, 0.5)
plt.xticks(x_ticks)
plt.yticks(y_ticks)
plt.ylabel('y position', fontsize=14)
plt.xlabel('x position', fontsize=14)
plt.legend(loc='upper right', ncol=1, fancybox=True, shadow=True)
plt.title("trajectory comparison", fontsize=16)
plt.legend()  	# 显示图例
plt.grid(True)  # 显示网格线
plt.show()		# 显示图片
-
如果想保存图片
... plt.savefig('/your/path/test.png') # 将图片数据写入文件 plt.show() # 将图片数据发送到用户界面库以进行显示 -
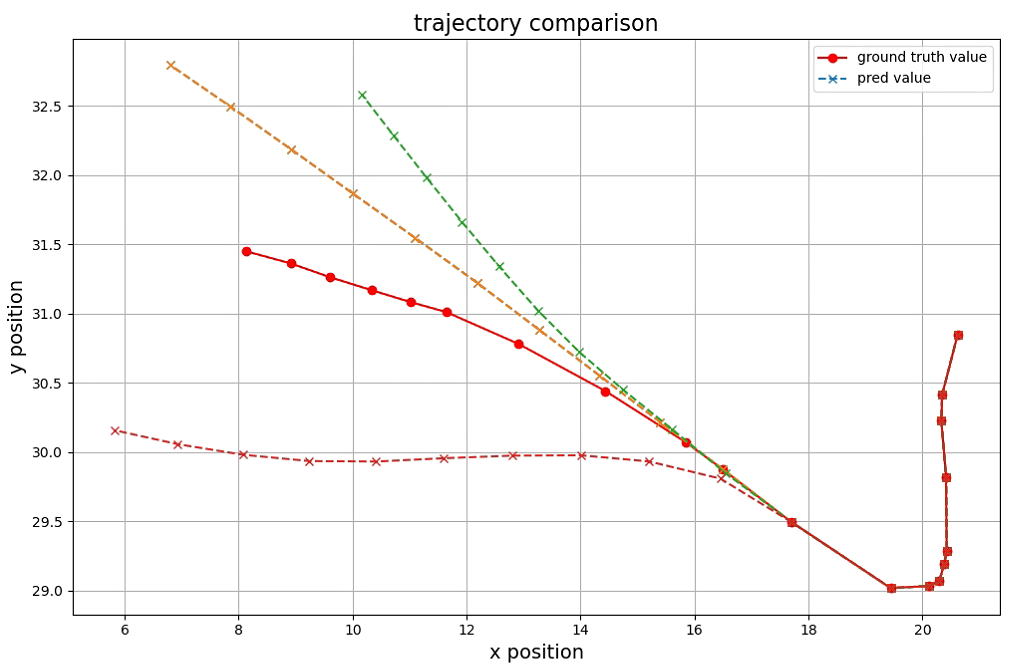
如果想画多张图片:比如多个目标targets + 多条轨迹trajectories
for target in range(len(targets)): for index in range(len(trajectories)): plt.figure(figsize=(12, 7.5)) ... plt.plot() ... plt.show() # 注意在for循环外,for循环画多张图,循环结束后显示多张图片 -
如果想给图片设置不同编号index和像素dpi
for target in range(len(targets)):
	for index in range(len(trajectories)):
		plt.figure(figsize=(12, 7.5))
		...
		plt.plot()
		...
		# 设置不同图片编号和像素
		plt.savefig('your/path/test_{}.png'.format(index), dpi = 200)
	plt.show()
matplotlib默认像素值是100,即如果输出8 x 6空间单位的图,那么就能提供8*100 x 6*100像素的图片文件
绘制多张子图
-
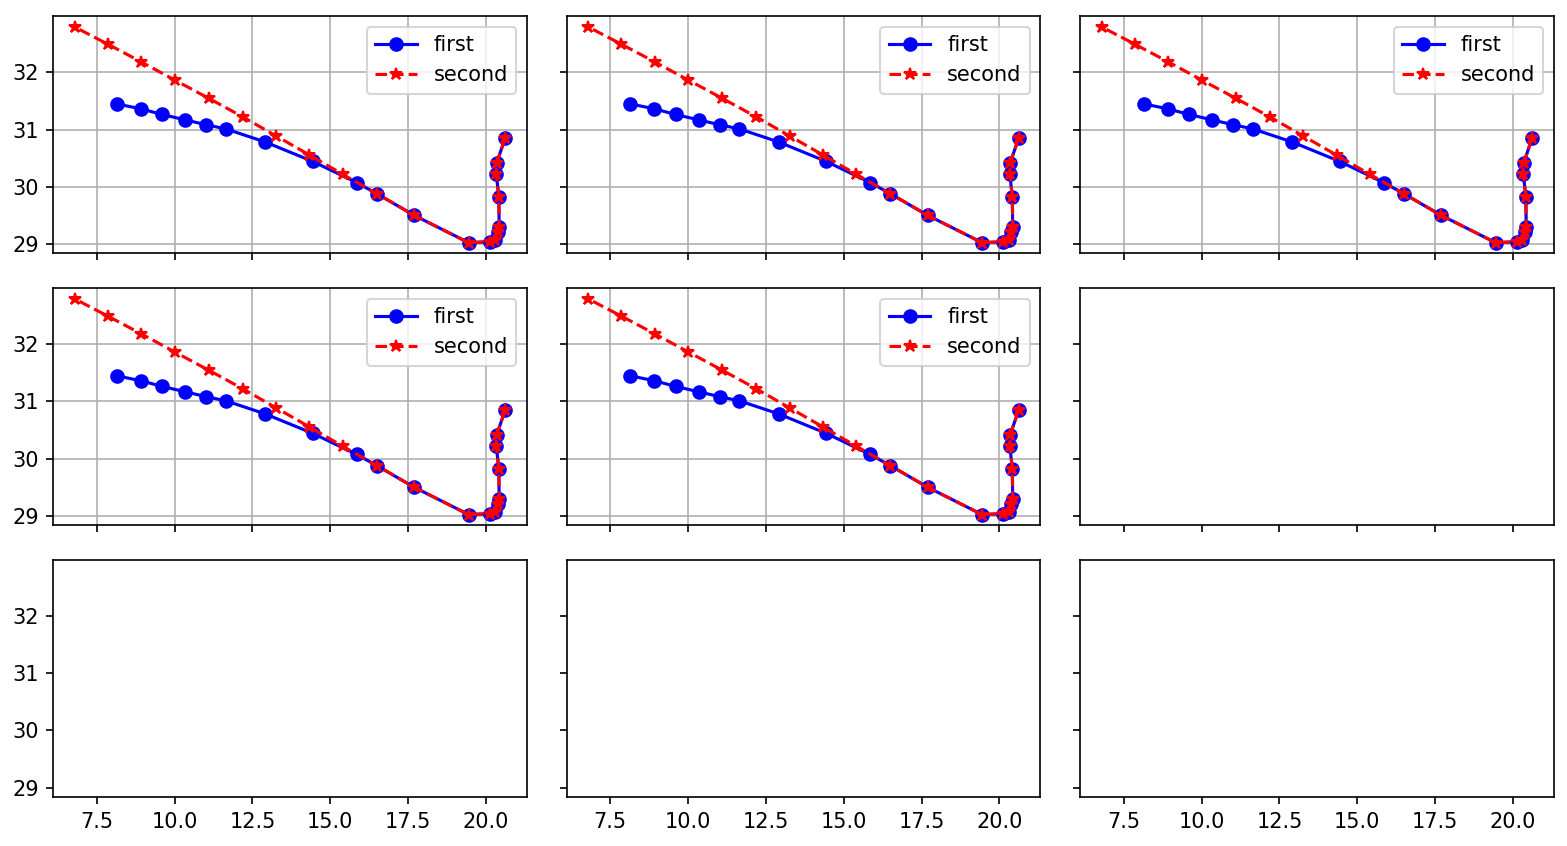
方法1:plt.subplots
import matplotlib.pyplot as plt

obs_x_data = [20.61782455, 20.3446064, 20.33182907, 20.41394997, 20.42613411, 20.38294792, 20.29493904, 20.11700439, 19.44220352, 17.69989204,
			  16.50032616, 15.84687519, 14.43702602, 12.91092873, 11.64278507, 11.01664066, 10.34288025, 9.60017872, 8.91129875, 8.14001083]

obs_y_data = [30.85092926, 30.41317368, 30.22782707, 29.81970787, 29.28694534, 29.19682884, 29.06859398, 29.03396034, 29.01906776, 29.49583817,
			  29.87446022, 30.07171631, 30.44148064, 30.78217125, 31.01222801, 31.08432961, 31.16893959, 31.26436996, 31.36372185, 31.45003319]

pred_x_data = [20.61782455, 20.3446064, 20.33182907, 20.41394997, 20.42613411, 20.38294792, 20.29493904, 20.11700439, 19.44220352, 17.69989204,
			   16.50027275, 15.39491463, 14.33294296, 13.27159023, 12.1923933, 11.0963583, 10.00212288, 8.92199039, 7.85391903, 6.7955761]

pred_y_data = [30.85092926, 30.41317368, 30.22782707, 29.81970787, 29.28694534, 29.19682884, 29.06859398, 29.03396034, 29.01906776, 29.49583817,
			   29.87576103, 30.21777916, 30.55349922, 30.88473892, 31.22133636, 31.54788208, 31.86850739, 32.18684769, 32.4966507, 32.79633331]

target_num = 23             # 23个目标,需要画23张子图
target_count = 0            # 目标计数
ROW_NUM, COL_NUM = 3,3      # 每张图3 x 3 = 9张子图
for plot_num in range(0, target_num, ROW_NUM * COL_NUM):
    figure, axis = plt.subplots(nrows=ROW_NUM, ncols=COL_NUM, sharex='all', sharey='all', figsize=(8, 5))   # 共享x轴和y轴;设置figure大小为 8 * 5
    sub_figure_index = []
    for i in range(axis.shape[0]):
        for j in range(axis.shape[1]):
            sub_figure_index.append(axis[i, j])
    for index in range(ROW_NUM * COL_NUM):
        if target_count == target_num:
            break
        sub_figure_index[index].plot(obs_x_data, obs_y_data, 'bo', linestyle='solid', label='first')
        sub_figure_index[index].plot(pred_x_data, pred_y_data, 'r*', linestyle='dashed', label='second')
        sub_figure_index[index].grid(True)
        sub_figure_index[index].legend(loc='upper right')
        target_count += 1
    plt.tight_layout()
    # plt.savefig('your/path/figure_{}.png'.format(plot_num / (ROW_NUM * COL_NUM)), dpi=200)
    plt.show()
-
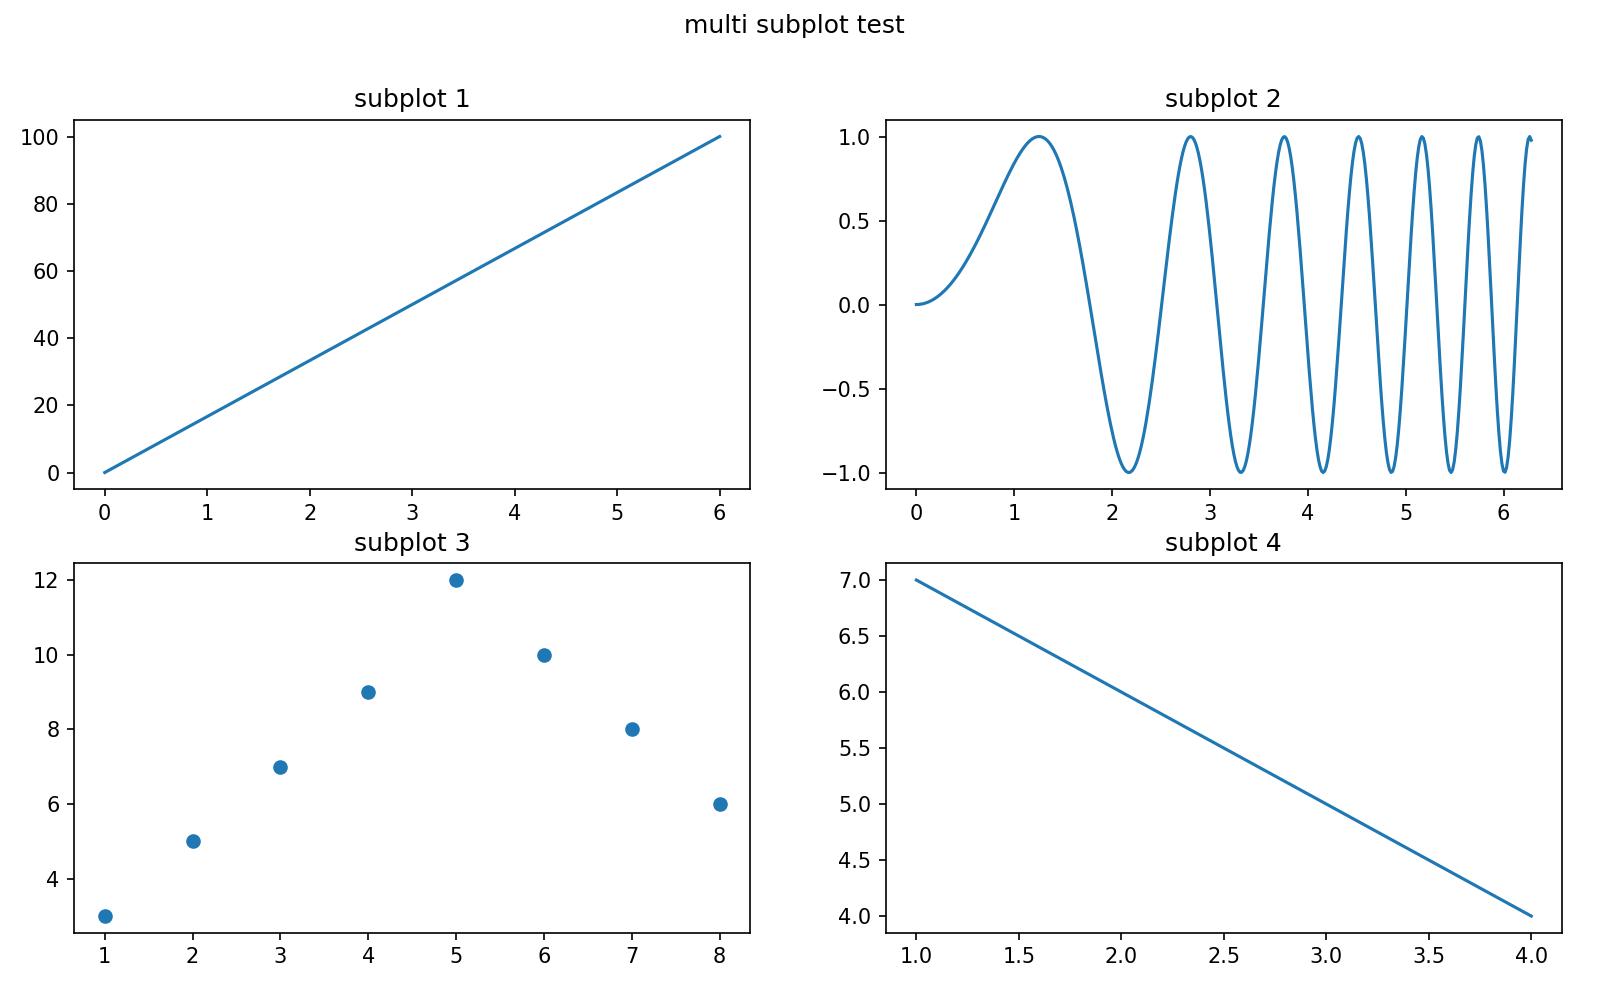
方法2:plt.subplot
import matplotlib.pyplot as plt
import numpy as np

# plot 1:
x = np.array([0, 6])
y = np.array([0, 100])

plt.subplot(2, 2, 1)
plt.plot(x,y)
plt.title("subplot 1")

# plot 2:
x = np.linspace(0, 2*np.pi, 400)
y = np.sin(x**2)

plt.subplot(2, 2, 2)
plt.plot(x,y)
plt.title("subplot 2")

# plot 3:
x = np.array([1, 2, 3, 4, 5, 6, 7, 8])
y = np.array([3, 5, 7, 9, 12, 10, 8, 6])

plt.subplot(2, 2, 3)
plt.scatter(x,y)
plt.title("subplot 3")

# plot 4:
x = np.array([1, 2, 3, 4])
y = np.array([7, 6, 5, 4])

plt.subplot(2, 2, 4)
plt.plot(x,y)
plt.title("subplot 4")

plt.suptitle("multi subplot test")
plt.show()
- 绘制极坐标图可用:fig, axs = plt.subplots(2, 2, subplot_kw=dict(projection=“polar”))
参考文章:
matplotlib可视化
matplotlib存储多张图片
savefig()函数的参数使用
绘制多张子图
一张图中画多个数据
matplotlib设置图例
for循环每次循环画一个图
matplotlib绘制多个子图
设置子图大小
created by shuaixio, 2022.06.19


 878
878

 被折叠的 条评论
为什么被折叠?
被折叠的 条评论
为什么被折叠?
 到【灌水乐园】发言


