


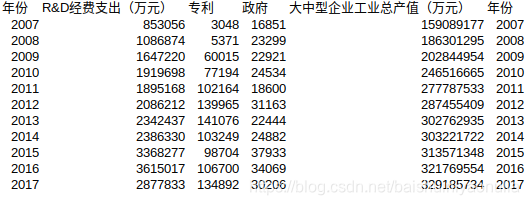
假设有CSV文件(部分):suzhou.csv
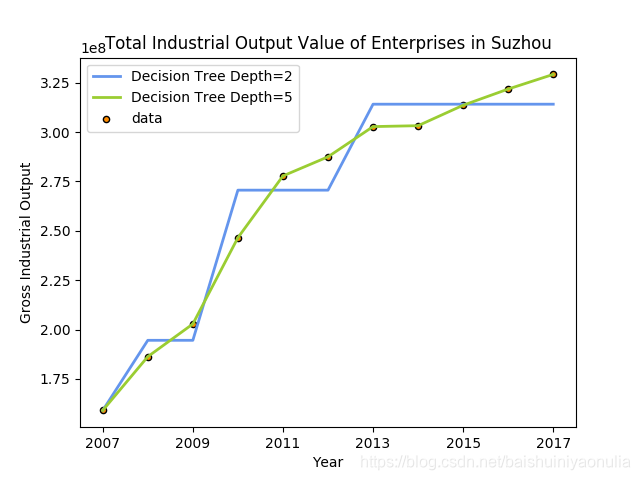
要对其进行回归分析并输出图像:
import numpy as np
from sklearn.tree import DecisionTreeRegressor
import matplotlib.pyplot as plt

data = np.genfromtxt("/suzhou.csv",delimiter=",",dtype=int,skip_header=1,usecols=np.arange(0,6))
data = data.transpose()

X = np.array(data[0]).reshape(len(data[0]),1)
y = np.array(data[4]).reshape(len(data[4]),1)

regr_1 = DecisionTreeRegressor(max_depth=2, presort=False)
regr_2 = DecisionTreeRegressor(max_depth=5, presort=False)
regr_1.fit(X, y)
regr_2.fit(X, y)

X_test = np.arange(2007, 2018, 0.9)[:, np.newaxis].astype(int)
y_1 = regr_1.predict(X_test)
y_2 = regr_2.predict(X_test)

x_axis = range(2007,2018,2)

plt.figure()
plt.scatter(X, y, s=20, edgecolor="black", c="darkorange", label="data")
plt.plot(X_test, y_1, color="cornflowerblue", label="Decision Tree Depth=2", linewidth=2)
plt.plot(X_test, y_2, color="yellowgreen", label="Decision Tree Depth=5", linewidth=2)
plt.xticks(x_axis)
plt.xlabel("Year")
plt.ylabel("Gross Industrial Output")
plt.title("Total Industrial Output Value of Enterprises in Suzhou")
plt.legend()
plt.show()
输出图像:


 966
966

 被折叠的 条评论
为什么被折叠?
被折叠的 条评论
为什么被折叠?
 到【灌水乐园】发言


