


 本文解析了一次量化金融比赛,涉及通过大数据和机器学习方法预测股票价格走势。任务是基于历史L1snapshot数据,使用CatBoost模型进行时间序列回归预测,并利用F1score作为评估指标。文章介绍了数据结构、特征工程和模型训练的基本步骤。
赛题解析与解题思路
赛题背景
量化金融可以理解为是金融中的数据科学,通过统计和数据分析,为投资选择方向。量化投资是指利用数学模型和计算机技术进行投资决策的一种投资方式。量化投资的核心是建立量化模型,通过对大量历史数据的分析,找出投资标的的规律,进而预测未来的走势,从而制定投资策略。
本赛事通过大数据与机器学习的方法和工具,理解市场行为的原理,通过数据分析和模型创建量化策略,采用历史数据,验证量化策略的有效性,并且通过实时数据进行评测。
赛事任务
给定数据集: 给定训练集(含验证集), 包括10只股票在79个交易日的L1snapshot数据, 数据已进行规范化和隐藏处理。其中,前64个交易日为训练数据,用于训练;后15个交易日为测试数据,不能用于训练。
L1snapshot是指股票在某个时间点的快照数据,包括当前买卖盘的挂单量和价格,以及最近成交的价格和成交量等信息。L1snapshot数据的时间间隔为1秒,每天交易时间为09:30:00-11:30:00和13:00:00-15:00:00,共计6.5小时,每天共计23400个L1snapshot数据。
但在本场比赛中,行情频率为3秒一个数据点——也称为1个tick的snapshot。
赛题数据集和评价指标
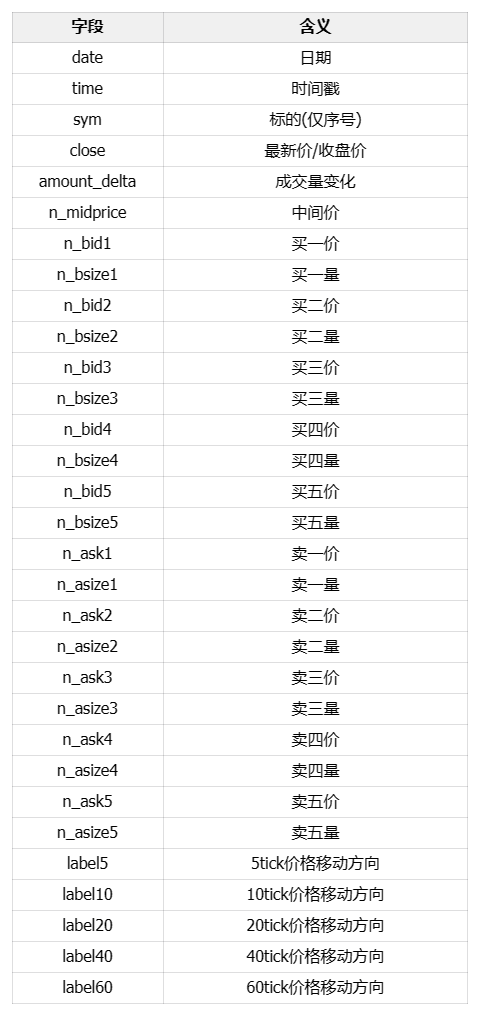
- 行情频率:3秒一个数据点
- 每个数据点包括当前最新成交价/五档量价(买一价、买一量、买二价、买二量等)/过去3秒内的成交金额等数据;
- 训练集中每个数据点包含5个预测标签的标注;允许利用过去不超过100tick(包含当前tick)的数据,预测未来N个tick后的中间价移动方向。其中N的值为5、10、20、40、60个tick,即在t时刻,分别预测t+5tick,t+10tick,t+20tick,t+40tick,t+60tick以后: 最新中间价相较t时刻的中间价的涨跌方向(下跌/不变/上涨)。
本赛题使用macro-F1 score作为评价指标,即对每个样本计算5个类别的F1 score的平均值,最终的评价指标为5个类别的F1 score的平均值。其中,F1 score的计算方式如下:
F1 score = 2 * (precision * recall) / (precision + recall),其中precision = TP / (TP + FP),recall = TP / (TP + FN)。
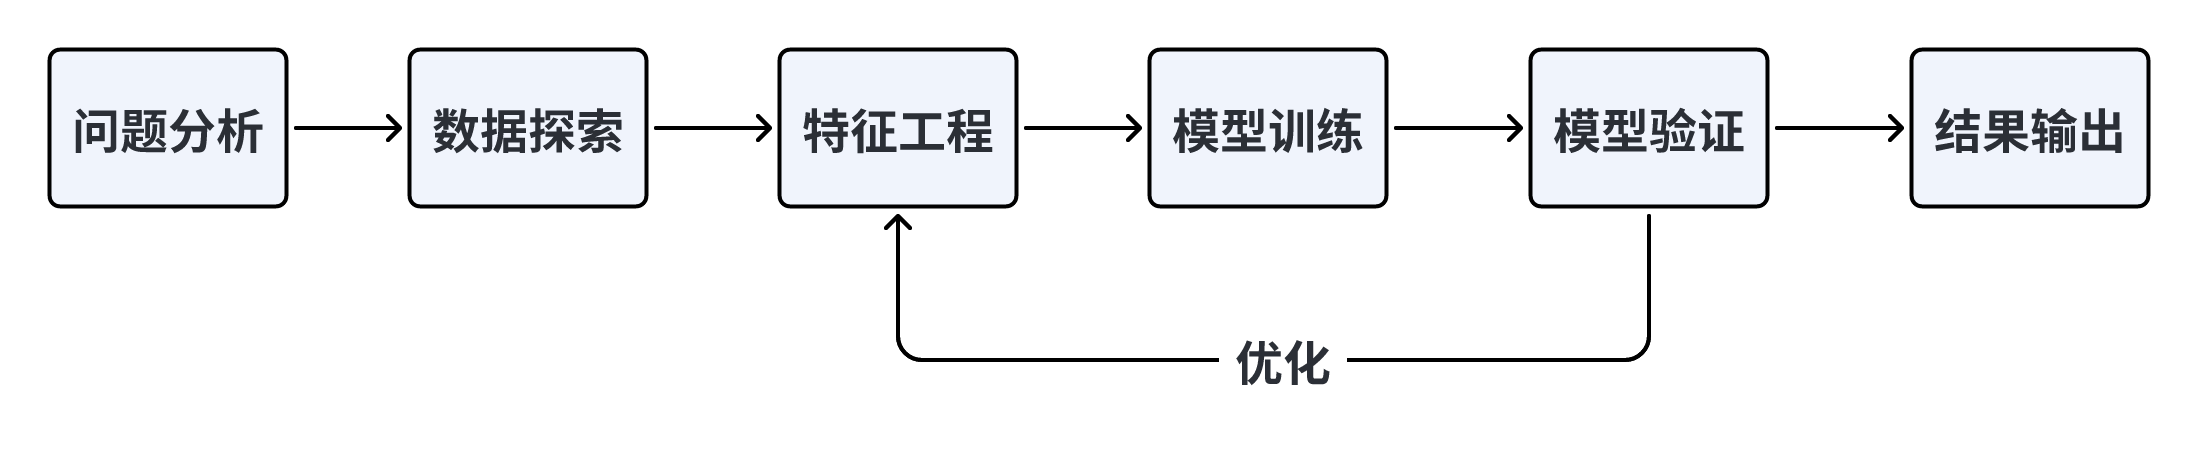
解题思路
本赛题需要根据过往及当前数据预测未来中间价的移动方向。这种AI量化任务是典型的时间序列回归预测问题。一般遵守下面的解题流程
Baseline实践
CatBoost模型是一种基于梯度提升决策树的机器学习方法,它可以应用于各种任务,包括分类、回归、排序、预测和检测。CatBoost的主要优势是可以有效地处理类别特征和数值特征,而无需对数据进行预处理。CatBoost支持CPU和GPU训练,并且在训练过程中使用了对称树来提高训练效率。CatBoost还提供了可视化工具,可以可视化训练过程中的学习曲线,以及特征重要性等。
下面的baseline在原有的基础上,使用copilot对新手第一次接触数据竞赛做了注释。
# 解压数据集
_ = !unzip -qo AI量化模型预测挑战赛公开数据.zip
# 将需要的库导入到程序中
import numpy as np
import pandas as pd
from catboost import CatBoostClassifier
from sklearn.model_selection import StratifiedKFold, KFold, GroupKFold
from sklearn.metrics import accuracy_score, f1_score, roc_auc_score, log_loss, mean_squared_log_error
import tqdm, sys, os, gc, argparse, warnings
import matplotlib.pyplot as plt
# 为了在notebook中显示图形,而不是弹出窗口,使用下一行代码
warnings.filterwarnings('ignore')
数据探索
# 读取数据
path = 'AI量化模型预测挑战赛公开数据/'
# 常见的读取文件的形式,分train和test两个文件夹,使用pd进行读取
# train_files 的类型是list,里面是train文件夹下的所有文件名
train_files = os.listdir(path+'train')
train_df = pd.DataFrame()
# 介绍tqdm
# tqdm是一个快速,可扩展的Python进度条,可以在Python长循环中添加一个进度提示信息,用户只需要封装任意的迭代器tqdm(iterator)。
for filename in tqdm.tqdm(train_files):
    tmp = pd.read_csv(path+'train/'+filename)
    tmp['file'] = filename
    # pd.concat的意思是
    # axis=0,表示在竖直方向上合并
    # ignore_index=True,表示忽略原来的索引,重新生成索引
    train_df = pd.concat([train_df, tmp], axis=0, ignore_index=True)

test_files = os.listdir(path+'test')
test_df = pd.DataFrame()
for filename in tqdm.tqdm(test_files):
    tmp = pd.read_csv(path+'test/'+filename)
    tmp['file'] = filename
    test_df = pd.concat([test_df, tmp], axis=0, ignore_index=True)
 10%|▉         | 121/1225 [00:03<00:34, 32.00it/s]


---------------------------------------------------------------------------

KeyboardInterrupt                         Traceback (most recent call last)

Cell In[14], line 15
     11     tmp['file'] = filename
     12     # pd.concat的意思是
     13     # axis=0,表示在竖直方向上合并
     14     # ignore_index=True,表示忽略原来的索引,重新生成索引
---> 15     train_df = pd.concat([train_df, tmp], axis=0, ignore_index=True)
     17 test_files = os.listdir(path+'test')
     18 test_df = pd.DataFrame()


File E:\anaconda\envs\pytorch\lib\site-packages\pandas\core\reshape\concat.py:298, in concat(objs, axis, join, ignore_index, keys, levels, names, verify_integrity, sort, copy)
     94 """
     95 Concatenate pandas objects along a particular axis with optional set logic
     96 along the other axes.
   (...)
    283 ValueError: Indexes have overlapping values: ['a']
    284 """
    285 op = _Concatenator(
    286     objs,
    287     axis=axis,
   (...)
    295     sort=sort,
    296 )
--> 298 return op.get_result()


File E:\anaconda\envs\pytorch\lib\site-packages\pandas\core\reshape\concat.py:520, in _Concatenator.get_result(self)
    516             indexers[ax] = obj_labels.get_indexer(new_labels)
    518     mgrs_indexers.append((obj._mgr, indexers))
--> 520 new_data = concatenate_block_managers(
    521     mgrs_indexers, self.new_axes, concat_axis=self.bm_axis, copy=self.copy
    522 )
    523 if not self.copy:
    524     new_data._consolidate_inplace()


File E:\anaconda\envs\pytorch\lib\site-packages\pandas\core\internals\concat.py:73, in concatenate_block_managers(mgrs_indexers, axes, concat_axis, copy)
     70 vals = [ju.block.values for ju in join_units]
     72 if not blk.is_extension:
---> 73     values = concat_compat(vals, axis=blk.ndim - 1)
     74 else:
     75     # TODO(EA2D): special-casing not needed with 2D EAs
     76     values = concat_compat(vals)


File E:\anaconda\envs\pytorch\lib\site-packages\pandas\core\dtypes\concat.py:171, in concat_compat(to_concat, axis)
    167         else:
    168             # coerce to object
    169             to_concat = [x.astype("object") for x in to_concat]
--> 171 return np.concatenate(to_concat, axis=axis)


File <__array_function__ internals>:5, in concatenate(*args, **kwargs)


KeyboardInterrupt:
选择任意一个股票数据进行可视化分析,观察买价和卖价的关系。下面是对买价和卖价的简单介绍:
- 买价指的是买方愿意为一项股票/资产支付的最高价格。
- 卖价指的是卖方愿意接受的一项股票/资产的最低价格。
- 这两个价格之间的差异被称为点差;点差越小,该品种的流动性越高。
# 选择任意一个股票数据进行可视化分析,观察买价和卖价的关系
# 选取某一天的csv文件进行读取,并做图
cols = ['n_bid1','n_bid2','n_ask1','n_ask2']
tmp_df = train_df[train_df['file']=='snapshot_sym7_date22_pm.csv'].reset_index(drop=True)[-500:]
# reset_index(drop=True)表示重置索引,drop=True表示不保留原来的索引
# 这样可以重置横坐标的索引,从0开始
tmp_df = tmp_df.reset_index(drop=True).reset_index()
# 使用enumerate函数,可以同时获得索引和值,对cols进行迭代与画图
for num, col in enumerate(cols):
    plt.figure(figsize=(20,5))
    plt.subplot(4,1,num+1)
    plt.plot(tmp_df['index'],tmp_df[col])
    plt.title(col)
plt.show()
plt.figure(figsize=(20,5))

for num, col in enumerate(cols):
    plt.plot(tmp_df['index'],tmp_df[col],label=col)
plt.legend(fontsize=12)
# 绘制中间价
plt.figure(figsize=(20,5))
for num, col in enumerate(cols):
    plt.plot(tmp_df['index'],tmp_df[col],label=col)
plt.plot(tmp_df['index'],tmp_df['n_midprice'],label="n_midprice",lw=10)
plt.legend(fontsize=12)
train_df['wap1'] = (train_df['n_bid1']*train_df['n_bsize1'] + train_df['n_ask1']*train_df['n_asize1'])/(train_df['n_bsize1'] + train_df['n_asize1'])
test_df['wap1'] = (test_df['n_bid1']*test_df['n_bsize1'] + test_df['n_ask1']*test_df['n_asize1'])/(test_df['n_bsize1'] + test_df['n_asize1'])

tmp_df = train_df[train_df['file']=='snapshot_sym7_date22_pm.csv'].reset_index(drop=True)[-500:]
tmp_df = tmp_df.reset_index(drop=True).reset_index()
plt.figure(figsize=(20,5))
plt.plot(tmp_df['index'], tmp_df['wap1'])
特征工程
在特征工程阶段,构建基本的时间特征,提取小时、分钟等相关特征,主要是为了刻画不同时间阶段可能存在的差异性信息。需要注意数据是分多个文件存储的,所以需要进行文件合并,然后在进行后续的工作。
# 时间相关特征
train_df['hour'] = train_df['time'].apply(lambda x:int(x.split(':')[0]))
test_df['hour'] = test_df['time'].apply(lambda x:int(x.split(':')[0]))

train_df['minute'] = train_df['time'].apply(lambda x:int(x.split(':')[1]))
test_df['minute'] = test_df['time'].apply(lambda x:int(x.split(':')[1]))

# 入模特征
cols = [f for f in test_df.columns if f not in ['uuid','time','file']]
模型训练与验证
选择使用CatBoost模型,也是通常作为机器学习比赛的基线模型,在不需要过程调参的情况下也能得到比较稳定的分数。这里使用五折交叉验证的方式进行数据切分验证,最终将五个模型结果取平均作为最终提交。
def cv_model(clf, train_x, train_y, test_x, clf_name, seed = 2023):
    folds = 5
    kf = KFold(n_splits=folds, shuffle=True, random_state=seed)
    oof = np.zeros([train_x.shape[0], 3])
    test_predict = np.zeros([test_x.shape[0], 3])
    cv_scores = []

    for i, (train_index, valid_index) in enumerate(kf.split(train_x, train_y)):
        print('************************************ {} ************************************'.format(str(i+1)))
        trn_x, trn_y, val_x, val_y = train_x.iloc[train_index], train_y[train_index], train_x.iloc[valid_index], train_y[valid_index]

        if clf_name == "cat":
            params = {'learning_rate': 0.2, 'depth': 6, 'bootstrap_type':'Bernoulli','random_seed':2023,
                      'od_type': 'Iter', 'od_wait': 100, 'random_seed': 11, 'allow_writing_files': False,
                      'loss_function': 'MultiClass'}

            model = clf(iterations=100, **params)
            model.fit(trn_x, trn_y, eval_set=(val_x, val_y),
                      metric_period=20,
                      use_best_model=True,
                      cat_features=[],
                      verbose=1)

            val_pred  = model.predict_proba(val_x)
            test_pred = model.predict_proba(test_x)

        oof[valid_index] = val_pred
        test_predict += test_pred / kf.n_splits

        F1_score = f1_score(val_y, np.argmax(val_pred, axis=1), average='macro')
        cv_scores.append(F1_score)
        print(cv_scores)

    return oof, test_predict

for label in ['label_5','label_10','label_20','label_40','label_60']:
    print(f'=================== {label} ===================')
    cat_oof, cat_test = cv_model(CatBoostClassifier, train_df[cols], train_df[label], test_df[cols], 'cat')
    train_df[label] = np.argmax(cat_oof, axis=1)
    test_df[label] = np.argmax(cat_test, axis=1)
## 结果输出
import pandas as pd
import os


# 指定输出文件夹路径
output_dir = './submit'

# 如果文件夹不存在则创建
if not os.path.exists(output_dir):
    os.makedirs(output_dir)

# 首先按照'file'字段对 dataframe 进行分组
grouped = test_df.groupby('file')

# 对于每一个group进行处理
for file_name, group in grouped:
    # 选择你所需要的列
    selected_cols = group[['uuid', 'label_5', 'label_10', 'label_20', 'label_40', 'label_60']]

    # 将其保存为csv文件,file_name作为文件名
    selected_cols.to_csv(os.path.join(output_dir, f'{file_name}'), index=False)


 被折叠的 条评论
为什么被折叠?
被折叠的 条评论
为什么被折叠?
 到【灌水乐园】发言


