


原文:http://www.quantmod.com/examples/charting/
如果说有一个R领域有点欠缺的话,那就是用标准的财务图表工具来可视化金融、财务数据。quantmod提供了一个解决方案。
基本操作:
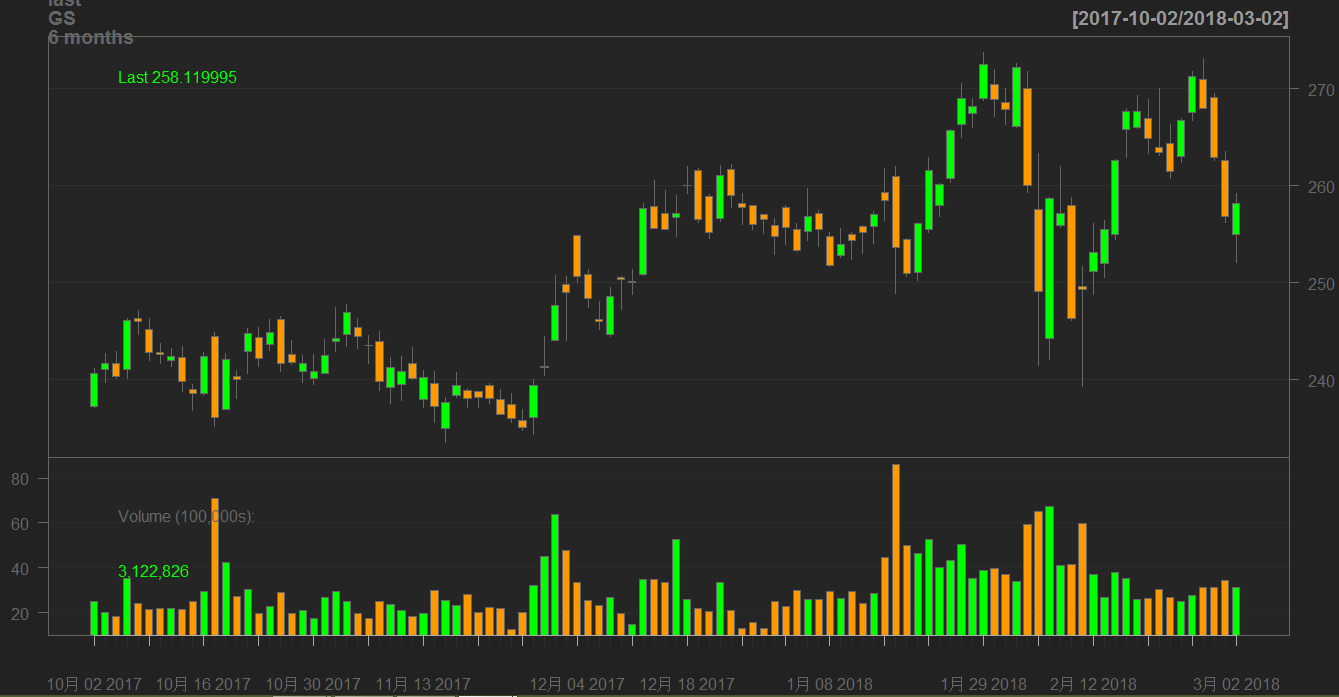
getSymbols("GS") #下载数据
chartSeries(last(GS, '6 months'))
结果:
稍微升级点:
barChart(GS,theme='white.mono',bar.type='hlc') 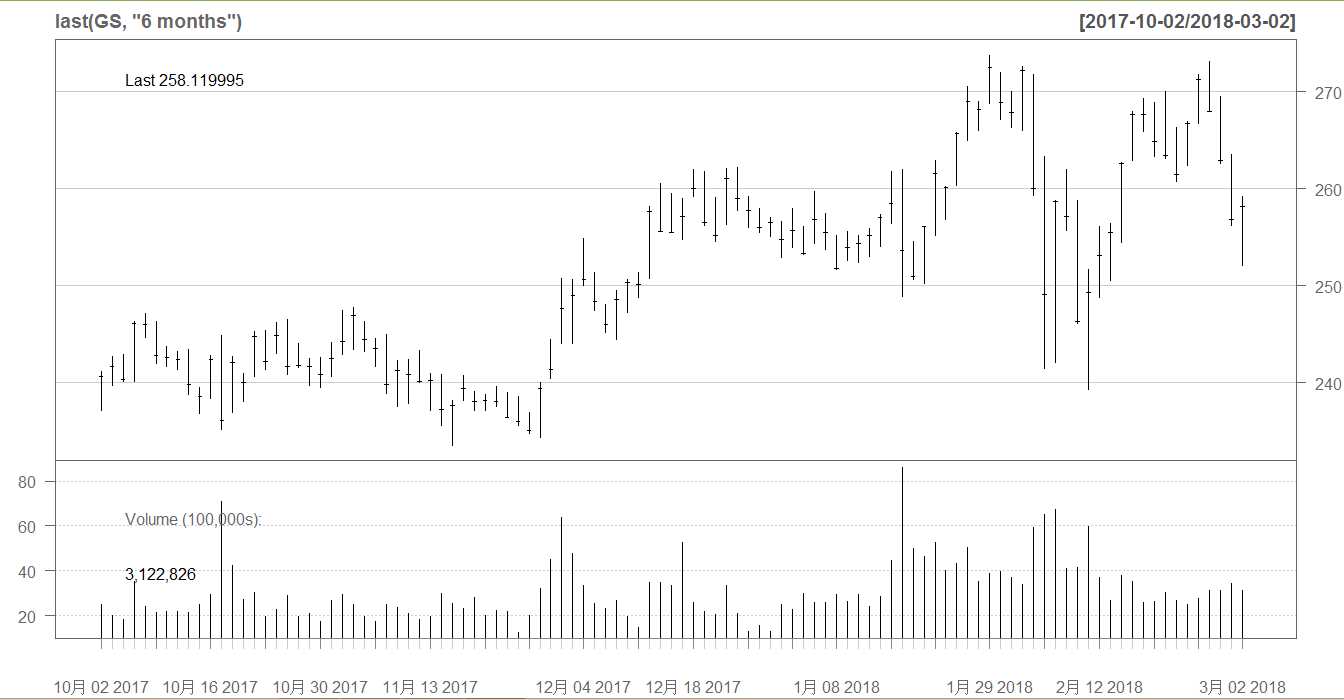
下面这个是彩色的:
candleChart(last(GS, '6 months'),multi.col=TRUE,theme='white')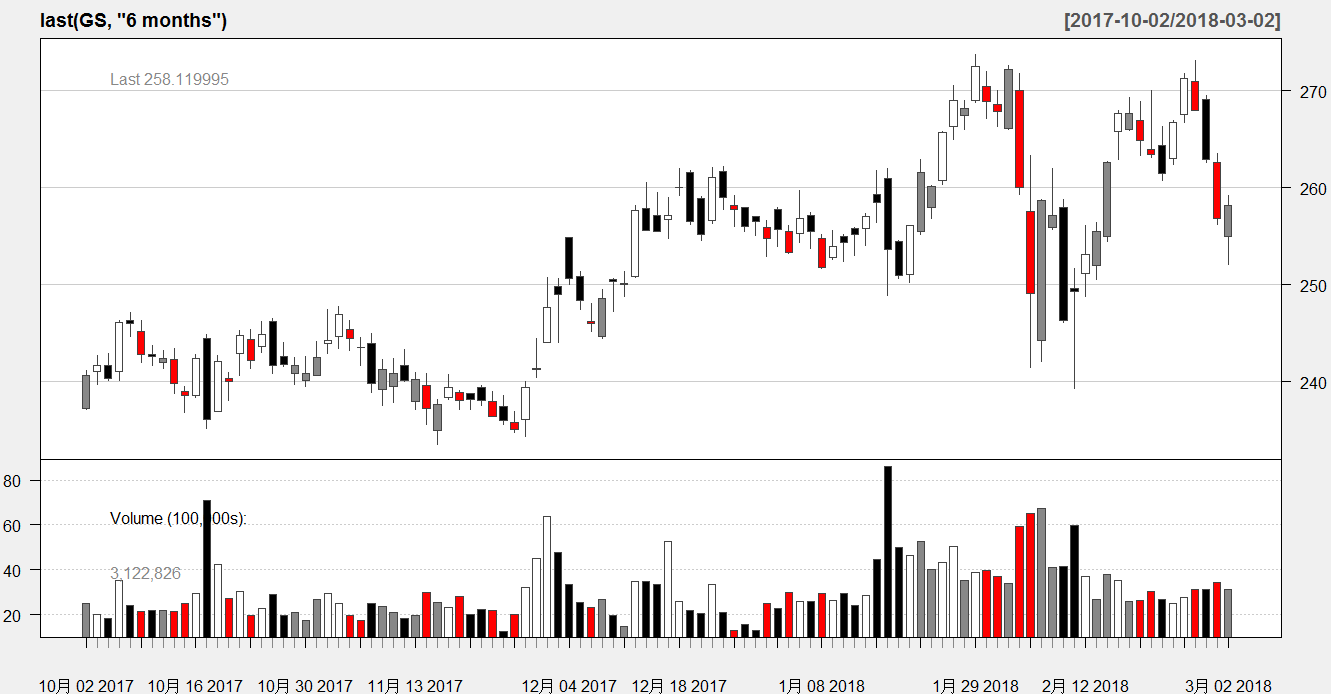
linechart:
lineChart(last(GS, '6 months'),line.type='h',TA=NULL) 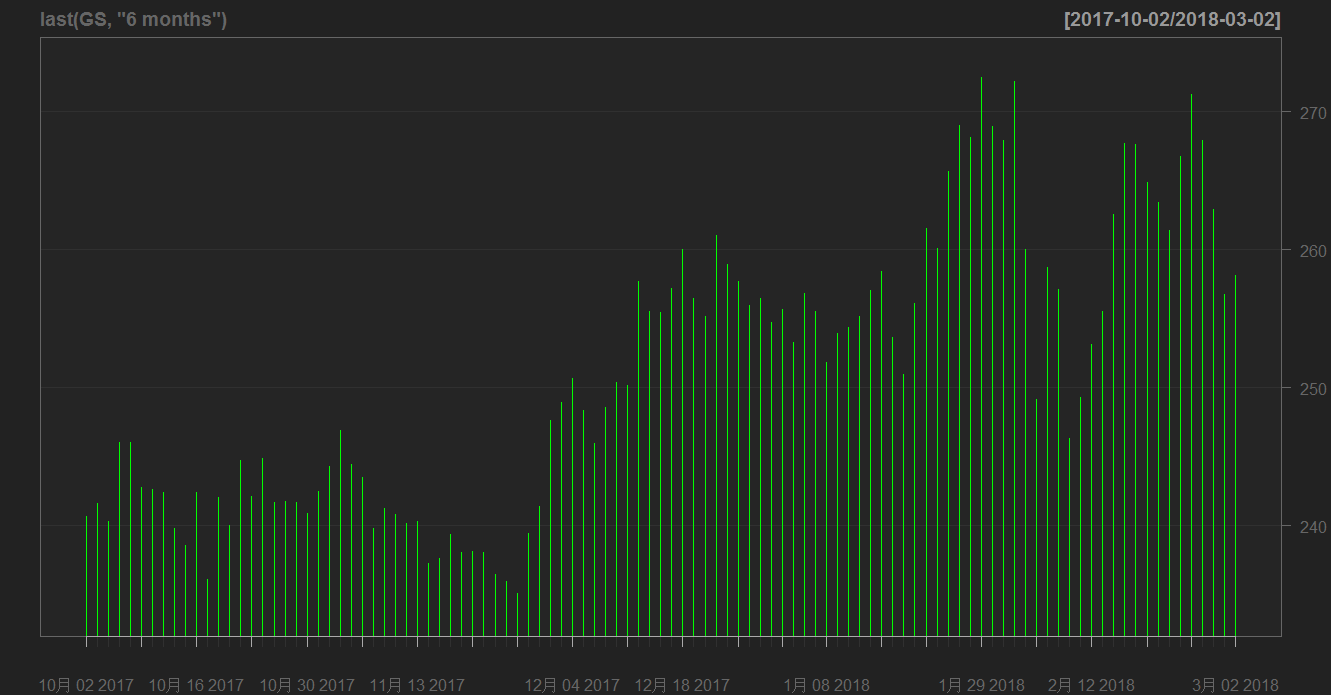
可以看到,各种各样的选项可供选择,真的好灵活。
形式参数:颜色,裁剪,刻度。
通过调整参数,看看结果的不同。
chartSeries(GS) #全部数据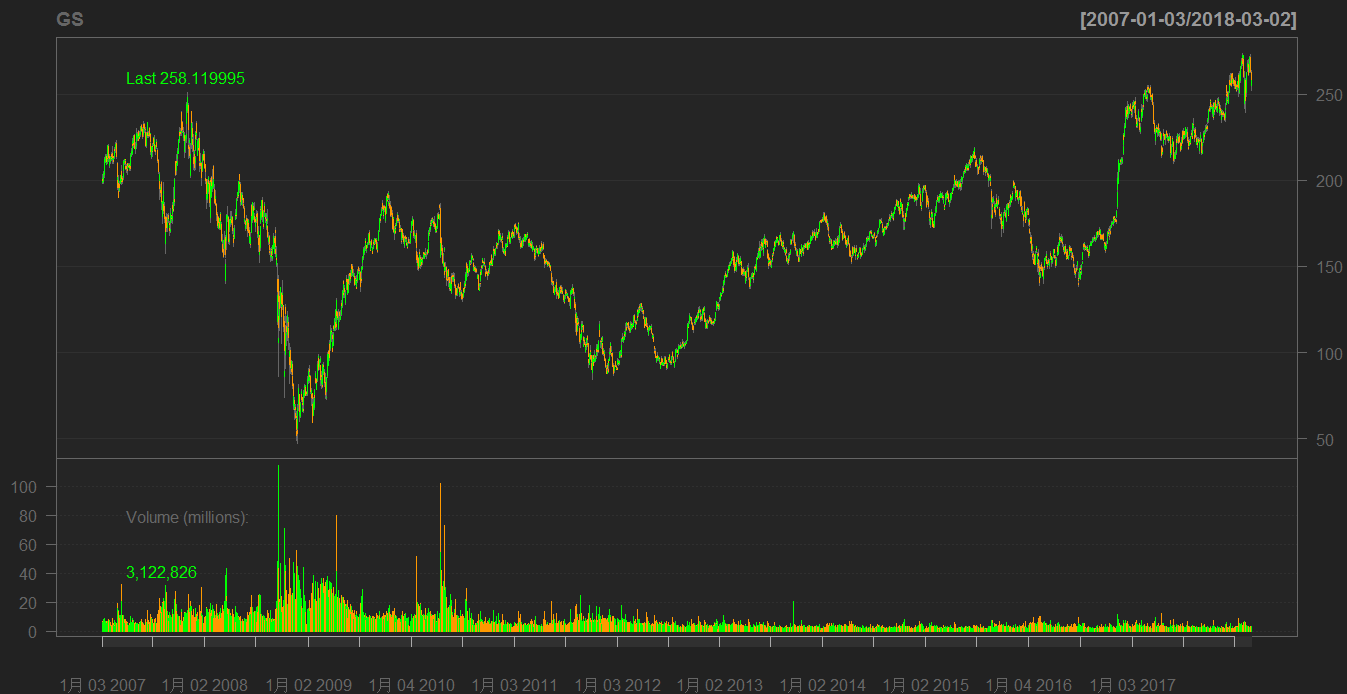
改下数据子集。
candleChart(GS,subset='2007-12::2008') #07年十二月至08年最后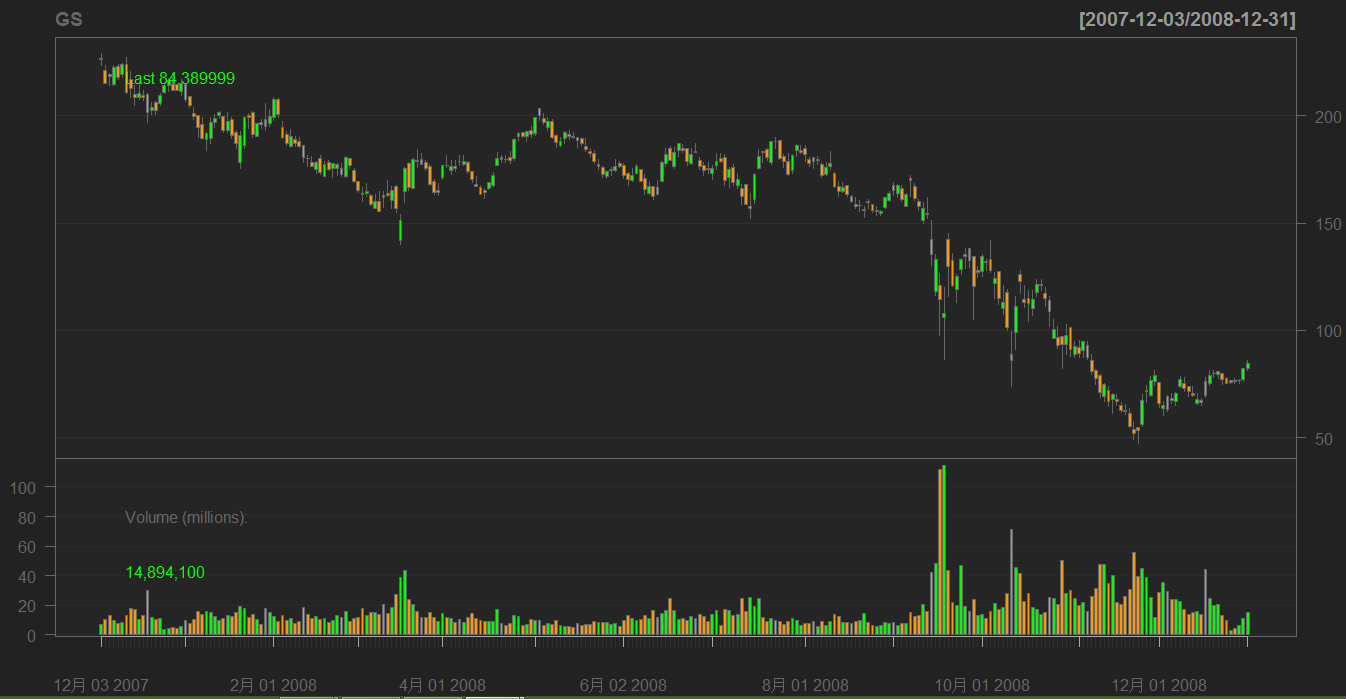
小改变:
candleChart(GS,theme='white', type='candles')
reChart(major.ticks='months',subset='first 16 weeks') # reChart 用于修改前面的图表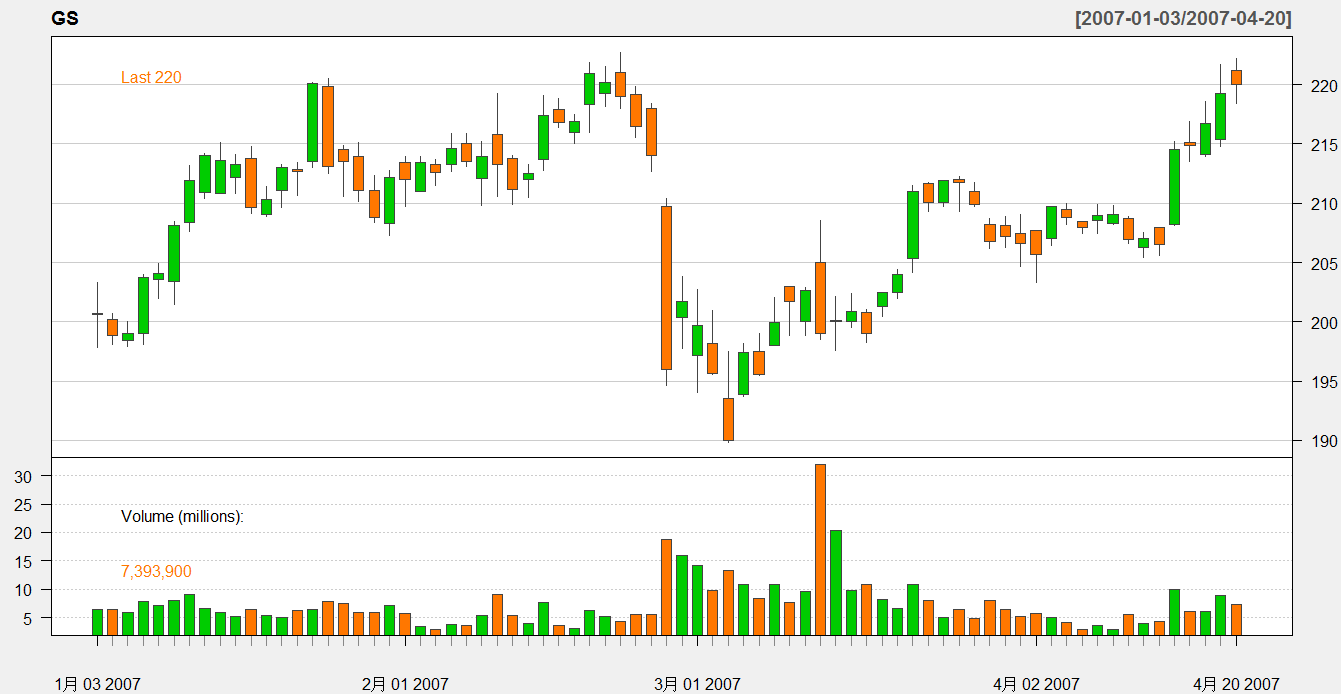
技术分析
目前TTR包和quantmod包提供的一些指示器(指标):
| 指标 | TTR 名称 | quantmod 名称 |
|---|---|---|
| Welles Wilder's Directional Movement Indicator | ADX | addADX |
| Average True Range | ATR | addATR |
| Bollinger Bands | BBands | addBBands |
| Bollinger Band Width | N/A | addBBands |
| Bollinger %b | N/A | addBBands |
| Commodity Channel Index | CCI | addCCI |
| Chaiken Money Flow | CMF | addCMF |
| Chande Momentum Oscillator | CMO | addCMO |
| Double Exponential Moving Average | DEMA | addDEMA |
| Detrended Price Oscillator | DPO | addDPO |
| Exponential Moving Average | EMA | addEMA |
| Price Envelope | N/A | addEnvelope |
| Exponential Volume Weigthed Moving Average | EVWMA | addEVWMA |
| Options and Futures Expiration | N/A | addExpiry |
| Moving Average Convergence Divergence | MACD | addMACD |
| Momentum | momentum | addMomentum |
| Rate of Change | ROC | addROC |
| Relative Strength Indicator | RSI | addRSI |
| Parabolic Stop and Reverse | SAR | addSAR |
| Simple Moving Average | SMA | addSMA |
| Stocastic Momentum Index | SMI | addSMI |
| Triple Smoothed Exponential Oscillator | TRIX | addTRIX |
| Volume | N/A | addVo |
| Weighted Moving Average | WMA | addWMA |
| Williams %R | WPR | addWPR |
| ZLEMA | ZLEMA | addZLEMA |
试一试。
TA=NULL表示什么指标都不画。last(GS, '6 months'),是为了使数据量小一点,要不糊成一片,看不出效果。
chartSeries(last(GS, '6 months'), TA=NULL) 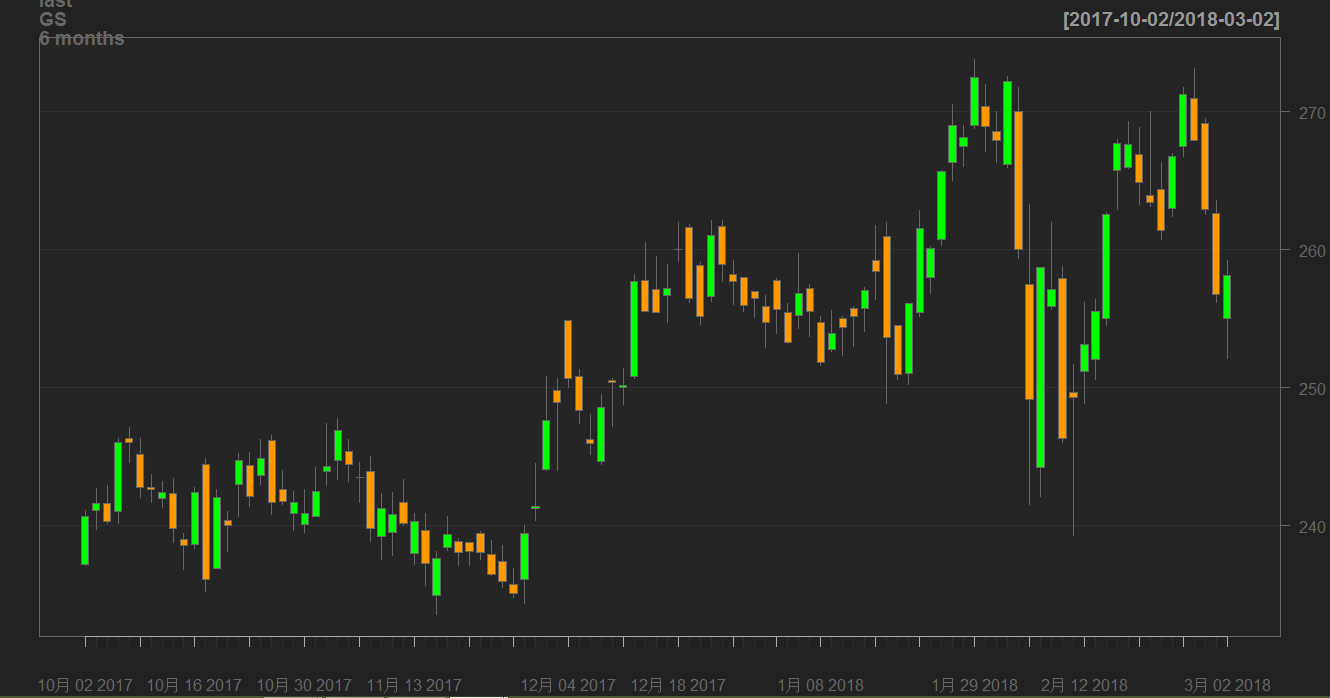
下面我们增加指标。
chartSeries(last(GS, '6 months'), theme="white", TA="addVo();addBBands();addCCI()")
这次画出非常惊艳的图:
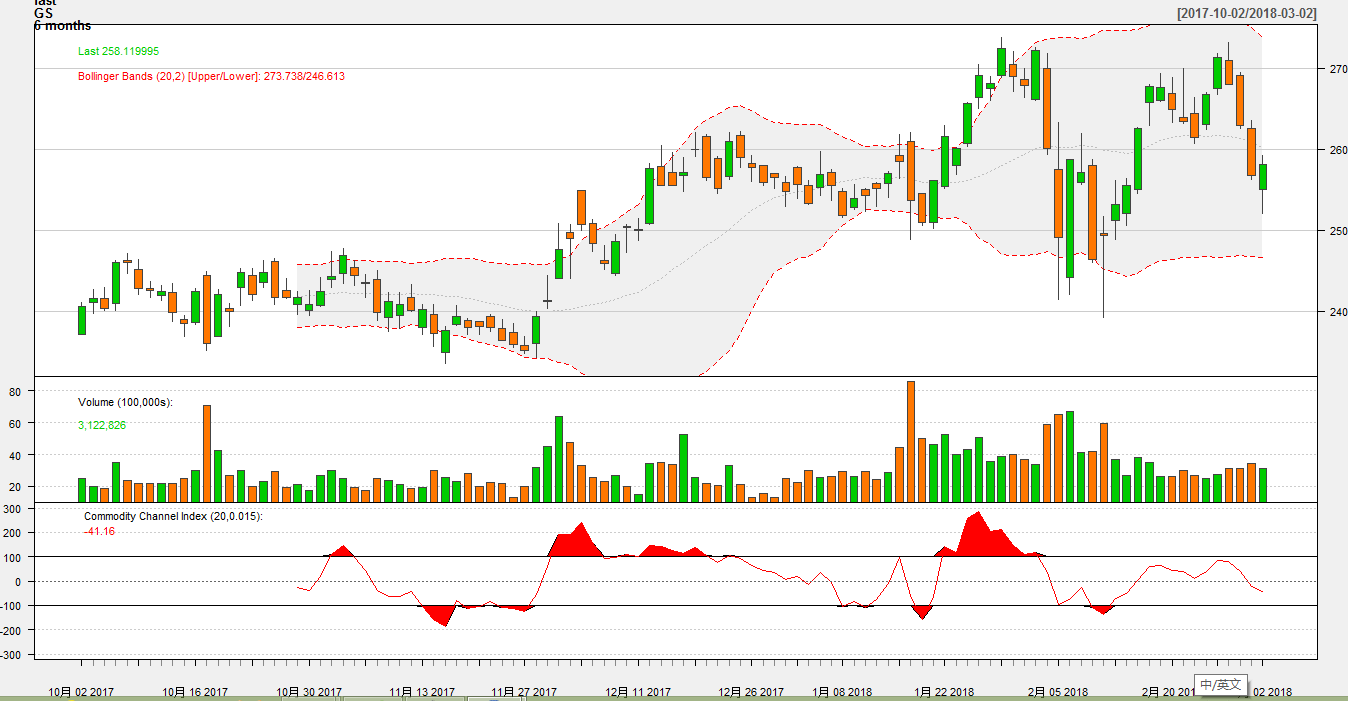
一行一行来,也可以得到上面的效果:
chartSeries(last(GS, '6 months'), theme="white") #draw the chart
addVo() #add volume
addBBands() #add Bollinger Bands
addCCI() #add Commodity Channel Index
quantmod两个最新功能
addTA
newTA
chartSeries(last(GS, '6 months'), TA=NULL)

#Then add the Open to Close price change
#using the quantmod OpCl function

addTA(OpCl(last(GS, '6 months')),col='blue', type='h')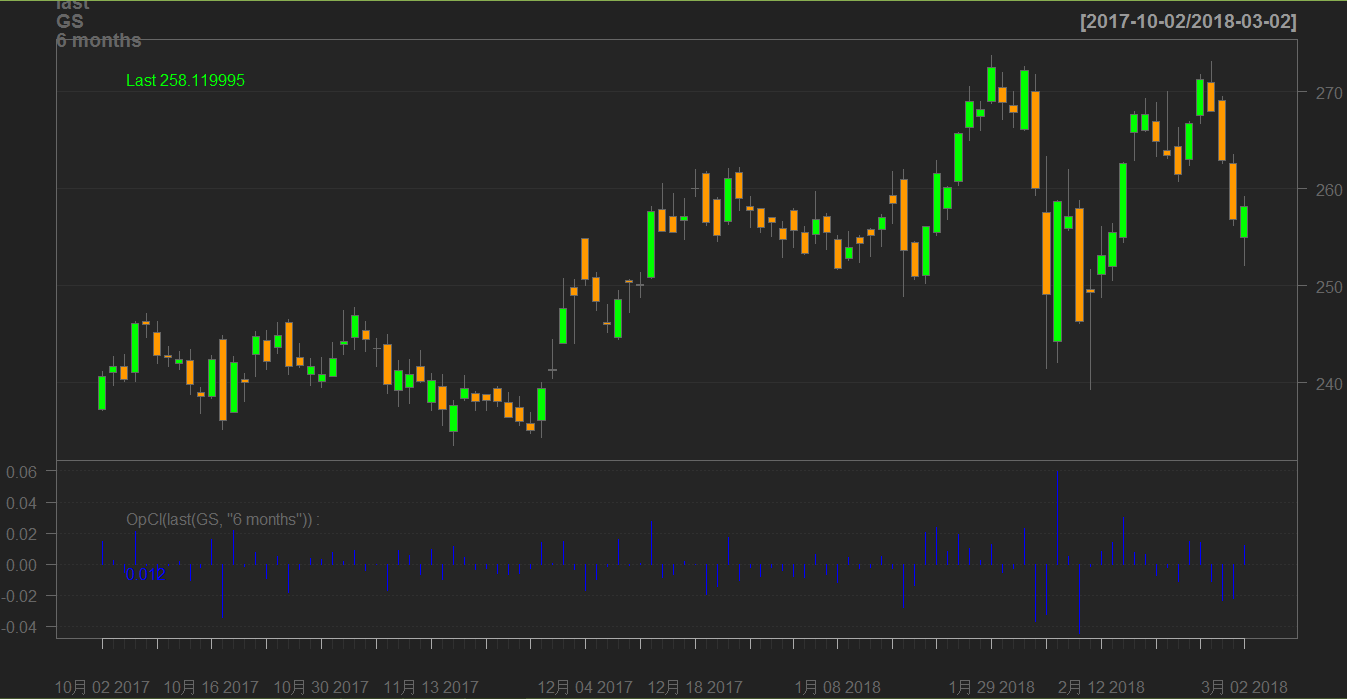
# Using newTA it is possible to create your own
# generic TA function --- let's call it addOpCl
#
addOpCl <- newTA(OpCl,col='green',type='h')

addOpCl() 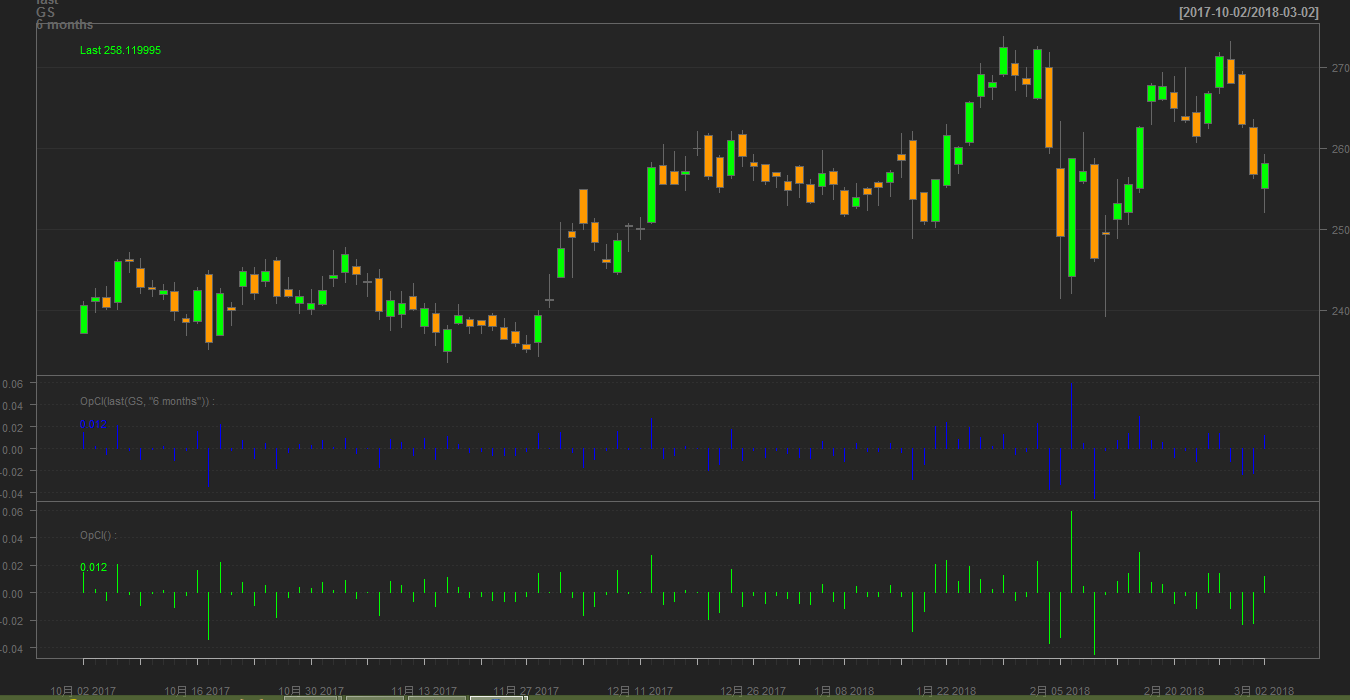
关于chartSeries 和 quantmod 的当前以及未来的可视化工具,可说的内容太多了。今天到此结束。


 1394
1394

 被折叠的 条评论
为什么被折叠?
被折叠的 条评论
为什么被折叠?
 到【灌水乐园】发言


