S变换在特征提取中的使用

S变换

      S变换采用高斯窗函数且窗宽与频率的倒数成正比,免去了窗函数的选择和改善了窗宽固定的缺陷,并且时频表示中各频率分量的相位谱与原始信号保持直接的联系,S变换具有良好的时频特性,适合用S变换对信号的一些时频与特征进行提取。

这里写图片描述

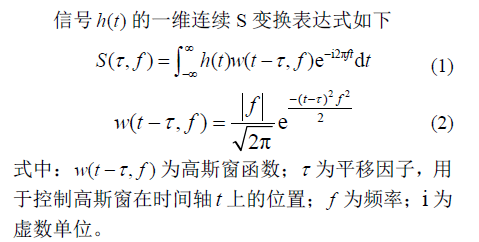
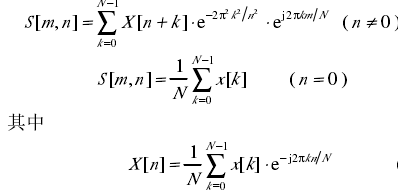
      可以看出S变换不同于短时傅里叶变换之处在于高斯窗的高度和宽度随频率变化,这样就克服了短时傅里叶变化窗口高度和宽度固定的缺陷。S变化的离散变现形式:

这里写图片描述

S变换的结果

      S变换的结果是一个二维矩阵,列对应采样点时间,行对应频率值,矩阵元素是一个复数,可以从这个元素里面获取幅值和相位信息。需要说明的是此时的频率值需要根据采样频率和采样数进行转化才能和实际的频率对应,转换方式与离散傅里叶转化方式相同,每个点的实际频率是(fs/N)*n,fs为采样频率,N为采样数,n为第n个点的序号。S变化的结果可以用三维立体图、二维等高线以及灰度图等直观表示,或者截取某一剖面用二维曲线表示。

S变化提取特征

      国内现阶段在电能质量监测和评价方面根据S变化判断电压突降、突升、谐波以及震荡等电能扰动类型。通过s变化对不同电压扰动进行时频域特征提取很流行,合理选择分类器进行训练分类,最后对电压扰动进行检测与判断。下面就以一组电力信号为例,进行S变换特征提取以及结果简要分析。

      给定一个电力信号序列,对该序列进行S变换分析,获取一个二维矩阵。首先用三维图画出各个分量,如下所示:

这里写图片描述

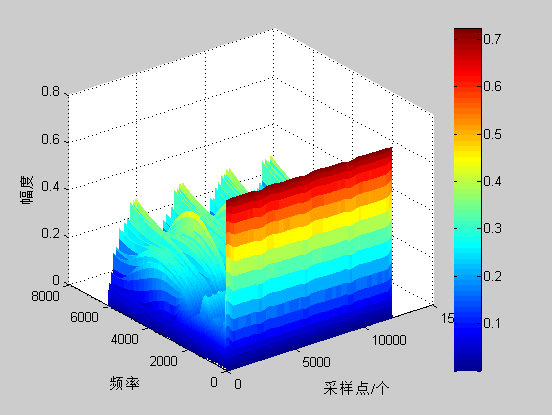
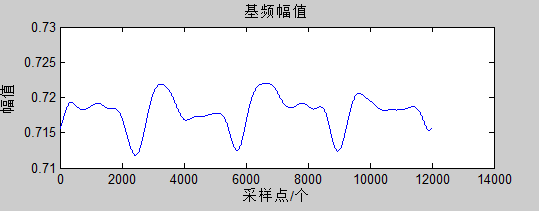
      由于电流序列的基频是60Hz,如果对该信号进行谐波分析,就需要对谐波含量进行提取,从上图可以看出信号中含有较大的直流成分。由于谐波中大多是奇次谐波,偶次谐波通常只会发生在电路谐振的条件下。下面就从二维矩阵中抽取一行采样点与幅值信息,给出频率为60Hz(基波)时的幅值曲线。

这里写图片描述

再根据二维矩阵获取该序列信号的频谱图:

这里写图片描述

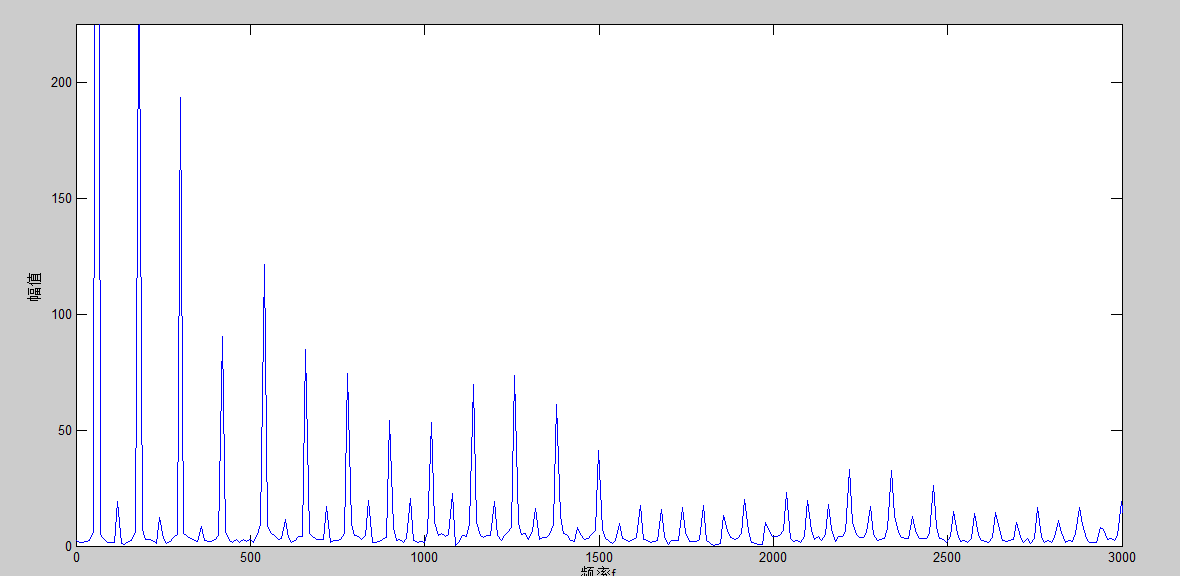
      通过以上图可以得知该信号中的谐波分量的大致分布。接下来可以根据实际情况选择S变化的形态域、频域、时频域特征作为样本特征,选择合适的分类器进行训练。

下面给出一段开源的S变换仿真代码:


function [st,t,f] = st(timeseries,minfreq,maxfreq,samplingrate,freqsamplingrate)
% Returns the Stockwell Transform of the timeseries.
% Code by Robert Glenn Stockwell.
% DO NOT DISTRIBUTE
% BETA TEST ONLY
% Reference is "Localization of the Complex Spectrum: The S Transform"
% from IEEE Transactions on Signal Processing, vol. 44., number 4, April 1996, pages 998-1001.
%
%-------Inputs Needed------------------------------------------------
%  
%   *****All frequencies in (cycles/(time unit))!******
%   "timeseries" - vector of data to be transformed
%-------Optional Inputs ------------------------------------------------
%
%"minfreq" is the minimum frequency in the ST result(Default=0)
%"maxfreq" is the maximum frequency in the ST result (Default=Nyquist)
%"samplingrate" is the time interval between samples (Default=1)
%"freqsamplingrate" is the frequency-sampling interval you desire in the ST result (Default=1)
%Passing a negative number will give the default ex.  [s,t,f] = st(data,-1,-1,2,2)
%-------Outputs Returned------------------------------------------------
%
% st     -a complex matrix containing the Stockwell transform. 
%            The rows of STOutput are the frequencies and the 
%         columns are the time values ie each column is 
%         the "local spectrum" for that point in time
%  t      - a vector containing the sampled times
%  f      - a vector containing the sampled frequencies
%--------Additional details-----------------------
%   %  There are several parameters immediately below that
%  the user may change. They are:
%[verbose]    if true prints out informational messages throughout the function.
%[removeedge] if true, removes a least squares fit parabola
%                and puts a 5% hanning taper on the edges of the time series.
%                This is usually a good idea.
%[analytic_signal]  if the timeseries is real-valued
%                      this takes the analytic signal and STs it.
%                      This is almost always a good idea.
%[factor]     the width factor of the localizing gaussian
%                ie, a sinusoid of period 10 seconds has a 
%                gaussian window of width factor*10 seconds.
%                I usually use factor=1, but sometimes factor = 3
%                to get better frequency resolution.
%   Copyright (c) by Bob Stockwell
%   $Revision: 1.2 $  $Date: 1997/07/08  $


% This is the S transform wrapper that holds default values for the function.
TRUE = 1;
FALSE = 0;
%%% DEFAULT PARAMETERS  [change these for your particular application]
verbose = TRUE;          
removeedge= FALSE;
analytic_signal =  FALSE;
factor = 1;
%%% END of DEFAULT PARAMETERS


%%%START OF INPUT VARIABLE CHECK
% First:  make sure it is a valid time_series 
%         If not, return the help message

if verbose disp(' '),end  % i like a line left blank

if nargin == 0 
   if verbose disp('No parameters inputted.'),end
   st_help
   t=0;,st=-1;,f=0;
   return
end

% Change to column vector
if size(timeseries,2) > size(timeseries,1)
    timeseries=timeseries'; 
end

% Make sure it is a 1-dimensional array
if size(timeseries,2) > 1
   error('Please enter a *vector* of data, not matrix')
    return
elseif (size(timeseries)==[1 1]) == 1
    error('Please enter a *vector* of data, not a scalar')
    return
end

% use defaults for input variables

if nargin == 1
   minfreq = 0;
   maxfreq = fix(length(timeseries)/2);
   samplingrate=1;
    freqsamplingrate=1;
elseif nargin==2
   maxfreq = fix(length(timeseries)/2);
   samplingrate=1;
   freqsamplingrate=1;
   [ minfreq,maxfreq,samplingrate,freqsamplingrate] =  check_input(minfreq,maxfreq,samplingrate,freqsamplingrate,verbose,timeseries);
elseif nargin==3 
   samplingrate=1;
   freqsamplingrate=1;
   [ minfreq,maxfreq,samplingrate,freqsamplingrate] =  check_input(minfreq,maxfreq,samplingrate,freqsamplingrate,verbose,timeseries);
elseif nargin==4   
   freqsamplingrate=1;
   [ minfreq,maxfreq,samplingrate,freqsamplingrate] =  check_input(minfreq,maxfreq,samplingrate,freqsamplingrate,verbose,timeseries);
elseif nargin == 5
      [ minfreq,maxfreq,samplingrate,freqsamplingrate] =  check_input(minfreq,maxfreq,samplingrate,freqsamplingrate,verbose,timeseries);
else      
   if verbose disp('Error in input arguments: using defaults'),end
   minfreq = 0;
   maxfreq = fix(length(timeseries)/2);
   samplingrate=1;
   freqsamplingrate=1;
end
if verbose 
   disp(sprintf('Minfreq = %d',minfreq))
   disp(sprintf('Maxfreq = %d',maxfreq))
   disp(sprintf('Sampling Rate (time   domain) = %d',samplingrate))
   disp(sprintf('Sampling Rate (freq.  domain) = %d',freqsamplingrate))
   disp(sprintf('The length of the timeseries is %d points',length(timeseries)))

   disp(' ')
end
%END OF INPUT VARIABLE CHECK

% If you want to "hardwire" minfreq & maxfreq & samplingrate & freqsamplingrate do it here

% calculate the sampled time and frequency values from the two sampling rates
t = (0:length(timeseries)-1)*samplingrate;
spe_nelements =ceil((maxfreq - minfreq+1)/freqsamplingrate)   ;
f = (minfreq + [0:spe_nelements-1]*freqsamplingrate)/(samplingrate*length(timeseries));
if verbose disp(sprintf('The number of frequency voices is %d',spe_nelements)),end


% The actual S Transform function is here:
st = strans(timeseries,minfreq,maxfreq,samplingrate,freqsamplingrate,verbose,removeedge,analytic_signal,factor); 
% this function is below, thus nicely encapsulated

%WRITE switch statement on nargout
% if 0 then plot amplitude spectrum
if nargout==0 
   if verbose disp('Plotting pseudocolor image'),end
   pcolor(t,f,abs(st))
end


return
function st = strans(timeseries,minfreq,maxfreq,samplingrate,freqsamplingrate,verbose,removeedge,analytic_signal,factor); 
% Returns the Stockwell Transform, STOutput, of the time-series
% Code by R.G. Stockwell.
% Reference is "Localization of the Complex Spectrum: The S Transform"
% from IEEE Transactions on Signal Processing, vol. 44., number 4,
% April 1996, pages 998-1001.
%
%-------Inputs Returned------------------------------------------------
%         - are all taken care of in the wrapper function above
%
%-------Outputs Returned------------------------------------------------
%
%   ST    -a complex matrix containing the Stockwell transform.
%            The rows of STOutput are the frequencies and the
%            columns are the time values
%
%
%-----------------------------------------------------------------------

% Compute the length of the data.
n=length(timeseries);
original = timeseries;
if removeedge
    if verbose disp('Removing trend with polynomial fit'),end
     ind = [0:n-1]';
    r = polyfit(ind,timeseries,2);
    fit = polyval(r,ind) ;
     timeseries = timeseries - fit;
    if verbose disp('Removing edges with 5% hanning taper'),end
    sh_len = floor(length(timeseries)/10);
    wn = hanning(sh_len);
    if(sh_len==0)
       sh_len=length(timeseries);
       wn = 1&[1:sh_len];
    end
    % make sure wn is a column vector, because timeseries is
   if size(wn,2) > size(wn,1)
      wn=wn';   
   end

   timeseries(1:floor(sh_len/2),1) = timeseries(1:floor(sh_len/2),1).*wn(1:floor(sh_len/2),1);
    timeseries(length(timeseries)-floor(sh_len/2):n,1) = timeseries(length(timeseries)-floor(sh_len/2):n,1).*wn(sh_len-floor(sh_len/2):sh_len,1);

end

% If vector is real, do the analytic signal 

if analytic_signal
   if verbose disp('Calculating analytic signal (using Hilbert transform)'),end
   % this version of the hilbert transform is different than hilbert.m
   %  This is correct!
   ts_spe = fft(real(timeseries));
   h = [1; 2*ones(fix((n-1)/2),1); ones(1-rem(n,2),1); zeros(fix((n-1)/2),1)];
   ts_spe(:) = ts_spe.*h(:);
   timeseries = ifft(ts_spe);
end  

% Compute FFT's
tic;vector_fft=fft(timeseries);tim_est=toc;
vector_fft=[vector_fft,vector_fft];
tim_est = tim_est*ceil((maxfreq - minfreq+1)/freqsamplingrate)   ;
if verbose disp(sprintf('Estimated time is %f',tim_est)),end

% Preallocate the STOutput matrix
st=zeros(ceil((maxfreq - minfreq+1)/freqsamplingrate),n);
% Compute the mean
% Compute S-transform value for 1 ... ceil(n/2+1)-1 frequency points
if verbose disp('Calculating S transform...'),end
if minfreq == 0
   st(1,:) = mean(timeseries)*(1&[1:1:n]);
else
    st(1,:)=ifft(vector_fft(minfreq+1:minfreq+n).*g_window(n,minfreq,factor));
end

%the actual calculation of the ST
% Start loop to increment the frequency point
for banana=freqsamplingrate:freqsamplingrate:(maxfreq-minfreq)
   st(banana/freqsamplingrate+1,:)=ifft(vector_fft(minfreq+banana+1:minfreq+banana+n).*g_window(n,minfreq+banana,factor));
end   % a fruit loop!   aaaaa ha ha ha ha ha ha ha ha ha ha
% End loop to increment the frequency point
if verbose disp('Finished Calculation'),end

%%% end strans function

%------------------------------------------------------------------------
function gauss=g_window(length,freq,factor)

% Function to compute the Gaussion window for 
% function Stransform. g_window is used by function
% Stransform. Programmed by Eric Tittley
%
%-----Inputs Needed--------------------------
%
%   length-the length of the Gaussian window
%
%   freq-the frequency at which to evaluate
%         the window.
%   factor- the window-width factor
%
%-----Outputs Returned--------------------------
%
%   gauss-The Gaussian window
%

vector(1,:)=[0:length-1];
vector(2,:)=[-length:-1];
vector=vector.^2;    
vector=vector*(-factor*2*pi^2/freq^2);
% Compute the Gaussion window
gauss=sum(exp(vector));

%-----------------------------------------------------------------------

%^^^^^^^^^^^^^^^^^^^^^^^^^^^^^^^^^^^^^^^^^^^^^^^^^^^^^^^^^^^^^^^^^^^^^^^^^^%
function [ minfreq,maxfreq,samplingrate,freqsamplingrate] =  check_input(minfreq,maxfreq,samplingrate,freqsamplingrate,verbose,timeseries)
% this checks numbers, and replaces them with defaults if invalid

% if the parameters are passed as an array, put them into the appropriate variables
s = size(minfreq);
l = max(s);
if l > 1  
   if verbose disp('Array of inputs accepted.'),end
   temp=minfreq;
   minfreq = temp(1);;
   if l > 1  maxfreq = temp(2);,end;
   if l > 2  samplingrate = temp(3);,end;
   if l > 3  freqsamplingrate = temp(4);,end;
   if l > 4  
      if verbose disp('Ignoring extra input parameters.'),end
   end;

end      

   if minfreq < 0 | minfreq > fix(length(timeseries)/2);
      minfreq = 0;
      if verbose disp('Minfreq < 0 or > Nyquist. Setting minfreq = 0.'),end
   end
   if maxfreq > length(timeseries)/2  | maxfreq < 0 
      maxfreq = fix(length(timeseries)/2);
      if verbose disp(sprintf('Maxfreq < 0 or > Nyquist. Setting maxfreq = %d',maxfreq)),end
   end
      if minfreq > maxfreq 
      temporary = minfreq;
      minfreq = maxfreq;
      maxfreq = temporary;
      clear temporary;
      if verbose disp('Swapping maxfreq <=> minfreq.'),end
   end
   if samplingrate <0
      samplingrate = abs(samplingrate);
      if verbose disp('Samplingrate <0. Setting samplingrate to its absolute value.'),end
   end
   if freqsamplingrate < 0   % check 'what if freqsamplingrate > maxfreq - minfreq' case
      freqsamplingrate = abs(freqsamplingrate);
      if verbose disp('Frequency Samplingrate negative, taking absolute value'),end
   end

% bloody odd how you don't end a function

%^^^^^^^^^^^^^^^^^^^^^^^^^^^^^^^^^^^^^^^^^^^^^^^^^^^^^^^^^^^^^^^^^^^^^^^^^^%
function st_help
   disp(' ')
    disp('st()  HELP COMMAND')
    disp('st() returns  - 1 or an error message if it fails')
    disp('USAGE::    [localspectra,timevector,freqvector] = st(timeseries)')
    disp('NOTE::   The function st() sets default parameters then calls the function strans()')
   disp(' ')  
   disp('You can call strans() directly and pass the following parameters')
   disp(' **** Warning!  These inputs are not checked if strans() is called directly!! ****')
    disp('USAGE::  localspectra = strans(timeseries,minfreq,maxfreq,samplingrate,freqsamplingrate,verbose,removeedge,analytic_signal,factor) ')

   disp(' ')
   disp('Default parameters (available in st.m)')
    disp('VERBOSE          - prints out informational messages throughout the function.')
    disp('REMOVEEDGE       - removes the edge with a 5% taper, and takes')
   disp('FACTOR           -  the width factor of the localizing gaussian')
   disp('                    ie, a sinusoid of period 10 seconds has a ')
   disp('                    gaussian window of width factor*10 seconds.')
   disp('                    I usually use factor=1, but sometimes factor = 3')
   disp('                    to get better frequency resolution.')
   disp(' ')
   disp('Default input variables')
   disp('MINFREQ           - the lowest frequency in the ST result(Default=0)')
   disp('MAXFREQ           - the highest frequency in the ST result (Default=nyquist')
   disp('SAMPLINGRATE      - the time interval between successive data points (Default = 1)')
   disp('FREQSAMPLINGRATE  - the number of frequencies between samples in the ST results')

% end of st_help procedure   
  • 40
    点赞
  • 168
    收藏
    觉得还不错? 一键收藏
  • 25
    评论
评论 25
添加红包

请填写红包祝福语或标题

红包个数最小为10个

红包金额最低5元

当前余额3.43前往充值 >
需支付:10.00
成就一亿技术人!
领取后你会自动成为博主和红包主的粉丝 规则
hope_wisdom
发出的红包
实付
使用余额支付
点击重新获取
扫码支付
钱包余额 0

抵扣说明:

1.余额是钱包充值的虚拟货币,按照1:1的比例进行支付金额的抵扣。
2.余额无法直接购买下载,可以购买VIP、付费专栏及课程。

余额充值