import numpy as np
a = np.array([1,2,3],dtype=np.complex)print(a)
[1.+0.j 2.+0.j 3.+0.j]


C:\Users\vers\AppData\Local\Temp\ipykernel_2852\1820813101.py:2: DeprecationWarning: `np.complex` is a deprecated alias for the builtin `complex`. To silence this warning, use `complex` by itself. Doing this will not modify any behavior and is safe. If you specifically wanted the numpy scalar type, use `np.complex128` here.
Deprecated in NumPy 1.20; for more details and guidance: https://numpy.org/devdocs/release/1.20.0-notes.html#deprecations
  a = np.array([1,2,3],dtype=np.complex)
import numpy as np
x=np.float32(5)print('x为;',x)print('x为对象的data属性:',x.data)print('x为对象的size属性:',x.size)print('x为对象的维数:',x.ndim)
y=np.bool_(x)print('转换为bool类型的x为:',y)
z=np.float16(y)print('True值转换为float16类型为:',z)
import pandas as pd
s=pd.Series([1,3,5,9,6,8])print(s)
0    1
1    3
2    5
3    9
4    6
5    8
dtype: int64
import pandas as pd
print('--------列表创建series---------')
s1=pd.Series([1,1,1,1,1])print(s1)print('--------字典创建series---------')
s2=pd.Series({'Longitude':39,'Latitude':116,'Temperature':23})print('First value in s2:',s2['Longitude'])print('--------用序列作series索引-----')
s3=pd.Series([3.4,0.8,2.1,0.3,1.5],range(5,10))print('First value in s3:',s3[5])
--------列表创建series---------
0    1
1    1
2    1
3    1
4    1
dtype: int64
--------字典创建series---------
First value in s2: 39
--------用序列作series索引-----
First value in s3: 3.4
s2["city"]="beijing"
s2['Temperature']+=2
s2
Longitude           39
Latitude           116
Temperature         25
city           beijing
dtype: object
------------原Series:-------------
 Longitude           39
Latitude           116
Temperature         25
city           beijing
dtype: object
------------新Series:-------------
 Longitude           39
Latitude           116
Temperature         25
city           beijing
humidity            84
dtype: object


C:\Users\vers\AppData\Local\Temp\ipykernel_2852\741578432.py:2: FutureWarning: The series.append method is deprecated and will be removed from pandas in a future version. Use pandas.concat instead.
  s4=s2.append(stiny)
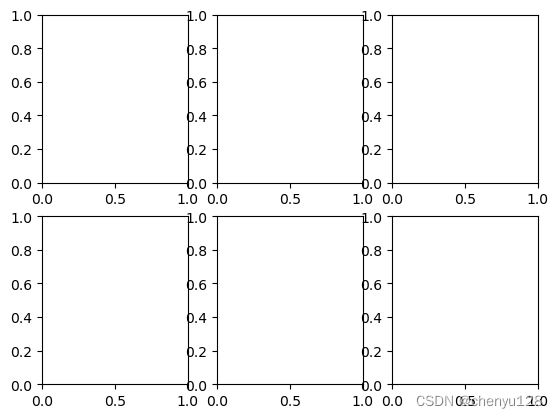
import matplotlib.pyplot as plt
fig=plt.figure()
ax1=fig.add_subplot(2,2,1)
ax2=fig.add_subplot(2,2,4)


 784
784


 被折叠的 条评论
为什么被折叠?
被折叠的 条评论
为什么被折叠?
 到【灌水乐园】发言


