


该书代码及数据http://www.manning-source.com/books/pharrington/MLiA_SourceCode.zip
样本数据:
一个样本代表一约会对象,样本分类为用户A对该对象的喜欢程度,1、2、3分别代表'not at all','in small doses','in large doses'
| 每年获得的飞行常客里程数 | 玩视频游戏所耗时间百分比 | 每周消费冰淇淋公升数 | 样本分类 | |
| 1 | 40920 | 8.326976 | 0.953952 | 3 |
| 2 | 26052 | 1.441871 | 0.805124 | 1 |
问题描述:
用户A输入待约会的对象的特征,KNN分类器对其做出分类,预测A对该对象的喜欢程度
数据展示:


输入样例:
代码(knn.py):
# -*- coding:utf-8 -*-
from numpy import *
import operator
import sys
import matplotlib
import matplotlib.pyplot as plt
from numpy import array
def file2matrix(filename):
fr=open(filename)
arrayOfLines=fr.readlines()
numberOfLines=len(arrayOfLines)
returnMat=zeros((numberOfLines,3))
classLabelVector=[]
index=0
for line in arrayOfLines:
line=line.strip()
listFromLine=line.split('\t')
returnMat[index,:]=listFromLine[0:3]
#can't plot if do not convert to 'int'
classLabelVector.append(int(listFromLine[-1]))
index+=1
return returnMat,classLabelVector
def plotpic(dataset,labels):
zwfont=matplotlib.font_manager.FontProperties(fname='/usr/share/fonts/truetype/arphic/ukai.ttc')
fig=plt.figure()
ax=fig.add_subplot(111)
#更改前两个参数绘制不同图像,dataset[:,1/2/3]
ax.scatter(dataset[:,1],dataset[:,2],15.0*array(labels),15.0*array(labels))
# plt.xlabel(u'每年获得的飞行常客里程数',fontproperties=zwfont)
# plt.xlabel(u'玩视频游戏所耗时间百分比',fontproperties=zwfont)
# plt.ylabel(u'每周消费的冰淇淋公升数',fontproperties=zwfont)
plt.show()
#由于各个特征数值范围差距较大,在计算距离时会产生较大偏差,因此需要归一化特征值
def autoNorm(dataset):
minVals=dataset.min(0) #获取每列最小值
maxVals=dataset.max(0)
ranges=maxVals-minVals
normDataSet=zeros(shape(dataset))
m=dataset.shape[0]
normDataSet=dataset-tile(minVals,(m,1))
normDataSet=normDataSet/tile(ranges,(m,1))
return normDataSet,ranges,minVals
#分类函数
def classify(inX,dataSet,labels,k):
dataSetSize=dataSet.shape[0]
diffMat=tile(inX,(dataSetSize,1))-dataSet
sqDiffMat=diffMat**2
sqDistances=sqDiffMat.sum(axis=1)
distances=sqDistances**0.5
sortedDistIndices=distances.argsort()
classCount={}
for i in range(k):
voteIlabel=labels[sortedDistIndices[i]]
classCount[voteIlabel]=classCount.get(voteIlabel,0)+1
sortedClassCount=sorted(classCount.iteritems(),key=operator.itemgetter(1),reverse=True)
return sortedClassCount[0][0]
#打印分类过程及错误率
def datingClassTest():
k=4
hoRatio=0.10 #将数据集的10%用作测试
datingDataMat,datingLabels=file2matrix('datingTestSet.txt')
normMat,ranges,minVals=autoNorm(datingDataMat)
m=normMat.shape[0]
numTestVecs=int(m*hoRatio)
errorCount=0.0
for i in range(numTestVecs):
classifierResult=classify(normMat[i,:],normMat[numTestVecs:m,:],datingLabels[numTestVecs:m],k)
print "the result is : %d, the real answer is : %d"%(classifierResult,datingLabels[i])
if (classifierResult != datingLabels[i]):
errorCount+=1.0
print "the total error rate is : %f"%(errorCount/float(numTestVecs))
#与用户交互
def classifyPerson():
k=4
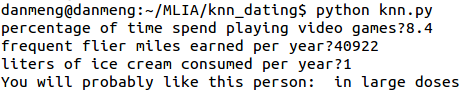
resultList=['not at all','in small doses','in large doses']
percentTats=float(raw_input("percentage of time spend playing video games?"))
ffMiles=float(raw_input("frequent flier miles earned per year?"))
iceCream=float(raw_input("liters of ice cream consumed per year?"))
datingDataMat,datingLabels=file2matrix('datingTestSet.txt')
normMat,ranges,minVals=autoNorm(datingDataMat)
inArr=array([ffMiles,percentTats,iceCream])
classifierResult=classify((inArr-minVals)/ranges,normMat,datingLabels,k)
print "You will probably like this person: ",resultList[classifierResult-1]
if __name__=='__main__':
#画图
# dataset,labels=file2matrix('datingTestSet.txt')
# plotpic(dataset,labels)
#测试
# datingClassTest()
classifyPerson()


 1192
1192


 被折叠的 条评论
为什么被折叠?
被折叠的 条评论
为什么被折叠?
 到【灌水乐园】发言


