


简介
HTML5 <canvas> 是绘制 图形/图像 的容器。它本身并没有绘制能力,您必须使用脚本来完成实际的绘图任务(通常是 JavaScript)。
如果浏览器不支持<canvas>的话,会显示<canvas>标签内定义的元素。例如,下面代码在不支持的<canvas>浏览器下就会忽略<canvas>标签,显示<p>标签。
<canvas id="canvas" width="500" height="300" style="border:1px solid #aaa">
    <p>Your browser does not support the canvas element!</p>
</canvas>
JavaScript 绘图准备
获取html中的 <canvas>元素
var canvas = document.getElementById("canvas");创建绘图对象上下文
getContext(contextID) 方法可返回一个对象,该对象提供了用于在画布上绘图的方法和属性。该方法需要一个参数,一般是2d,即getContext(‘2d’)。这是为了将来扩展到3d画布保留的一个参数。
var ctx = canvas.getContext('2d');这样就可以在画布上下文中绘制图案了。
JavaScript 绘制基本图形
颜色
- fillStyle
设置或返回用于填充绘画的颜色、渐变或模式。 - strokeStyle
设置或返回用于笔触的颜色、渐变或模式。
<html>
    <body>
        <canvas id="canvas" width="250" height="100" style="border:1px solid #aaa">
            <p>Your browser does not support the canvas element!</p>
        </canvas>
        <script type="text/javascript">
            var canvas = document.getElementById('canvas');
            var ctx = canvas.getContext('2d');
            ctx.fillStyle='#f00';
            ctx.fillRect(10,10,100,50);
            ctx.strokeStyle="#0f0"
            ctx.strokeRect(130,10,100,50);
        </script>
    </body>
</html>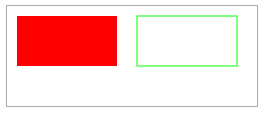
渐变
- gradient.addColorStop(stop,color)
规定 gradient 对象中的颜色和位置。
- stop 介于 0.0 与 1.0 之间的值,表示渐变中开始与结束之间的位置。
- color 在结束位置显示的 CSS 颜色值。
- createLinearGradient(x0, y0, x1, y1)
创建线性渐变。渐变可用于填充矩形、圆形、线条、文本等等。
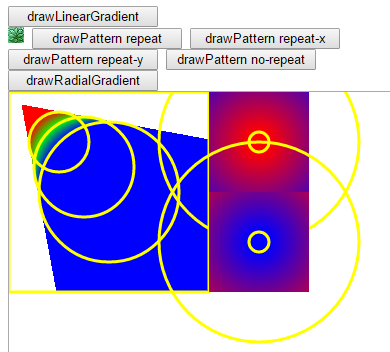
小于 (x0, y0) 与 (x1, y1) 连线在 (x0, y0) 点的垂线的区域填充stop=0 的纯色。大于 (x0, y0) 与 (x1, y1) 连线在 (x1, y1) 点的垂线的区域填充stop=1 的纯色。 - createRadialGradient(x0, y0, r0, x1, y1, r1)
创建放射状/环形的渐变。渐变可用于填充矩形、圆形、线条、文本等等。
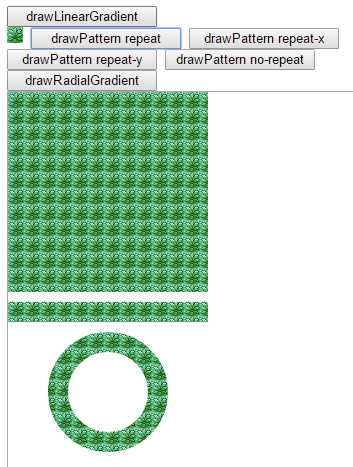
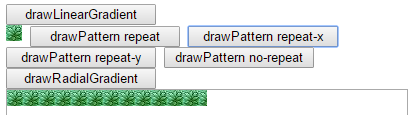
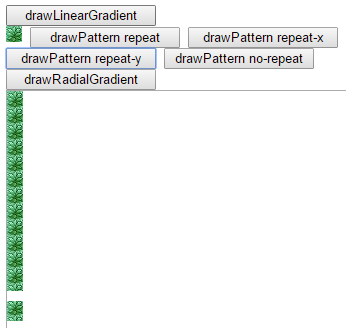
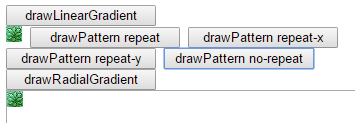
半径大的一定在下层,半径小的一定在上层,和顺序无关。渐变区域为两圆相连的中间区域。由于指定的是绝对坐标,因此一定要保证最大的那个渐变半径大于绘制区域,否则大半径范围之外的绘制区域不会产生任何效果。 - createPattern(img, direction)
在指定的方向上重复指定的元素。被重复的元素可用于绘制/填充矩形、圆形或线条等等。
pattern按图片的大小从(0, 0)点开始绘制,因此如果direction != repeat,一定要确保它绘制在显示范围中
- img
规定要使用的图片、画布或视频元素。 - direction
- repeat
默认。该模式在水平和垂直方向重复。 - repeat-x
该模式只在水平方向重复。 - repeat-y
该模式只在垂直方向重复。 - no-repeat
该模式只显示一次(不重复)。
- repeat
- img
<html>
    <head>
        <style type="text/css">
            button {
                width:150px;
            }
        </style>
        <script type="text/javascript">
            function drawLinearGradient() {
                var c = document.getElementById("canvas");
                var ctx = c.getContext("2d");
                var linearGradient = ctx.createLinearGradient(0, 0, 100, 100);
                linearGradient.addColorStop(0, "red");
                linearGradient.addColorStop(.5, "rgb(0,255,0)");
                linearGradient.addColorStop(1, "#00f");
                ctx.clearRect(0, 0, c.width, c.height);
                ctx.fillStyle = linearGradient;
                ctx.fillRect(0,0,50,50);
                ctx.fillRect(50,0,100,100);
                ctx.fillRect(150,0,200,200);
            }
            function drawPattern(direction) {
                var c = document.getElementById("canvas");
                var ctx = c.getContext("2d");
                var img = document.getElementById("grass");
                var pattern = ctx.createPattern(img, direction);
                ctx.clearRect(0, 0, c.width, c.height);
                ctx.fillStyle = pattern;
                ctx.fillRect(0, 0, 200, 200);

                ctx.strokeStyle = pattern;
                ctx.lineWidth = 20;
                ctx.beginPath();
                ctx.moveTo(0,220);
                ctx.lineTo(200,220);
                ctx.stroke();

                ctx.beginPath();
                ctx.arc(100,300,50,0,2*Math.PI);
                ctx.stroke();
            }
            //渐变半径大的在下层,小的在上层
            function drawRadialGradient() {
                var c = document.getElementById("canvas");
                var ctx = c.getContext("2d");
                ctx.lineWidth=3;
                var radialGradient = ctx.createRadialGradient(50,50,30,100,100,70);
                radialGradient.addColorStop(0, "red");
                radialGradient.addColorStop(.5, "rgb(0,255,0)");
                radialGradient.addColorStop(1, "#00f");
                ctx.fillStyle = radialGradient;
                ctx.clearRect(0, 0, c.width, c.height);
                ctx.fillRect(0, 0, 200, 200);
                ctx.strokeStyle = "yellow";
                ctx.strokeRect(0, 0, 200, 200);

                //必须beginPath和stroke结束线段,否则它们是连在一起的
                ctx.beginPath();
                ctx.arc(50,50,30,0,2*Math.PI);
                ctx.stroke();
                ctx.beginPath();
                ctx.arc(75,75,50,0,2*Math.PI);
                ctx.stroke();
                ctx.beginPath();
                ctx.arc(100,100,70,0,2*Math.PI);
                ctx.stroke();

                radialGradient = ctx.createRadialGradient(250,50,10,250,50,100);
                radialGradient.addColorStop(0, "red");
                radialGradient.addColorStop(1, "#00f");
                ctx.fillStyle = radialGradient;
                ctx.fillRect(200,0,100,100);

                ctx.beginPath();
                ctx.arc(250,50,10,0,2*Math.PI);
                ctx.stroke();
                ctx.beginPath();
                ctx.arc(250,50,100,0,2*Math.PI);
                ctx.stroke();

                radialGradient = ctx.createRadialGradient(250,150,100,250,150,10);
                radialGradient.addColorStop(0, "red");
                radialGradient.addColorStop(1, "#00f");
                ctx.fillStyle = radialGradient;
                ctx.fillRect(200,100,100,100);

                ctx.beginPath();
                ctx.arc(250,150,100,0,2*Math.PI);
                ctx.stroke();
                ctx.beginPath();
                ctx.arc(250,150,10,0,2*Math.PI);
                ctx.stroke();
            }
        </script>
    </head>
    <body>
        <button type="button" onclick="drawLinearGradient()">drawLinearGradient</button>
        <div>
            <img id="grass" src="grass.jpg"/>
            <button type="button" onclick="drawPattern('repeat')">drawPattern repeat</button>
            <button type="button" onclick="drawPattern('repeat-x')">drawPattern repeat-x</button>
            <button type="button" onclick="drawPattern('repeat-y')">drawPattern repeat-y</button>
            <button type="button" onclick="drawPattern('no-repeat')">drawPattern no-repeat</button>
        </div>
        <div><button type="button" onclick="drawRadialGradient()">drawRadialGradient</button></div>
        <canvas id="canvas" width="400" height="400" style="border:1px solid #aaa">
            <p>Your browser does not support the canvas element!</p>
        </canvas>
    </body>
</html>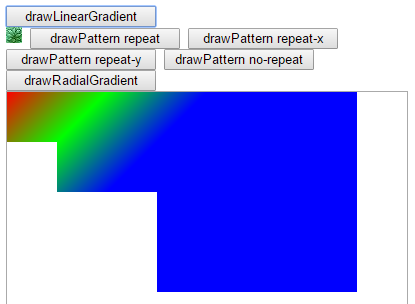
阴影
- shadowColor
设置或返回用于阴影的颜色。 - shadowBlur
设置或返回用于阴影的模糊级别。 - shadowOffsetX
设置或返回阴影与形状的水平距离,右为正方向。 - shadowOffsetY
设置或返回阴影与形状的垂直距离,下为正方向。
<html>
    <body>
        <canvas id="canvas" width="280" height="400" style="border:1px solid #aaa">
            <p>Your browser does not support the canvas element!</p>
        </canvas>
        <script type="text/javascript">
            var canvas = document.getElementById('canvas');
            var ctx = canvas.getContext('2d');
            ctx.shadowBlur=0;
            ctx.shadowColor="black";
            ctx.fillStyle='#f00';
            ctx.strokeStyle="#0f0"

            ctx.fillRect(10,10,100,50);
            ctx.strokeRect(130,10,100,50);

            ctx.shadowBlur=20;
            ctx.fillRect(10,100,100,50);
            ctx.strokeRect(130,100,100,50);

            ctx.shadowOffsetX=20;
            ctx.shadowOffsetY=20;
            ctx.fillRect(10,200,100,50);
            ctx.strokeRect(130,200,100,50);

            ctx.shadowBlur=0;
            ctx.fillRect(10,300,100,50);
            ctx.strokeRect(130,300,100,50);
        </script>
    </body>
</html>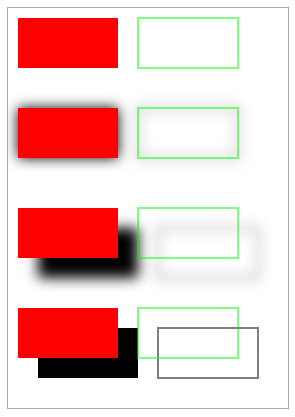
线条样式
- lineWidth(default 1)
设置或返回当前线条的宽度。 - lineCap
设置或返回线条的结束端点的样式。
- butt
默认。向线条的每个末端为平直的边缘。 - round
向线条的每个末端添加圆形线帽。 - square
向线条的每个末端添加正方形线帽。
- butt
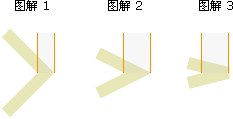
- lineJoin
设置或返回折线拐角类型。
- miter
默认。创建尖角。 - bevel
创建斜角 - round
创建圆角
- miter
- miterLimit(default 10)
设置或返回最大斜接长度。斜接长度指的是在两条线交汇处内角和外角之间的距离。边角的角度越小,斜接长度就会越大。为了避免斜接长度过长,我们才使用 miterLimit 属性。如果斜接长度超过 miterLimit 的值,边角会以 lineJoin 的 “bevel” 类型来显示。如果斜接长度没有超过miterLimit值,那么就会显示为实际的斜切长度。
只有当 lineJoin 属性为 “miter” 时,miterLimit 才有效。
<html>
    <head>
        <script type="text/javascript">
            function strokeLine(ctx, x1, y1, x2, y2, lineWidth) {
                ctx.strokeStyle="red";
                if(lineWidth === undefined) {
                    ctx.lineWidth = 1;
                } else {
                    ctx.lineWidth = lineWidth;
                }
                ctx.beginPath();
                ctx.moveTo(x1, y1);
                ctx.lineTo(x2, y2);
                //line只有stroke,如果换成fill是画不出线条的,因为没有闭合图形
                ctx.stroke();
            }
            function strokeLineWithCap(ctx, x1, y1, x2, y2, lineCap) {
                ctx.strokeStyle="black";
                ctx.lineWidth = 10;
                ctx.lineCap = lineCap;
                ctx.beginPath();
                ctx.moveTo(x1, y1);
                ctx.lineTo(x2, y2);
                ctx.stroke();
                strokeLine(ctx, x1-20, y1, x2+20, y2);
            }
            function strokeLineJoin(ctx, x1, y1, x2, y2, x3, y3, lineJoin) {
                ctx.strokeStyle="black";
                ctx.lineWidth = 10;
                ctx.lineJoin = lineJoin;
                ctx.beginPath();
                ctx.moveTo(x1, y1);
                ctx.lineTo(x2, y2);
                ctx.lineTo(x3, y3);
                ctx.stroke();
            }
            function draw() {
                var c = document.getElementById("canvas");
                var ctx = c.getContext("2d");
                var x=20,y=20,span=20;
                strokeLineWithCap(ctx, x, y, x+200, y, undefined);
                y+=span;
                strokeLineWithCap(ctx, x, y, x+200, y, "butt");
                y+=span;
                strokeLineWithCap(ctx, x, y, x+200, y, "round");
                y+=span;
                strokeLineWithCap(ctx, x, y, x+200, y, "square");

                x=20,y=100,span=60;
                strokeLineJoin(ctx, x, y, x+100, y+20, x, y+40, "bevel");
                y+=span;
                strokeLineJoin(ctx, x, y, x+100, y+20, x, y+40, "round");
                y+=span;
                strokeLineJoin(ctx, x, y, x+100, y+20, x, y+40, "miter");
                y+=span;
                ctx.miterLimit = 0;
                strokeLineJoin(ctx, x, y, x+100, y+20, x, y+40, "miter");
                y+=span;
                ctx.miterLimit = 1;
                strokeLineJoin(ctx, x, y, x+100, y+20, x, y+40, "miter");
                y+=span;
                ctx.miterLimit = 10;
                strokeLineJoin(ctx, x, y, x+100, y+20, x, y+40, "miter");
                y+=span;
                ctx.miterLimit = 30;
                strokeLineJoin(ctx, x, y, x+100, y+20, x, y+40, "miter");

                x = 90,y=100;
                strokeLine(ctx, x, y, x, y+400);

                x+=30;
                strokeLine(ctx, x, y, x, y+400);

                x+=23;
                strokeLine(ctx, x, y, x, y+400);


                x=200,y=130;
                var lineWidth = 40;
                strokeLine(ctx, x, y, x+100, y, lineWidth);
                ctx.strokeStyle = "blue";
                ctx.lineWidth = 1;
                ctx.beginPath();
                ctx.arc(x,y,lineWidth/2,0,2*Math.PI);
                ctx.stroke();
                ctx.beginPath();
                ctx.arc(x+100,y,lineWidth/2,0,2*Math.PI);
                ctx.stroke();

            }
        </script>
    </head>
    <body onload="draw()">
        <canvas id="canvas" width="400" height="550" style="border:1px solid #aaa">
            <p>Your browser does not support the canvas element!</p>
        </canvas>
    </body>
</html>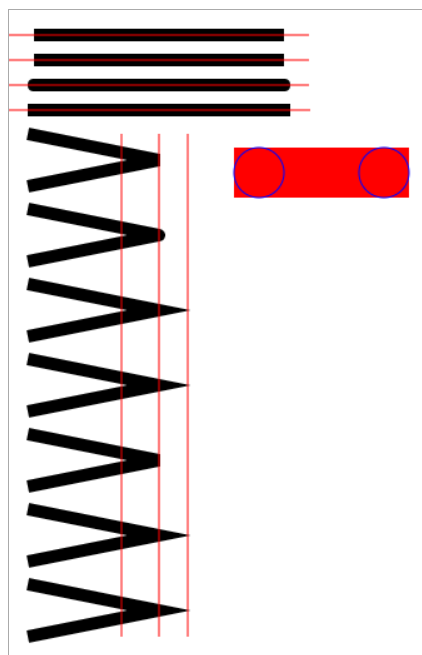
矩形
- rect(x, y, width, height)
创建矩形。接着使用 stroke() 或 fill() 方法才会在画布上实际地绘制出矩形。 - fillRect(x, y, width, height)
绘制“被填充”的矩形 - strokeRect(x, y, width, height)
绘制矩形边框 - clearRect(x, y, width, height)
清除给定的矩形区域内的像素
<html>
    <body>
         <canvas id="canvas" width="350" height="200" style="border:1px solid #aaa">
            <p>Your browser does not support the canvas element!</p>
        </canvas>
        <script type="text/javascript">
            var c=document.getElementById("canvas");
            var ctx=c.getContext("2d");

            ctx.beginPath();
            ctx.lineWidth="6";
            ctx.strokeStyle="red";
            ctx.rect(5,5,290,140);
            ctx.stroke();

            ctx.lineWidth="4";
            ctx.strokeStyle="green";
            ctx.strokeRect(30,30,50,50);

            ctx.fillStyle="blue";
            ctx.fillRect(50,50,150,80);

            ctx.clearRect(70,70,40,40);
        </script>
    </body>
</html>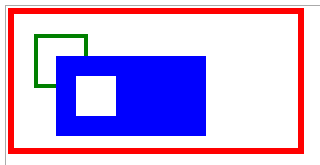
路径
- fill()
填充当前首尾相连的路径。注意:两个相反方向的路径内部为填充范围。否则最外层路径内部全是填充范围。 - stroke()
绘制当前定义的路径。 - beginPath()
起始一条路径,或重置当前路径。 - moveTo()
把路径移动到画布中的指定点,不创建线条。 - closePath()
创建从当前点回到起始点的路径。 - lineTo()
创建一个从当前点到该点的路径。 - clip()
从原始画布中将当前路径首尾相连并剪裁出来,一旦剪切了某个区域,则所有之后的绘图都会被限制在被剪切的区域内(不能访问画布上的其他区域)。可以在使用 clip() 方法前通过 save() 方法对当前画布区域进行保存,并在以后的任意时间通过 restore() 方法对其进行恢复。 - quadraticCurveTo(cpx, cpy, x, y)
绘制二次贝塞尔曲线。
- cpx
贝塞尔控制点的 x 坐标 - cpy
贝塞尔控制点的 y 坐标 - x
结束点的 x 坐标 - y
结束点的 y 坐标
- cpx
- bezierCurveTo(cp1x, cp1y, cp2x, cp2y, x, y)
绘制三次贝塞尔曲线。
- cp1x
第一个贝塞尔控制点的 x 坐标 - cp1y
第一个贝塞尔控制点的 y 坐标 - cp2x
第二个贝塞尔控制点的 x 坐标 - cp2y
第二个贝塞尔控制点的 y 坐标 - x
结束点的 x 坐标 - y
结束点的 y 坐标
- cp1x
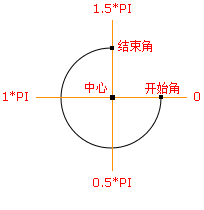
- arc(x,y,r,sAngle,eAngle,counterclockwise)
创建圆或部分圆。顺时针方向为正。
- x
圆的中心的 x 坐标。 - y
圆的中心的 y 坐标。 - r
圆的半径。 - sAngle
起始角,以弧度计。(弧的圆形的三点钟位置是 0 度)。 - eAngle
结束角,以弧度计。 - counterclockwise
可选,规定应该逆时针还是顺时针绘图。False 为顺时针,true 为逆时针。
- x
- arcTo(arcStartX, arcStartY, arcEndX, arcEndY, r)
创建两切线之间的弧/曲线。之前一定要使用moveTo() 到某个点,该点若不是弧的起始点则会自动连接到弧的起始点上。 - isPointInPath()
如果指定的点位于当前路径内或路径上,则返回 true,否则返回 false。
<html>
    <head>
        <meta charset="UTF-8" />
    </head>
    <body>
        <canvas id="canvas" width="700px" height="450px" style="border:dashed black 1px;">
            <p>Your browser does not support the canvas element!</p>
        </canvas>
        <script type="text/javascript">
            var c=document.getElementById("canvas");
            var ctx=c.getContext("2d");
            function fillArc(ctx,x,y,color) {
                if(color) {
                    ctx.fillStyle=color;
                } else {
                    ctx.fillStyle="red";
                }
                ctx.beginPath();
                ctx.arc(x,y,3,0,2*Math.PI);
                ctx.fill();
            }

            ctx.beginPath();
            ctx.moveTo(20,20);
            //arcTo之前一定要有moveTo
            ctx.arcTo(100,20,100,70,50);
            ctx.stroke();

            fillArc(ctx,50,20);
            fillArc(ctx,100,20);
            fillArc(ctx,100,70);
            fillArc(ctx,100,120);

            ctx.beginPath();
            ctx.arc(200,70,50,0,1.5*Math.PI);
            ctx.stroke();

            ctx.beginPath();
            ctx.arc(300,70,50,0,0.5*Math.PI);
            ctx.stroke();

            ctx.beginPath();
            ctx.arc(200,200,50,0,1.5*Math.PI);
            ctx.fill();

            ctx.beginPath();
            ctx.arc(300,200,50,0,0.5*Math.PI);
            ctx.fill();

            ctx.beginPath();
            ctx.moveTo(400,50);
            ctx.lineTo(400,100);
            ctx.lineTo(450,100);
            ctx.stroke();

            ctx.beginPath();
            ctx.moveTo(400,150);
            ctx.lineTo(400,200);
            ctx.lineTo(450,200);
            //closePath的作用是使路径首尾相连
            ctx.closePath();
            ctx.stroke();

            //isPointInPath
            function checkIsInPath(ctx,x,y) {
                //该函数由于只能判断当前路径,因此不能马上就绘制。凡是在可绘制区域包括边界的都算在路径范围内
                if(ctx.isPointInPath(x,y)) {
                    return true;
                }
                return false;
            }
            ctx.beginPath();
            ctx.moveTo(400,250);
            ctx.lineTo(400,300);
            ctx.lineTo(450,300);
            ctx.fill();

            var xArr=new Array(400,400,450,425,415,450);
            var yArr=new Array(250,300,300,275,285,250);
            var isInPathArr=new Array();
            for(var i=0;i<xArr.length;i++) {
                isInPathArr.push(checkIsInPath(ctx,xArr[i],yArr[i]));
            }
            var r=3;
            for(var i=0;i<xArr.length;i++) {
                if(isInPathArr[i]) {
                    ctx.fillStyle="green";
                } else {
                    ctx.fillStyle="blue";
                }
                fillArc(ctx,xArr[i],yArr[i],ctx.fillStyle);
            }

            //二次贝塞尔曲线
            var sx=540,sy=50,cx=520,cy=130,ex=650,ey=50;
            ctx.beginPath();
            ctx.moveTo(sx,sy);
            ctx.quadraticCurveTo(cx,cy,ex,ey);
            ctx.stroke();

            fillArc(ctx,sx,sy);
            fillArc(ctx,cx,cy);
            fillArc(ctx,ex,ey);
            ctx.textAlign="center";
            ctx.fillText("开始点("+sx+","+sy+")",sx,sy-10);
            ctx.fillText("结束点("+ex+","+ey+")",ex,ey-10);
            ctx.fillText("控制点("+cx+","+cy+")",cx,cy+20);
            ctx.strokeStyle="orange";
            ctx.beginPath();
            ctx.moveTo(sx,sy);
            ctx.lineTo(cx,cy);
            ctx.lineTo(ex,ey);
            ctx.stroke();

            //三次贝塞尔曲线
            sx=540,sy=200,ex=650,ey=200;
            var c1x=540,c1y=300,c2x=650,c2y=300;
            ctx.strokeStyle="black";
            ctx.beginPath();
            ctx.moveTo(sx,sy);
            ctx.bezierCurveTo(c1x,c1y,c2x,c2y,ex,ey);
            ctx.stroke();

            fillArc(ctx,sx,sy);
            fillArc(ctx,c1x,c1y);
            fillArc(ctx,c2x,c2y);
            fillArc(ctx,ex,ey);
            ctx.fillStyle="blue";
            ctx.fillText("开始点("+sx+","+sy+")",sx,sy-10);
            ctx.fillText("结束点("+ex+","+ey+")",ex,ey-10);
            ctx.fillText("控制点1("+c1x+","+c1y+")",c1x,c1y+20);
            ctx.fillText("控制点2("+c2x+","+c2y+")",c2x,c2y+20);
            ctx.strokeStyle="orange";
            ctx.beginPath();
            ctx.moveTo(sx,sy);
            ctx.lineTo(c1x,c1y);
            ctx.lineTo(c2x,c2y);
            ctx.lineTo(ex,ey);
            ctx.stroke();

            //clip
            ctx.fillStyle="red";
            ctx.fillRect(20,300,150,100);
            ctx.fillStyle="blue";
            ctx.save();
            ctx.beginPath();
            ctx.arc(85,350,50,0,0.75*Math.PI);
            ctx.stroke();

            ctx.clip();
            ctx.fillRect(20,300,150,100);
            ctx.restore();
            ctx.fillRect(220,300,150,100);
        </script>
    </body>
</html> 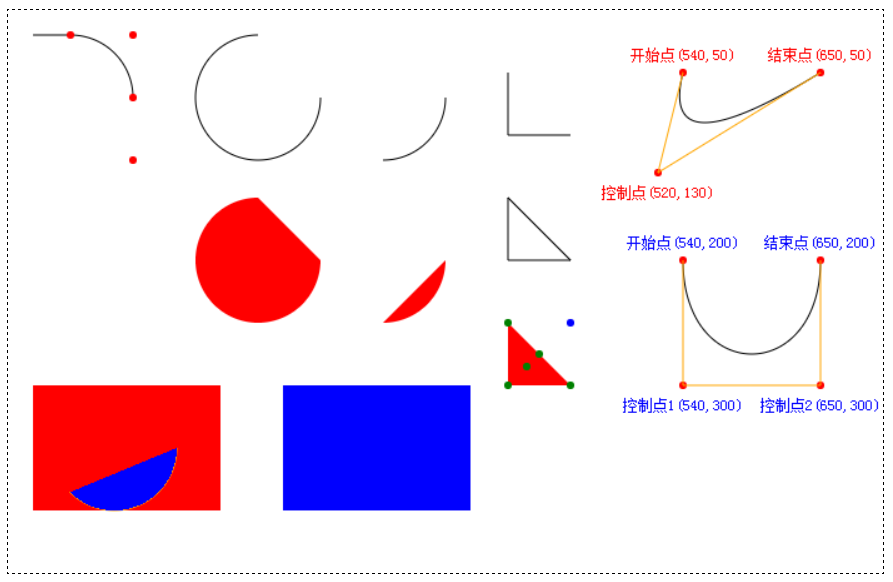
转换
- scale(scalewidth, scaleheight)
缩放当前的坐标系标尺。 - rotate(angle)
顺时针旋转画布。angle以弧度计。如需将角度转换为弧度,请使用 degrees*Math.PI/180 公式进行计算。 - translate(x, y)
将画布向右移动x, 将画布向下移动y。 - transform(a, b, c, d, e, f);
transform() 方法的行为相对于由 rotate(), scale(), translate(), or transform() 组合对画布完成的变换。
变换矩阵为
a c e
b d f
0 0 1
- a
水平缩放 - b
水平倾斜 - c
垂直倾斜 - d
垂直缩放 - e
水平移动 - f
垂直移动
- a
- setTransform(a, b, c, d, e, f);
把当前的变换矩阵重置为单位矩阵,然后以相同的参数运行 transform()。
变换矩阵为
a c e
b d f
0 0 1
- a
水平缩放 - b
水平倾斜 - c
垂直倾斜 - d
垂直缩放 - e
水平移动 - f
垂直移动
- a
<html>
    <head>
        <style type="text/css">
            canvas {
                 border-width:1px;
                 border-style:dashed;
                 border-color:black;
            }
        </style>
    </head>
    <body>
        <canvas id="canvas1">
            <p>Your browser does not support the canvas element!</p>
        </canvas>
        <canvas id="canvas2">
            <p>Your browser does not support the canvas element!</p>
        </canvas>
        <canvas id="canvas3">
            <p>Your browser does not support the canvas element!</p>
        </canvas>
        <canvas id="canvas4">
            <p>Your browser does not support the canvas element!</p>
        </canvas>
        <canvas id="canvas5">
            <p>Your browser does not support the canvas element!</p>
        </canvas>
        <script type="text/javascript">
            function drawGrid(canvas) {
                canvas.width=450;
                canvas.height=450;
                var ctx=c.getContext("2d");
                ctx.lineWidth=1;
                ctx.strokeStyle="black";
                for(var i=0;i<c.width;i+=50) {
                    ctx.beginPath();
                    ctx.moveTo(i,0);
                    ctx.lineTo(i,c.height);
                    ctx.stroke();
                }
                for(var j=0;j<c.height;j+=50) {
                    ctx.beginPath();
                    ctx.moveTo(0,j);
                    ctx.lineTo(c.width,j);
                    ctx.stroke();
                }
            }
        </script>
        <script type="text/javascript">
            //scale
            var c=document.getElementById("canvas1");
            var ctx=c.getContext("2d");
            drawGrid(c);
            ctx.globalAlpha=0.5;
            ctx.save();

            ctx.fillStyle="red";
            ctx.fillRect(0,0,50,50);

            ctx.fillStyle="green";
            ctx.scale(2,2);
            ctx.fillRect(0,0,50,50);

            ctx.fillStyle="blue";
            ctx.scale(2,2);
            ctx.fillRect(0,0,50,50);

            ctx.restore();
            ctx.fillStyle="red";
            ctx.fillRect(50,50,50,50);

            ctx.fillStyle="green";
            ctx.scale(2,2);
            ctx.fillRect(50,50,50,50);

            ctx.fillStyle="blue";
            ctx.scale(2,2);
            ctx.fillRect(50,50,50,50);
        </script>
        <script type="text/javascript">
            //rotate
            var c=document.getElementById("canvas2");
            var ctx=c.getContext("2d");
            drawGrid(c);
            ctx.save();

            ctx.fillStyle="red";
            ctx.fillRect(0,0,50,50);

            ctx.fillStyle="green";
            ctx.rotate(30*Math.PI/180);
            ctx.fillRect(0,0,50,50);

            ctx.fillStyle="blue";
            ctx.rotate(30*Math.PI/180);
            ctx.fillRect(0,0,50,50);

            ctx.restore();
            ctx.fillStyle="red";
            ctx.fillRect(100,0,50,50);

            ctx.fillStyle="green";
            ctx.rotate(30*Math.PI/180);
            ctx.fillRect(100,0,50,50);

            ctx.fillStyle="blue";
            ctx.rotate(30*Math.PI/180);
            ctx.fillRect(100,0,50,50);
        </script>
        <script type="text/javascript">
            //translate
            var c=document.getElementById("canvas3");
            var ctx=c.getContext("2d");
            drawGrid(c);
            ctx.save();

            ctx.fillStyle="red";
            ctx.fillRect(0,0,50,50);

            ctx.fillStyle="green";
            ctx.translate(50,0);
            ctx.fillRect(0,0,50,50);

            ctx.fillStyle="blue";
            ctx.translate(50,0);
            ctx.fillRect(0,0,50,50);

            ctx.restore();
            ctx.fillStyle="red";
            ctx.fillRect(100,100,50,50);

            ctx.fillStyle="green";
            ctx.translate(0,50);
            ctx.fillRect(100,100,50,50);

            ctx.fillStyle="blue";
            ctx.translate(0,50);
            ctx.fillRect(100,100,50,50);
        </script>
        <script type="text/javascript">
            //transform
            var c=document.getElementById("canvas4");
            var ctx=c.getContext("2d");
            drawGrid(c);
            ctx.globalAlpha=0.5;
            ctx.save();

            ctx.fillStyle="red";
            ctx.fillRect(0,0,50,50);

            ctx.transform(1,0.5,0,1,0,0);
            ctx.fillStyle="green";
            ctx.fillRect(0,0,50,50);

            ctx.transform(1,0,1,1,0,0);
            ctx.fillStyle="blue";
            ctx.fillRect(0,0,50,50);

            ctx.restore();
            ctx.fillStyle="red";
            ctx.fillRect(100,100,50,50);

            ctx.transform(1,0.5,0,1,0,0);
            ctx.fillStyle="green";
            ctx.fillRect(100,100,50,50);

            ctx.transform(1,0,1,1,0,0);
            ctx.fillStyle="blue";
            ctx.fillRect(100,100,50,50);
        </script>
        <script type="text/javascript">
            //setTransform
            var c=document.getElementById("canvas5");
            var ctx=c.getContext("2d");
            drawGrid(c);
            ctx.globalAlpha=0.5;

            ctx.fillStyle="red";
            ctx.fillRect(0,0,50,50);

            ctx.setTransform(1,0.5,0,1,0,0);
            ctx.fillStyle="green";
            ctx.fillRect(0,0,50,50);

            ctx.setTransform(1,0,1,1,0,0);
            ctx.fillStyle="blue";
            ctx.fillRect(0,0,50,50);

            //把当前的变换矩阵重置为单位矩阵
            ctx.setTransform(1,0,0,1,0,0);
            ctx.fillStyle="red";
            ctx.fillRect(100,100,50,50);

            ctx.setTransform(1,0.5,0,1,0,0);
            ctx.fillStyle="green";
            ctx.fillRect(100,100,50,50);

            ctx.setTransform(1,0,1,1,0,0);
            ctx.fillStyle="blue";
            ctx.fillRect(100,100,50,50);
        </script>
    </body>
</html> 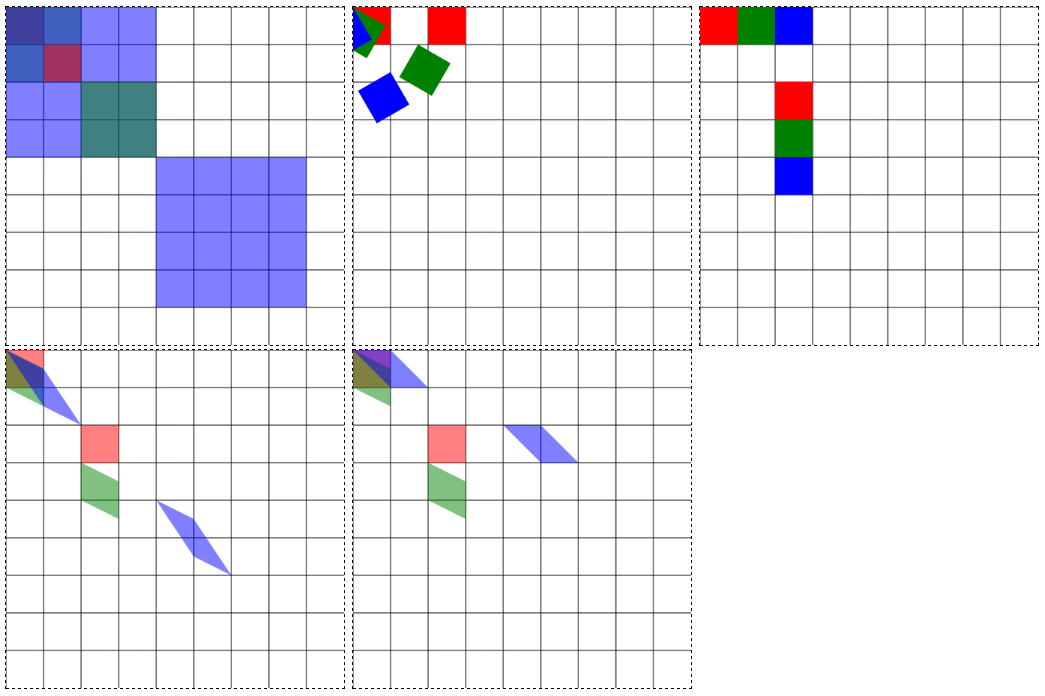
文本
- font
设置或返回文本内容的当前字体属性。该属性的设置方式和CSS中是一样的(参考 http://blog.csdn.net/chy555chy/article/details/53541662) - textAlign(default start)
设置或返回文本内容的当前对齐方式。
- start
默认。文本在指定的位置开始。(与left效果一样) - center
文本的中心被放置在指定的位置。 - end
文本在指定的位置结束。(与right效果一样) - left
文本左对齐到指定位置。(与start效果一样) - right
文本右对齐到指定位置。(与end效果一样)
- start
- textBaseline(default alphabetic)
设置或返回在绘制文本时使用的当前文本基线
- alphabetic
默认。文本基线是普通的字母的基线。(字母a的底部) - bottom
文本基线是 em 方框的底端。(字母g的底部,和ideographic一样) - handing
文本基线是悬挂基线。(字母h的顶部) - ideographic
文本基线是表意基线。(字母g的底部,和bottom一样) - middle
文本基线是 em 方框的正中。(字母e的横向处) - top
文本基线是 em 方框的顶端。(字母h的顶部都碰不到基线)
- alphabetic
- fillText(text, x, y [, maxWidth])
在画布上绘制“被填充的”文本。
- text
规定在画布上输出的文本。注意:该方法不支持换行符,换行符会被解析为空格。因此如果需要换行,唯一的办法就是指定它的maxWidth。 - x
开始绘制文本的 x 坐标位置(相对于画布)。 - y
开始绘制文本的 y 坐标位置(相对于画布)。 - maxWidth
可选参数。表示允许文本的最大宽度,如果超过该宽度的话,文本会被压缩。
- text
- strokeText(text, x, y [, maxWidth])
在画布上绘制文本边框。maxwidth 表示了该字符串的最大宽度,无论字符串有多长,都将限制在该宽度内。 - measureText(txt).width
返回指定文本实际绘制的宽度。注意:只包含宽度width属性,不包含高度height属性
<html>
    <<meta charset="UTF-8" />
    <body>
         <canvas id="canvas" width="600" height="550" style="border:1px solid #aaa">
            <p>Your browser does not support the canvas element!</p>
        </canvas>
        <script type="text/javascript">
            var c = document.getElementById("canvas");
            var ctx = c.getContext("2d");
            ctx.strokeStyle = "blue";
            ctx.font="20px Arial";

            //textAlign
            var x=150,y=20,span=20;
            ctx.moveTo(x,y);
            ctx.lineTo(x,y+110);
            ctx.stroke();

            y+=span;
            ctx.textAlign="center";
            ctx.fillText("textAlign=center",x,y);
            y+=span;
            ctx.textAlign="end";
            ctx.fillText("textAlign=end",x,y);
            y+=span;
            ctx.textAlign="left";
            ctx.fillText("textAlign=left",x,y);
            y+=span;
            ctx.textAlign="right";
            ctx.fillText("textAlign=right",x,y);
            y+=span;
            ctx.textAlign="start";
            ctx.fillText("textAlign=start",x,y);

            ctx.textAlign="start";
            //textBaseline
            x=5,y=170,span=100;
            ctx.moveTo(x,y);
            ctx.lineTo(x+600,y);
            ctx.stroke();

            ctx.textBaseline="alphabetic";
            ctx.fillText("alphabetic",x,y);
            x+=span;
            ctx.textBaseline="bottom";
            ctx.fillText("bottom g",x,y);
            x+=span;
            ctx.textBaseline="hanging";
            ctx.fillText("hanging",x,y);
            x+=span;
            ctx.textBaseline="ideographic";
            ctx.fillText("ideographic",x,y);
            x+=span;
            ctx.textBaseline="middle";
            ctx.fillText("middle",x,y);
            x+=span;
            ctx.textBaseline="top";
            ctx.fillText("top h",x,y);

            x=20,y=200,span=40;
            textBaseline="alphabetic";
            ctx.font="bold 30px Georgia";
            ctx.fillStyle = "blue";
            ctx.fillText("测试文本",x,y);
            y+=span;
            ctx.strokeText("测试文本",x,y);
            y+=span;
            ctx.fillText("测试文本",x,y,50);
            y+=span;
            ctx.strokeText("测试文本",x,y,50);

            var txt="w3school.com.cn";
            var gradient=ctx.createLinearGradient(x,y,x+ctx.measureText(txt).width,y);
            gradient.addColorStop("0","magenta");
            gradient.addColorStop("0.5","blue");
            gradient.addColorStop("1.0","red");
            ctx.fillStyle=gradient;
            y+=span;
            ctx.fillText(txt,x,y);
            ctx.strokeStyle=gradient;
            y+=span;
            ctx.strokeText(txt,x,y);
            y+=span;
            ctx.fillText(txt,x,y,150);
            y+=span;
            ctx.strokeText(txt,x,y,150);
        </script>
    </body>
</html>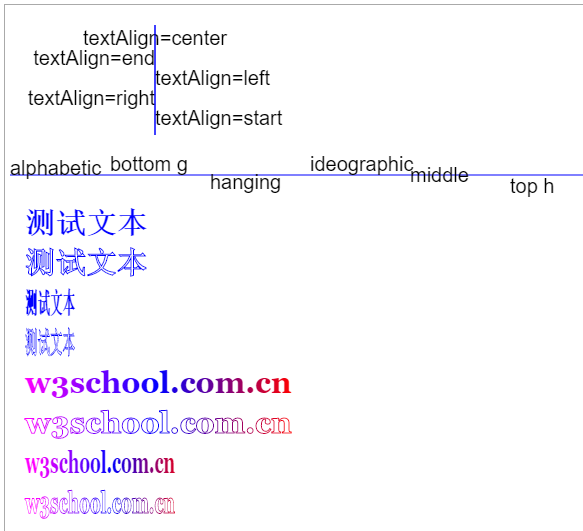
绘制图像
- drawImage(img, x, y)
向画布上(x, y)点绘制图像、画布或视频。 - drawImage(img, x, y, width, height)
在画布上(x, y)点绘制图像,把图像的所有内容绘制到宽度和高度分别为width和height的矩形中。 - drawImage(img, sx, sy, swidth, sheight, x, y, width, height)
从图像的(sx, sy)点开始剪裁出一个大小为(swidth, sheight)的矩形,在画布上(x, y)点绘制图像,绘制宽度和高度分别为width和height。
<html>
    <body>
        <style type="text/css">
        </style>
        <img id="img" src="simayi.jpg" />
        <canvas id="canvas1" width="350" height="300" style="border:1px solid #aaa">
            <p>Your browser does not support the canvas element!</p>
        </canvas>
        <canvas id="canvas2" width="280" height="300" style="border:1px solid #aaa;display:none"/>
        <script type="text/javascript">
            var canvas2 = document.getElementById('canvas2');
            var ctx2 = canvas2.getContext('2d');
            ctx2.fillStyle="red";
            ctx2.fillRect(0, 0, 260, 50);

            var canvas1 = document.getElementById('canvas1');
            var ctx1 = canvas1.getContext('2d');
            var img = document.getElementById('img');
            img.onload = function() {
                ctx1.drawImage(img, 10, 10);
                ctx1.drawImage(img, 290, 10, 50, 50);
            }
            ctx1.drawImage(canvas2, 10, 220);
        </script>
    </body>
</html>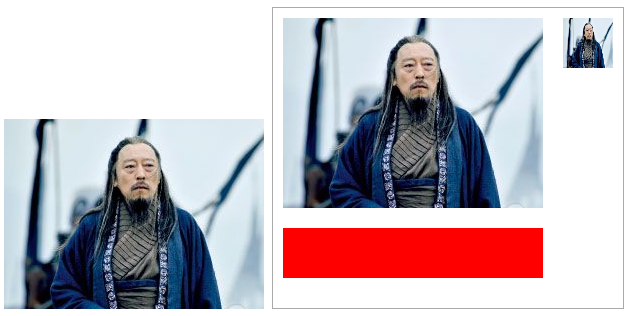
像素操作
- imageData.width
返回 ImageData 对象的宽度 - imageData.height
返回 ImageData 对象的高度 - imageData.data
返回一个对象,其包含指定的 ImageData 对象的图像数据,data数据中的像素点从左上角到右下角,且每个像素都存在着四方面的信息,即 RGBA 值。color/alpha 以数组形式存在,并存储于 ImageData 对象的 data 属性中。
- R - 红色 (0-255)
- G - 绿色 (0-255)
- B - 蓝色 (0-255)
- A - alpha 通道 (0-255; 0 是透明的,255 是完全可见的)
- createImageData(width,height)
创建新的、空白的 ImageData 对象。 - createImageData(imageData)
创建与指定的另一个 ImageData 对象尺寸相同的新的空的 ImageData 对象(不会复制图像数据) - getImageData(x, y, width, height)
返回 ImageData 对象,该对象为画布上指定的矩形复制像素数据。 - putImageData(imageData, x, y[, dirtyX, dirtyY, dirtyWidth, dirtyHeight])
把图像数据(从指定的 ImageData 对象)放回画布上。
- imageData
规定要放回画布的 ImageData 对象。 - x
ImageData 对象相对画布的左上角的 x 坐标。 - y
ImageData 对象相对画布的左上角的 y 坐标。 - dirtyX
可选。要在画布上绘制的相对本图像的 x 坐标。 - dirtyY
可选。要在画布上绘制的相对本图像的 y 坐标。 - dirtyWidth
可选。要在画布上绘制的相对本图像的实际宽度。 - dirtyHeight
可选。要在画布上绘制的相对本图像的实际高度。
- imageData
<html>
    <body>
         <canvas id="canvas" width="250" height="250" style="border:1px solid #aaa">
            <p>Your browser does not support the canvas element!</p>
        </canvas>
        <script type="text/javascript">
            var c = document.getElementById("canvas");
            var ctx = c.getContext("2d");
            var imgData = ctx.createImageData(200, 200);
            for(var i=0;i<imgData.data.length;i+=4) {
                imgData.data[i]=255;
                imgData.data[i+1]=0;
                imgData.data[i+2]=0;
                imgData.data[i+3]=255;
            }
            ctx.putImageData(imgData,10,10);
            document.write("("+imgData.width+" * "+imgData.height+")");

            imgData = ctx.getImageData(30,30,80,80);
            for(var i=0,j=0,k=0;i<imgData.data.length;i+=4) {
                imgData.data[i]=(j==0?255:0);
                imgData.data[i+1]=(j==1?255:0);
                imgData.data[i+2]=(j==2?255:0);
                imgData.data[i+3]=128;
                k++;
                if(k>25) {
                    k=0;
                    j++;
                    j%=3;
                }
            }
            ctx.putImageData(imgData,30,30);

            imgData = ctx.createImageData(imgData);
            ctx.putImageData(imgData,150,30);

            for(var i=0,j=0,k=0;i<imgData.data.length;i+=4) {
                imgData.data[i]=(j==0?255:0);
                imgData.data[i+1]=(j==1?255:0);
                imgData.data[i+2]=(j==2?255:0);
                imgData.data[i+3]=128;
                k++;
                if(k>40) {
                    k=0;
                    j++;
                    j%=3;
                }
            }
            ctx.putImageData(imgData,30,120);

            ctx.lineWidth=2;
            ctx.strokeStyle="black";
            ctx.strokeRect(140,120,80,80);
            ctx.putImageData(imgData,140,120, 20,20,60,60);
        </script>
    </body>
</html>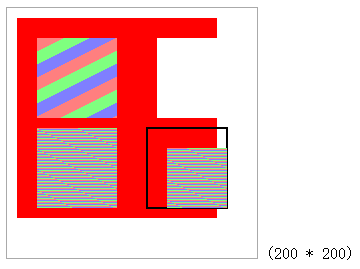
合成
- globalAlpha
设置或返回绘图的当前 alpha 或透明值 - globalCompositeOperation
设置或返回新图像如何绘制到已有的图像上
- source-over
默认。在目标图像上显示源图像。 - source-atop
在目标图像顶部显示源图像。源图像位于目标图像之外的部分是不可见的。 - source-in
在目标图像中显示源图像。只有目标图像内的源图像部分会显示,目标图像是透明的。 - source-out
在目标图像之外显示源图像。只会显示目标图像之外源图像部分,目标图像是透明的。 - destination-over
在源图像上方显示目标图像。 - destination-atop
在源图像顶部显示目标图像。源图像之外的目标图像部分不会被显示。 - destination-in
在源图像中显示目标图像。只有源图像内的目标图像部分会被显示,源图像是透明的。 - destination-out
在源图像外显示目标图像。只有源图像外的目标图像部分会被显示,源图像是透明的。 - lighter
显示源图像 + 目标图像,即RGB各分量相加。 - copy
显示源图像。忽略目标图像。 - xor
使用异或操作对源图像与目标图像进行组合。
- source-over
<html>
    <body>
        <canvas id="canvas" width="1000" height="500" style="border:1px solid #aaa">
            <p>Your browser does not support the canvas element!</p>
        </canvas>
        <script type="text/javascript">
            var c = document.getElementById("canvas");
            var ctx = c.getContext("2d");

            var x=20,y=20;
            ctx.fillStyle="red";
            ctx.fillRect(x,y,70,50);

            x+=30,y+=30;
            ctx.globalAlpha=0.2;
            ctx.fillStyle="blue";
            ctx.fillRect(x,y,70,50);

            x+=30,y+=30;
            ctx.fillStyle="green";
            ctx.fillRect(x,y,70,50);

            ctx.globalAlpha=1;
            ctx.font="14px Arial";
            ctx.fillStyle="black";
            ctx.fillText("globalAlpha",20,150);

            function testGlobalCompositeOperation(x,y,compositeOperation) {
                var c2 = document.createElement("canvas");
                c2.width=120;
                c2.height=130;
                var ctx2 = c2.getContext("2d");

                ctx2.fillStyle="red";
                ctx2.fillRect(10,10,70,50);
                ctx2.globalCompositeOperation=compositeOperation;
                ctx2.fillStyle="blue";
                ctx2.fillRect(30,30,70,50);

                <!-- 由于该属性会作用到drawImage上导致有些图像消失,所以用完之后得恢复默认属性(不能设置为undefined) -->
                ctx2.globalCompositeOperation = "source-over";
                ctx2.font="14px Arial";
                ctx2.fillStyle="black";
                ctx2.fillText(compositeOperation,10,120);

                ctx.drawImage(c2, x, y, c2.width, c2.height);
                ctx.strokeRect(x, y, c2.width, c2.height);
            }

            var gco=new Array();
            gco.push("source-atop");
            gco.push("source-in");
            gco.push("source-out");
            gco.push("source-over");
            gco.push("destination-atop");
            gco.push("destination-in");
            gco.push("destination-out");
            gco.push("destination-over");
            gco.push("lighter");
            gco.push("copy");
            gco.push("xor");

            x=20,y=180;
            var span=160;

            for (var i=0;i<gco.length;i++) {
                testGlobalCompositeOperation(x,y,gco[i]);
                if(i==5) {
                    x=20,y+=150;
                } else {
                    x+=span;
                }
            }

            ctx.fillText("globalCompositeOperation", 20, 490);
        </script>
    </body>
</html>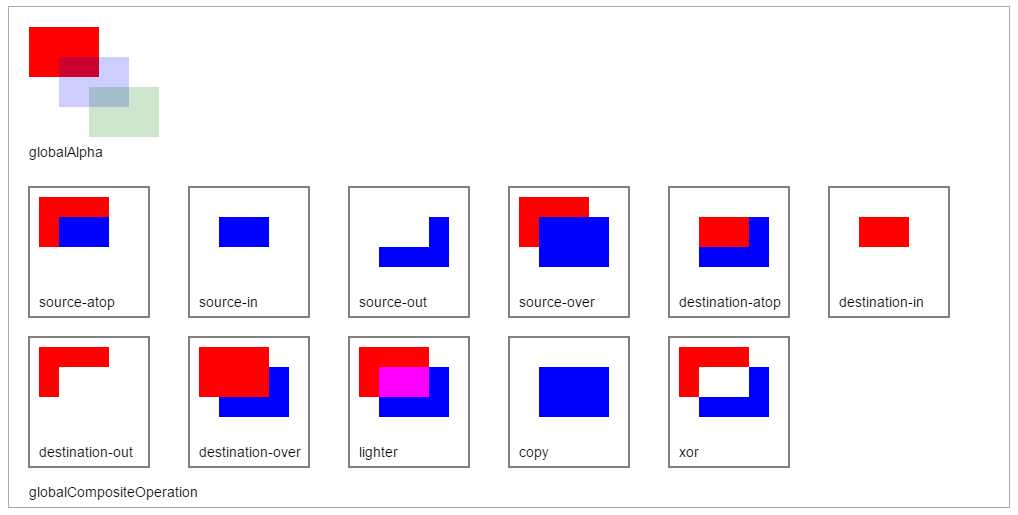
其它
save() 和 restore()
Canvas 的状态是以堆(stack)的方式保存的,每一次调用 save 方法,当前的状态就会被推入堆中保存起来。
这种状态包括:当前应用的变形(即移动,旋转和缩放等): strokeStyle, fillStyle, globalAlpha, lineWidth, lineCap, lineJoin, miterLimit, shadowOffsetX, shadowOffsetY, shadowBlur, shadowColor, globalCompositeOperation 的值。
你可以调用任意多次 save 方法。每一次调用 restore 方法,上一个保存的状态就从堆中弹出,所有设定都恢复。


 3370
3370

 被折叠的 条评论
为什么被折叠?
被折叠的 条评论
为什么被折叠?
 到【灌水乐园】发言


