


下载链接:【免费】高光谱图像数据集(HyperspectralImageDatasets)(1)资源-CSDN文库
1.Indian Pines
(1)数据集介绍
Indian Pines Dataset: The Indian Pines dataset was acquired in 1992 by the Airborne Visible Infrared Imaging Spectrometer(AVIRIS) in the Indian Pines region of Indiana, USA. The data size is 145 × 145 pixels, and a total of 10,249 pixel samples are labeled for training and testing purposes in HSI classification. The wavelength range of the AVIRIS spectrometer is from 0.4 to 2.5 μm, capable of imaging the ground over 220 consecutive bands. 20 bands that could not be reflected by water were removed, leaving a total of 200 bands for analysis.
(2)类别介绍
| Indian Pines | ||
| No. | Class Name | Number |
| 1 | Alfalfa | 46 |
| 2 | Corn-notill | 1428 |
| 3 | Corn-mintill | 830 |
| 4 | Corn | 237 |
| 5 | Grass-pasture | 483 |
| 6 | Grass-trees | 730 |
| 7 | Grass-pasture-mowed | 28 |
| 8 | Hay-windrowed | 478 |
| 9 | Oats | 20 |
| 10 | Soybean-notill | 972 |
| 11 | Soybean-mintill | 2455 |
| 12 | Soybean-clean | 593 |
| 13 | Wheat | 205 |
| 14 | Woods | 1265 |
| 15 | Buildings | 386 |
| 16 | Stone-Steel-Towers | 93 |
| Total | 10249 | |
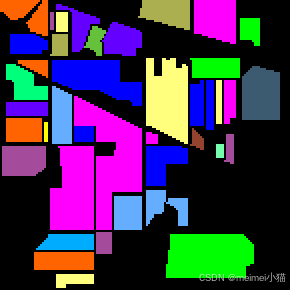
(3)图像
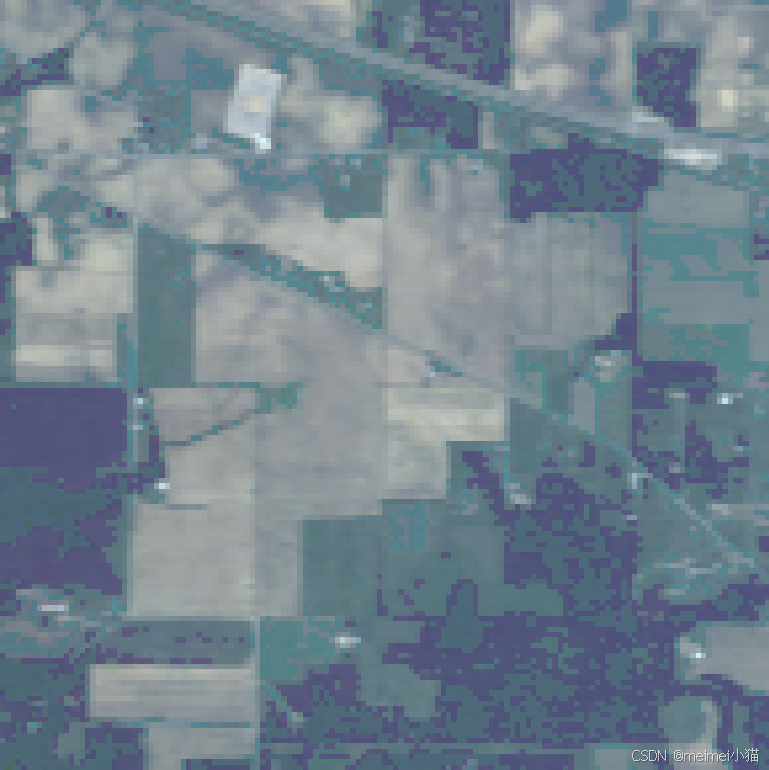
Indian Pines_false color
Indian Pines_gt

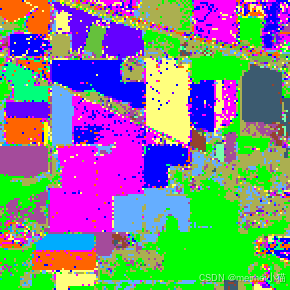
Indian Pines_pred_1
Indian Pines_pred_2
(4)调用代码
data = sio.loadmat('./data/Indian_Pines/Indian_pines_corrected.mat')['indian_pines_corrected']
labels = sio.loadmat('./data/Indian_Pines/Indian_pines_gt.mat')['indian_pines_gt']
2.Pavia University
(1)数据集介绍
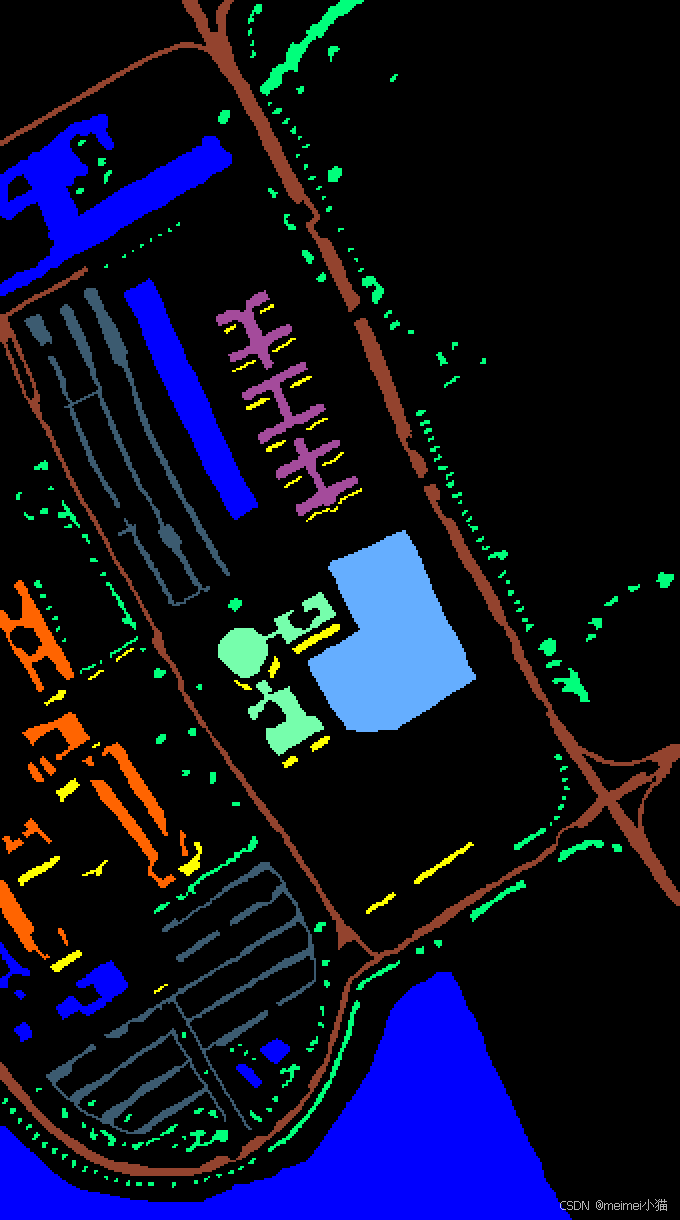
Pavia University Dataset:The Pavia University dataset was acquired in 2003 by the Reflective Optics Spectrographic Imaging System (ROSIS-03) in parts of the city of Pavia, Italy.The data size is 610 x 340 pixels, with 42,776 pixel samples labeled for training and testing purposes in HSI classification.The wavelength range of the ROSIS-03 spectrometer is from 0.43 to 0.86 μm, capable of imaging the ground over 115 consecutive bands. 12 bands severely affected by noise were removed, leaving a total of 103 bands for analysis.
(2)类别介绍
| Pavia University | ||
| No. | Class Name | Number |
| 1 | Asphalt | 6631 |
| 2 | Meadows | 18649 |
| 3 | Gravel | 2099 |
| 4 | Trees | 3064 |
| 5 | Painted metal sheets | 1345 |
| 6 | Bare soil | 5029 |
| 7 | Bitumen | 1330 |
| 8 | Self-blocking bricks | 3682 |
| 9 | Shadows | 947 |
| Total | 42776 | |
(3)图像
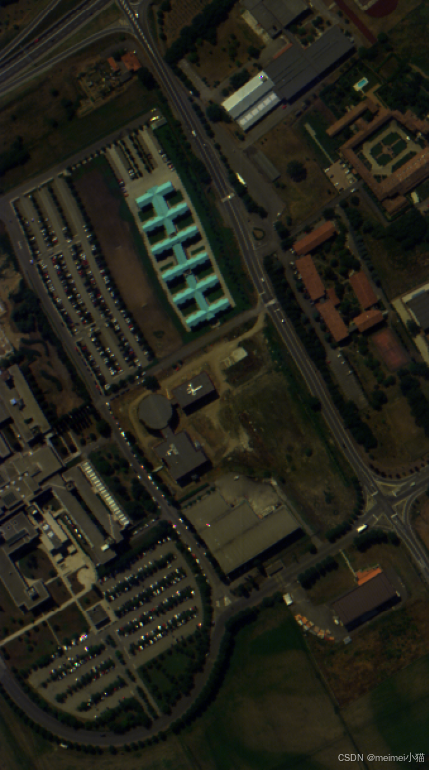
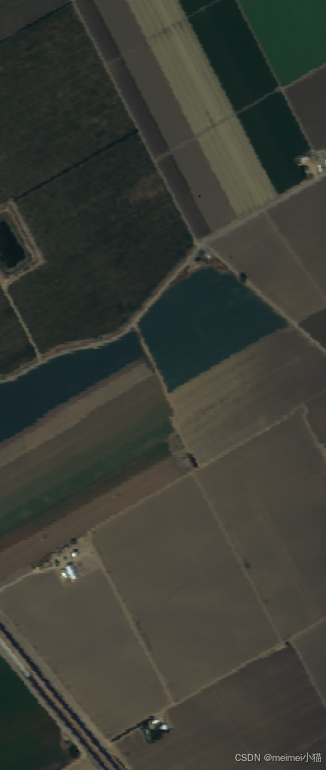
Pavia University_false color
Pavia University_gt
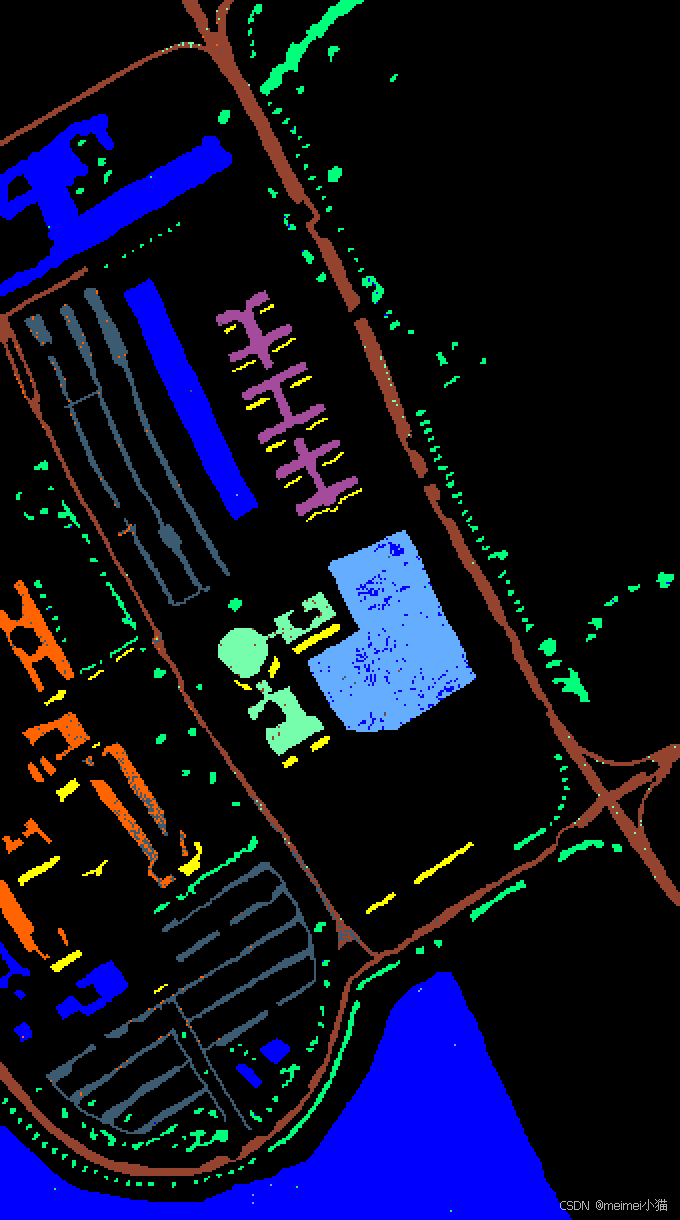
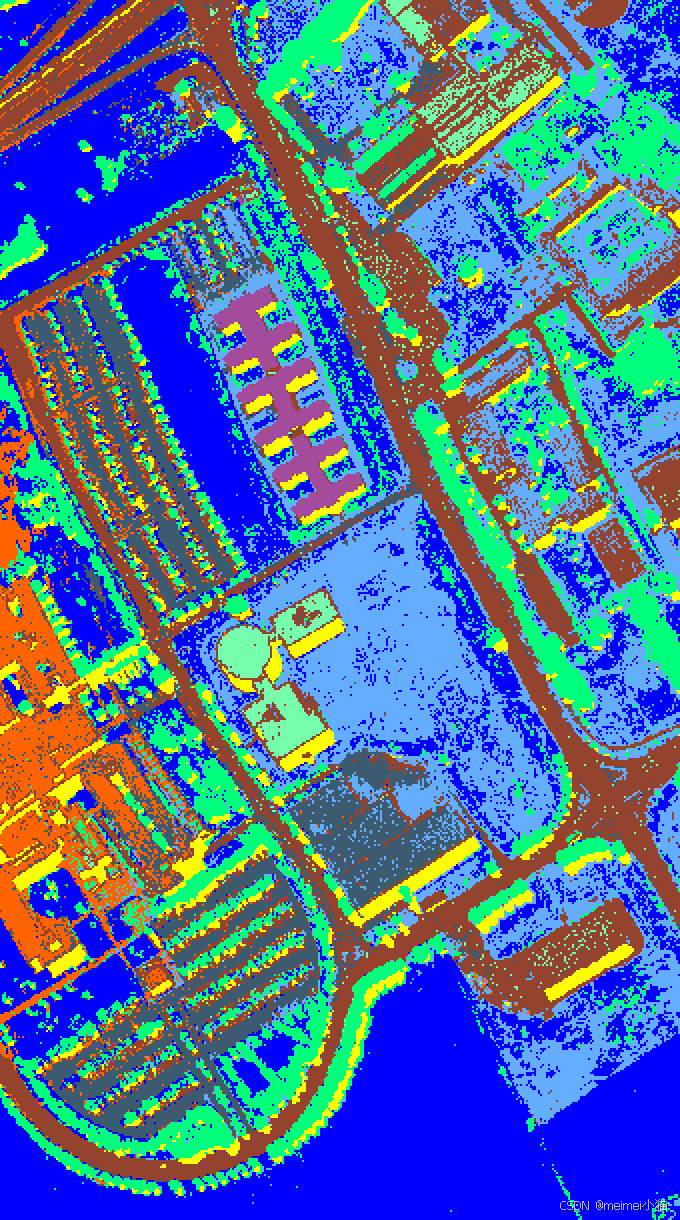
Pavia University_pred_1
Pavia University_pred_2
(4)调用代码
data = sio.loadmat('./data/Pavia University/PaviaU.mat')['paviaU']
labels = sio.loadmat('./data/Pavia University/PaviaU_gt.mat')['paviaU_gt']
3.Salinas
(1)数据集介绍
Salinas Dataset:The Salinas dataset was acquired by the Airborne Visible Infrared Imaging Spectrometer (AVIRIS) in the Salinas Valley, California, USA.The data size is 512 x 217 pixels, with 54,129 pixel samples labeled for training and testing purposes in HSI classification.The image was continuously imaged over 224 bands, from which 20 bands that could not be reflected by water were removed, leaving a total of 204 bands for analysis.
(2)类别介绍
| Salinas | ||
| No. | Class Name | Number |
| 1 | Broccoli 1 | 2009 |
| 2 | Broccoli 2 | 3726 |
| 3 | Fallow | 1976 |
| 4 | Rough Plow | 1394 |
| 5 | Smooth | 2678 |
| 6 | Stubble | 3959 |
| 7 | Celery | 3579 |
| 8 | Untrained Grapes | 11271 |
| 9 | Vineyard Soil | 6203 |
| 10 | Green Weeds | 3278 |
| 11 | Romaine 4wk | 1068 |
| 12 | Romaine 5wk | 1927 |
| 13 | Romaine 6wk | 916 |
| 14 | Romaine 7wk | 1070 |
| 15 | Untrained Vineyard | 7268 |
| 16 | Vertical Trellis | 1807 |
| Total | 54129 | |
(3)图像

Salinas_false color
Salinas_gt

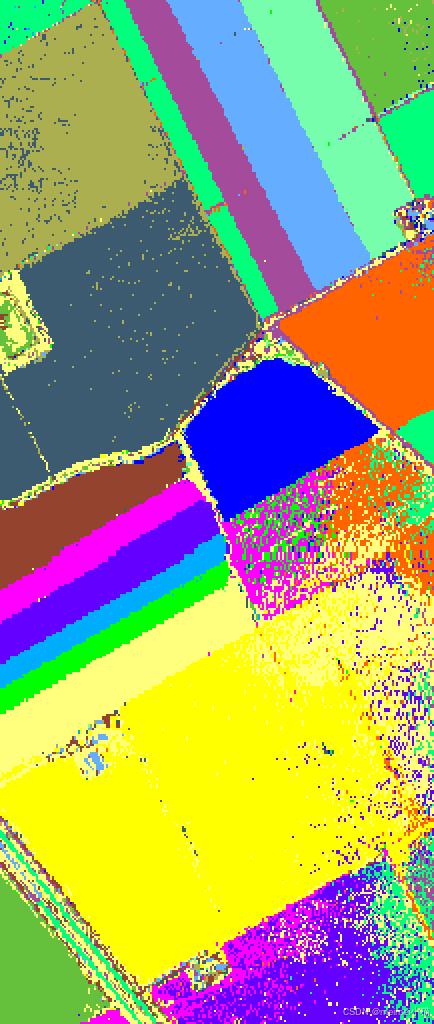
Salinas_pred_1
Salinas_pred_2
(4)调用代码
data = sio.loadmat('./data/Salinas/Salinas_corrected.mat')['salinas_corrected']
labels = sio.loadmat('./data/Salinas/Salinas_gt.mat')['salinas_gt']
4.Houston 2013
(1)数据集介绍
Houston 2013 Dataset:This scene was acquired by the ITRES CASI-1500 sensor over the campus of the University of Houston and its neighboring rural areas, and it was used in the 2013 GRSS Data Fusion Contest.The data comprises 144 spectral bands in the 380–1050 nm region and has dimensions of 349 × 1905 pixels with a spatial resolution of 2.5 m.
(2)类别介绍
| Houston 2013 | ||
| No. | Class Name | Number |
| 1 | Healthy grass | 1363 |
| 2 | Stressed grass | 1366 |
| 3 | Synthetic grass | 760 |
| 4 | Trees | 1355 |
| 5 | Soil | 1353 |
| 6 | Water | 354 |
| 7 | Residential | 1382 |
| 8 | Commercial | 1355 |
| 9 | Road | 1364 |
| 10 | Highway | 1337 |
| 11 | Railway | 1345 |
| 12 | Parking Lot 1 | 1343 |
| 13 | Parking Lot 2 | 511 |
| 14 | Tennis Court | 466 |
| 15 | Running Track | 719 |
| Total | 16373 | |
(3)图像

Houston 2013_false color
Houston 2013_gt

Houston 2013_pred_1
Houston 2013_pred_2
(4)调用代码
data = sio.loadmat('./data/Houston 2013/HustonU_IM.mat')['hustonu']
labels = sio.loadmat('./data/Houston 2013/HustonU_gt.mat')['hustonu_gt']
5.Houston 2018
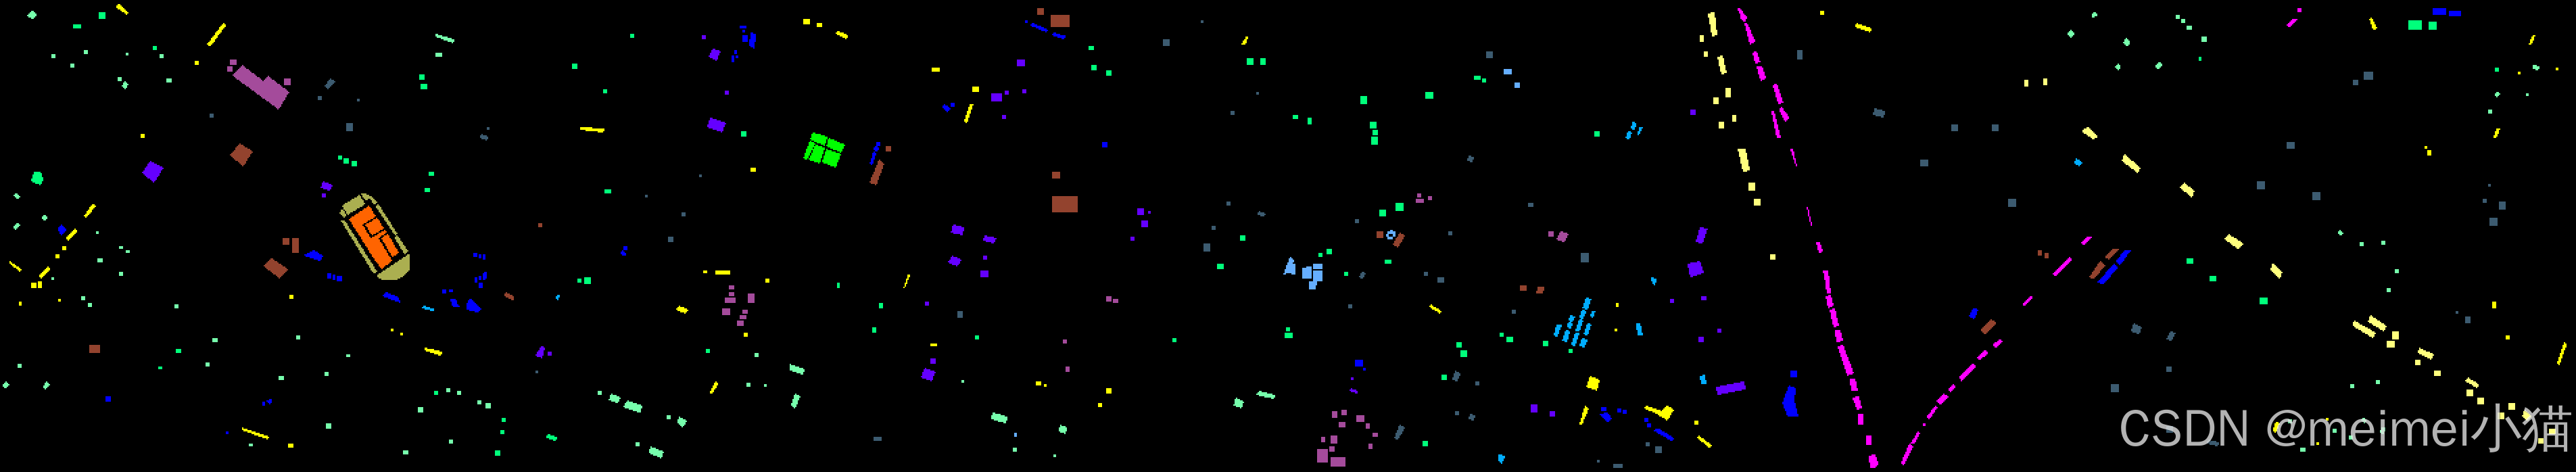
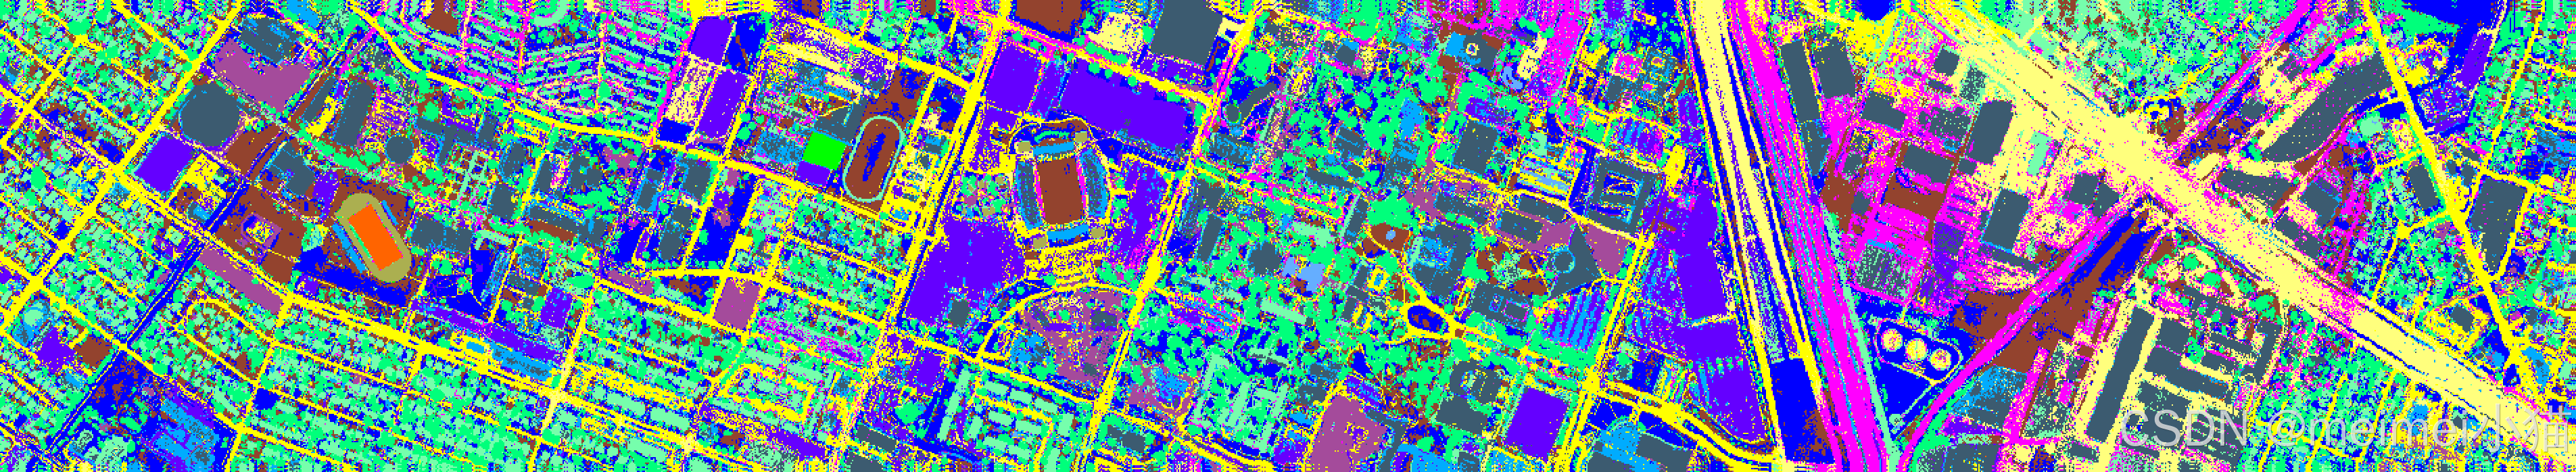
(1)数据集介绍
Houston 2018 Dataset:The Houston 2018 dataset was acquired by the Hyperspectral Image Analysis Group and the NSF-funded Airborne Laser Mapping Center (NCALM) at the University of Houston, covering the university campus and surrounding areas.The data size is 601 x 2384 pixels, with 504,856 pixel samples labeled for training and testing purposes in hyperspectral image classification.The wavelength range of the image data is from 0.38 to 1.05 μm, with a total of 50 bands.
(2)类别介绍
| Houston 2018 | ||
| No. | Class Name | Number |
| 1 | Healthy grass | 9799 |
| 2 | Stressed grass | 32502 |
| 3 | Synthetic grass | 684 |
| 4 | Evergreen trees | 13595 |
| 5 | Deciduous trees | 5021 |
| 6 | Soil | 4516 |
| 7 | Water | 266 |
| 8 | Residential buildings | 39772 |
| 9 | Non-residential buildings | 223752 |
| 10 | Roads | 45866 |
| 11 | Sidewalks | 34029 |
| 12 | Crosswalks | 1518 |
| 13 | Major thoroughfares | 46348 |
| 14 | Highways | 9865 |
| 15 | Railways | 6937 |
| 16 | Paved parking lots | 11500 |
| 17 | Unpaved parking lots | 146 |
| 18 | Cars | 6547 |
| 19 | Trains | 5369 |
| 20 | Stadium seats | 6824 |
| Total | 504856 | |
(3)图像
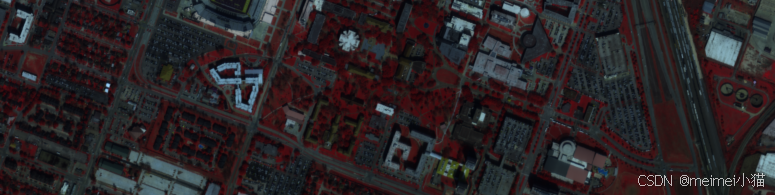
Houston 2018_false color
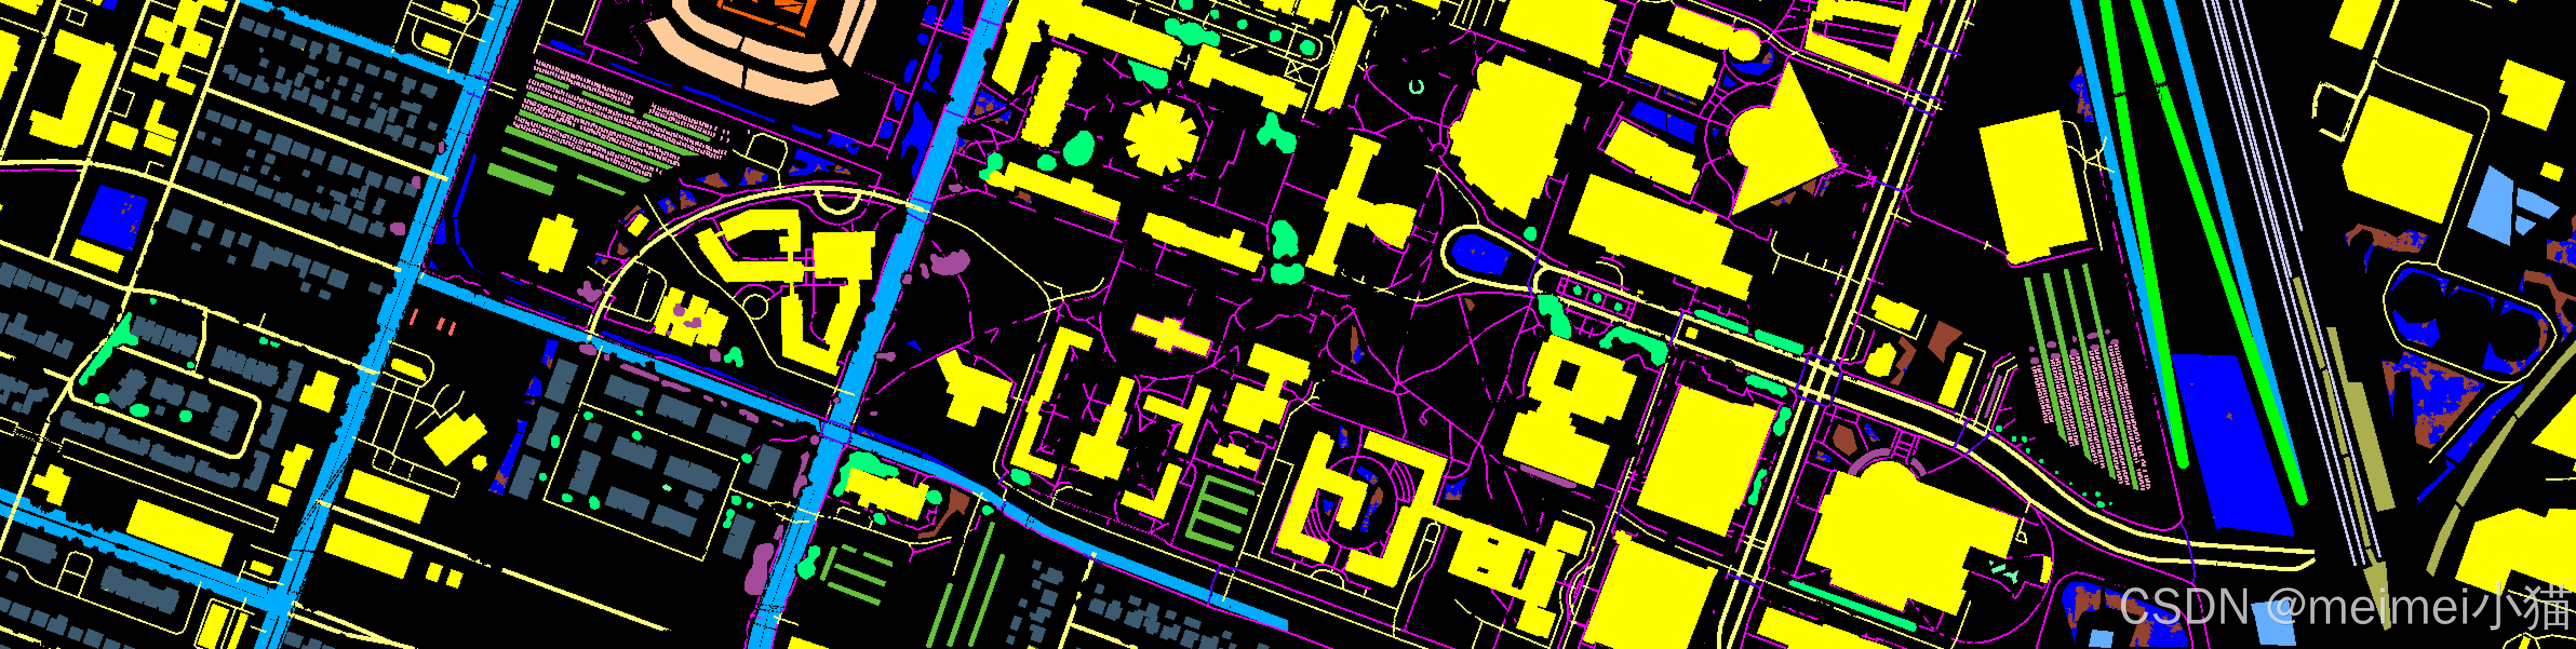
Houston 2018_gt

Houston 2018_pred_1
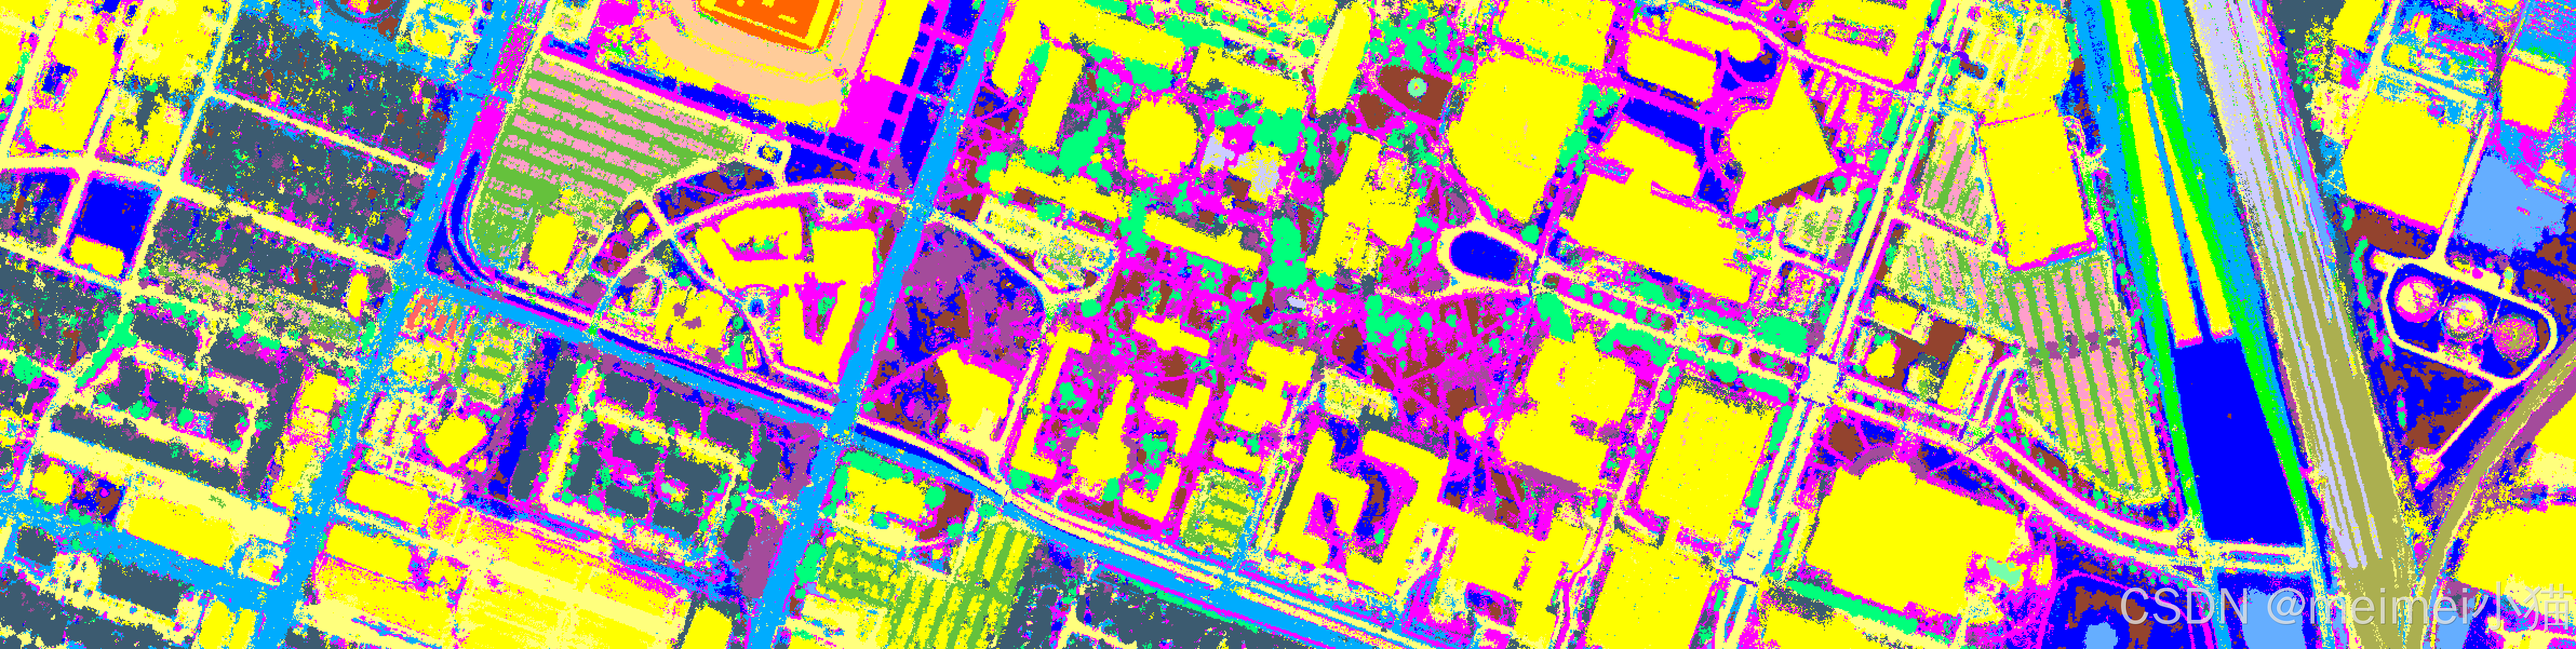
Houston 2018_pred_2
(4)调用代码
data = sio.loadmat('./data/Houston 2018/houstonU2018.mat')['houstonU']
labels = sio.loadmat('./data/Houston 2018/houstonU2018.mat')['houstonU_gt']


 2472
2472

 被折叠的 条评论
为什么被折叠?
被折叠的 条评论
为什么被折叠?
 到【灌水乐园】发言


