


r shiny取列数据

With the advent of data science and the increased need to analyze and interpret vast amounts of data, the R language has become ever more popular. However, there’s increasingly a need for a smooth interaction between statistical computing platforms and the web, given both 1) the need for a more interactive user interface in analyzing data, and 2) the increased role of the cloud in running such applications.
随着数据科学的到来以及对分析和解释大量数据的需求的增加,R语言变得越来越流行。 但是,鉴于以下两种情况,越来越需要统计计算平台与网络之间的顺畅交互:1)在分析数据时需要更具交互性的用户界面,以及2)云在运行此类应用程序中的作用越来越大。
Statisticians and web developers have thus seemed an unlikely mix till now, but make no mistake that the interactions between these two groups will continue to increase as the need for web-based platforms becomes ever more popular in the world of data science. In this regard, the interaction of the R and Shiny platforms is quickly becoming a cornerstone of interaction between the world of data and the web.
因此,到目前为止,统计人员和Web开发人员似乎不太可能混在一起,但是毫无疑问,随着基于Web平台的需求在数据科学领域变得越来越流行,这两个群体之间的互动将继续增加。 在这方面, R和Shiny平台的交互正Swift成为数据世界与Web交互的基石。
In this tutorial, we’ll look primarily at the commands used to build an application in Shiny — both on the UI (user interface) side and the server side. While familiarity with the R programming language is invariably helpful in creating a Shiny app, expert knowledge is not necessary, and this example will cover the building of a simple statistical graph in Shiny, along with some basic commands illustrating how to customize the web page through HTML.
在本教程中,我们将主要研究用于在Shiny中构建应用程序的命令-在UI(用户界面)端和服务器端。 尽管熟悉R编程语言在创建Shiny应用程序中总是有帮助的,但并非必需具备专业知识,并且此示例将涵盖在Shiny中构建简单的统计图,以及一些基本命令,说明如何通过以下方式自定义网页HTML。
安装和加载闪亮的Web应用程序 (Installing and Loading Shiny Web Apps)
To start off, we must first install the RStudio platform in order to create and run a Shiny Web App. RStudio can be downloaded from the RStudio website.
首先,我们必须首先安装RStudio平台才能创建和运行Shiny Web App。 可以从RStudio网站下载RStudio 。
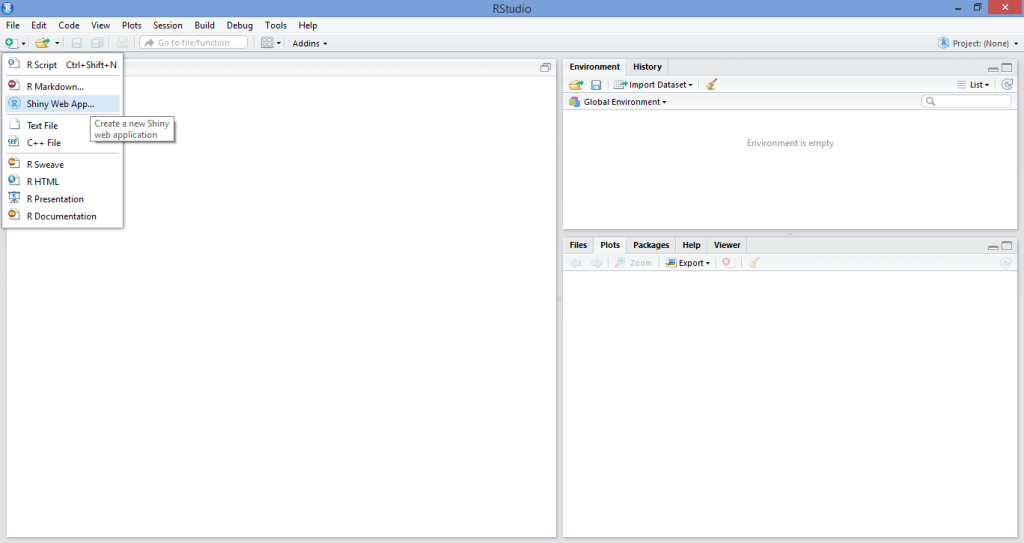
Once we’ve loaded the RStudio platform, we then create our new Shiny web application by selecting the New File option, and then the Shiny Web App… option.
加载RStudio平台后,我们依次选择“ 新建文件”选项和“ Shiny Web App…”选项来创建新的Shiny Web应用程序。
Upon doing that, we’re presented with an interface that allows us to name our application (I’ve named it “OurFirstApp”, but feel free to come up with other creative names!), and we then select Multiple File (ui.R/server.R) as our application type:
完成此操作后,我们将看到一个界面,该界面使我们能够命名应用程序(我将其命名为“ OurFirstApp”,但随时可以使用其他广告素材名称!),然后选择“ 多个文件”(ui。 R / server.R)作为我们的应用程序类型:
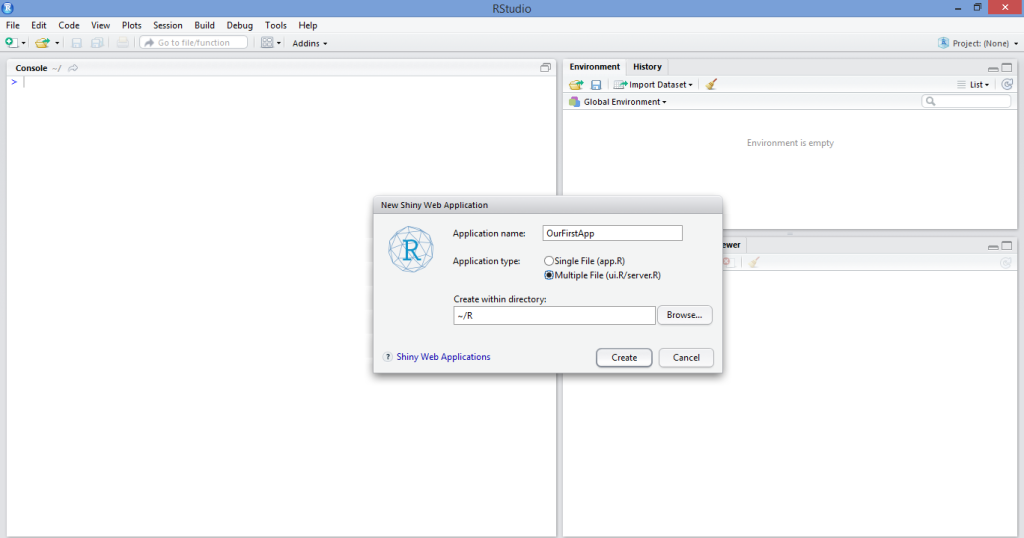
While we could select Single File (app.R), this literally just combines the ui.R and server.R scripts into one. I personally prefer to keep the two separate in order to keep the code less cluttered, but this is a matter of personal preference.
虽然我们可以选择Single File(app.R) ,但实际上这只是将ui.R和server.R脚本组合为一个。 我个人更喜欢将两者分开,以使代码不那么混乱,但这是个人喜好问题。
As a side note, there’s also a web platform available on the Shinyapps site, which allows users to share their Shiny applications online, as well as use the rsconnect package to control such applications remotely from the R console. While the methodology for doing this is outside the scope of this article, I definitely intend on expanding this topic further in subsequent articles given interest.
附带说明一下, Shinyapps网站上还有一个Web平台可用,它允许用户在线共享其Shiny应用程序,以及使用rsconnect包从R控制台远程控制此类应用程序。 尽管执行此方法的方法不在本文的讨论范围之内,但我绝对打算在感兴趣的后续文章中进一步扩展此主题。
In any case, once we have named our Shiny Web App and opened up the source code, we’re presented with a template app that uses a dataset “Old Faithful Geyser Data” to generate a histogram. For the purposes of this tutorial, we’ll be writing our own app and customizing it according to our needs.
无论如何,一旦我们命名了Shiny Web App并打开了源代码,我们就会看到一个模板应用程序,该应用程序使用数据集“ Old Faithful Geyser Data”生成直方图。 就本教程而言,我们将编写自己的应用程序,并根据需要对其进行自定义。
运行应用程序 (Running the Application)
As already stated, the primary components of a Shiny Web App are the user interface side (ui.R) and the server side (server.R).
如前所述,Shiny Web App的主要组件是用户界面端( ui.R )和服务器端( server.R )。
For this particular app, we’re going to create a simple line graph with a plot of N observations on the x-axis and probability of occurrence on the y-axis. Essentially, this app creates a slider allowing us to select a value (N) between 1–50. N can be thought of as the number of trials, i.e. if a value of 2 is selected, then 2 trials equal a probability of 100 percent. On the other hand, if a value of 50 is selected, then 50 trials must be conducted for the probability of occurrence to equal 100 percent. On a graph where N = 50, then sliding back down to N = 25 would correspond to a 50 percent probability, and the graph updates to reflect this automatically. Note that this is somewhat of an overly simplistic example mathematically, but is merely being used to illustrate how reactivity works in the context of graph generation across the Shiny platform.
对于这个特定的应用程序,我们将创建一个简单的折线图,在x轴上绘制N观察值,在y轴上绘制出现的概率。 本质上,此应用程序会创建一个滑块,使我们可以在1–50之间选择一个值(N)。 N可以认为是试验次数,即,如果选择值为2,则2次试验等于100%的概率。 另一方面,如果选择的值为50,则必须进行50次试验,以使发生概率等于100%。 在N = 50的图上,然后向下滑动到N = 25将对应于50%的概率,并且该图会更新以自动反映这一点。 请注意,这在数学上有点过于简单化,但是仅用于说明在Shiny平台上生成图形的情况下,React性如何工作。
While the below code will ultimately be modified slightly to allow for greater customization using HTML, it’s the code used to create both the ui.R and server.R files:
尽管下面的代码最终将稍作修改,以允许使用HTML进行更大的自定义,但它是用于创建ui.R和server.R文件的代码:
ui.R
用户界面
#Call the “shiny” library
library(shiny)

#Define the UI for application that draws a probability plot
shinyUI(fluidPage(

  #Name the Title of the applicationh
  titlePanel("Probability Plots"),

  #Create a sidebar with a slider input for number of trials
  sidebarLayout(
    sidebarPanel(
       sliderInput("lambda",
                "Number of trials:",
                min = 1,
                max = 50,
                value = 1)
  ),

    #Show a plot of the generated probability plot
    mainPanel(
       plotOutput("ProbPlot")
    )
  )
))
server.R
服务器
#Define the “shiny”, “ggplot2” and “scales” libraries
library(shiny)
library(ggplot2)
library(scales)
#Shiny Application
shinyServer(function(input, output) {
#Create a reactive expression
output$ProbPlot <- renderPlot({
#Generate lambda value based on input$lambda from ui.R
n=1:100
lambda <- seq(min(n), max(n), length.out = input$lambda)
probability=lambda
#Generate the probability plot
plot(probability, type = "o", col = 'blue', border = 'white', xlab="N (Number of Observations)", ylab ="Probability of occurrence")
})
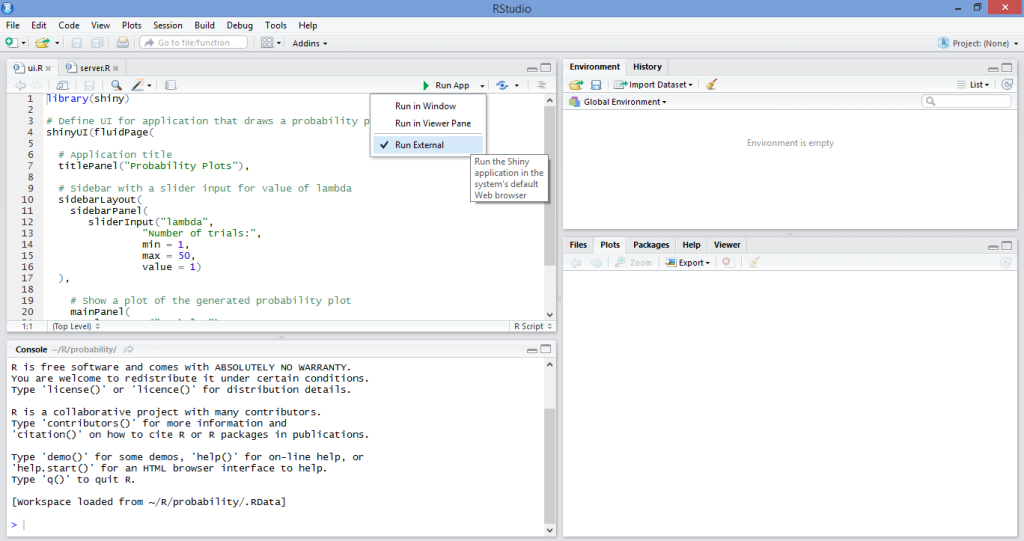
})We then run our application by selecting the Run External option as below, and then selecting Run App:
然后,我们通过选择如下所示的“运行外部”选项来运行我们的应用程序,然后选择“运行应用程序” :
Once we run our application, we observe that the graph then updates automatically, allowing us to visually analyze on a line graph the relationship between N and probability of occurrence depending on the number of trials we’ve selected:
一旦运行我们的应用程序,我们就会观察到该图会自动更新,从而使我们能够根据所选择的试验次数直观地分析线形图上N与发生概率之间的关系:
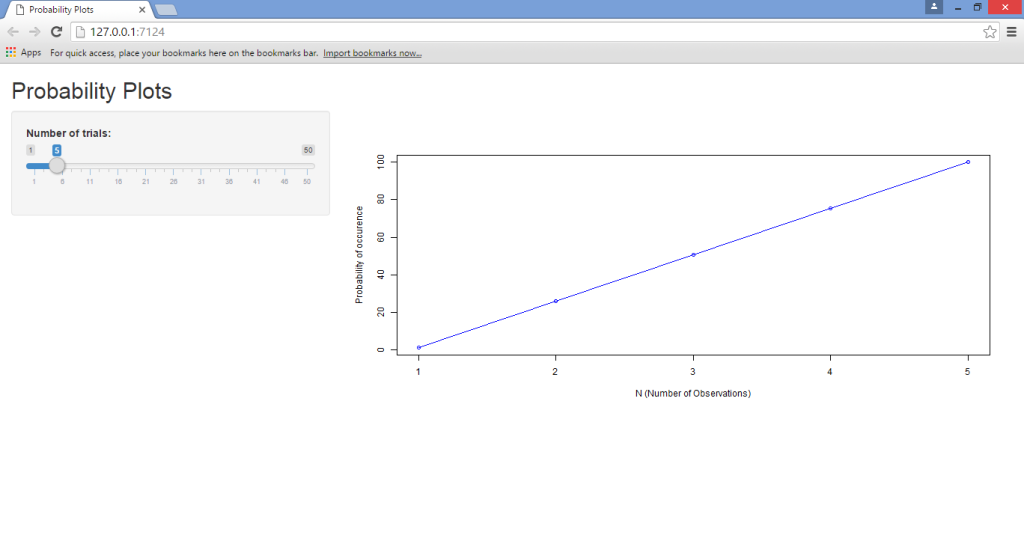
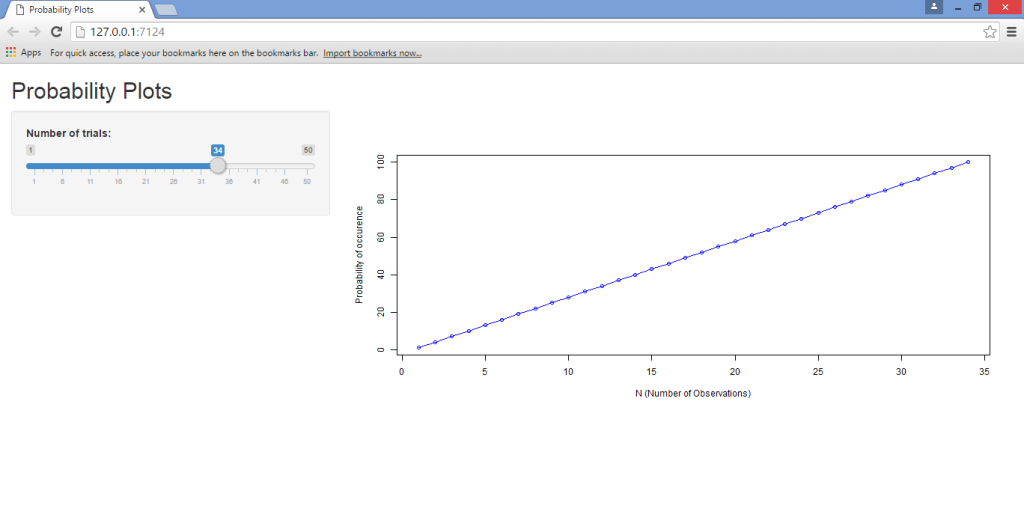
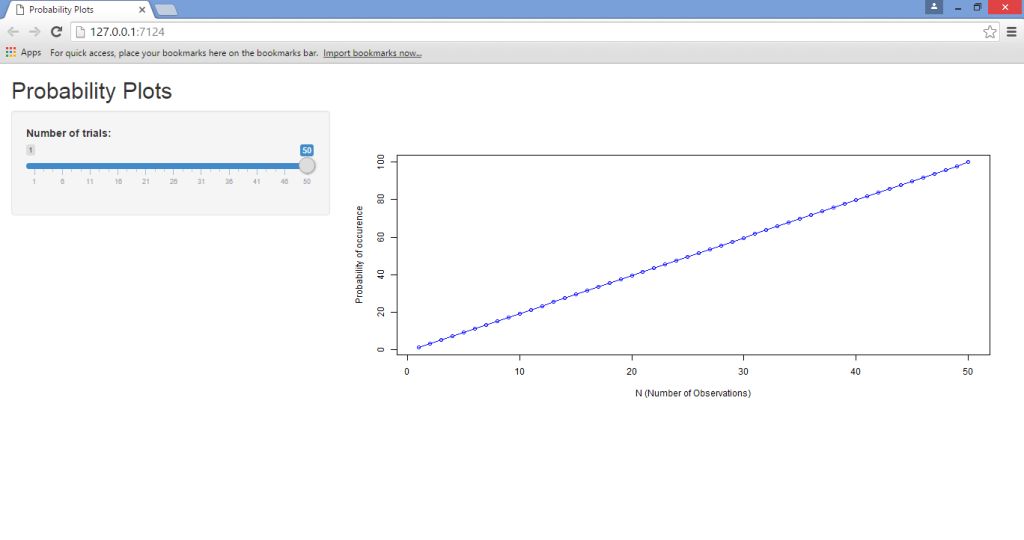
As we can see, running this app through Shiny has made it much more user-friendly, in that the slider allows for instantaneous manipulation and observation of the results. This is known as a reactive expression, where the values of one variable automatically update given changes in another. Had we chosen to run this program using R solely, then we would need to type a new value for N into the source code each time we wish to run the program, and this is ultimately very monotonous and inefficient — especially for users who don’t already have R language knowledge.
如我们所见,通过Shiny运行此应用程序使其变得更加用户友好,因为滑块允许即时操作和观察结果。 这称为React式表达式 ,其中一个变量的值会自动更新另一个变量的给定值。 如果我们选择仅使用R运行该程序,那么每次我们希望运行该程序时,都需要在源代码中键入N的新值,这最终会非常单调且效率低下-特别是对于那些不愿意使用R的用户而言已经具备R语言知识。
Some points to note from the above scripts:
上述脚本中的一些注意事项:
The
sidebarLayoutfunction is what allows us to create the sliding sidebar that enables us to input a specific value for the number of trials. We’re defining this by means of themin(minimum value),max(maximum value), andvalue(which is the number of values between each value in the series).sidebarLayout函数使我们能够创建滑动侧栏,从而使我们能够输入试验次数的特定值。 我们通过min(最小值),max(最大值)和value(它是序列中每个值之间的值数)来定义它。Note that, in the
server.Rscript, the code includes both the ggplot2 and scales libraries. When running the program yourself, you will notice that these two libraries are not strictly required to run this particular application. However, I have included them as the ggplot2 library is of great use when running more sophisticated graphs, while the scales library allows for greater customization of graph data that requires different scaling methods across a range of axes or legends.请注意,在
server.R脚本中,该代码同时包含ggplot2和scales库。 当您自己运行程序时,您会注意到,运行此特定应用程序并非严格要求这两个库。 但是,我将它们包括在内是因为ggplot2库在运行更复杂的图形时非常有用,而scales库则允许对图形数据进行更大程度的自定义,这需要跨一系列轴或图例使用不同的缩放方法。Moreover, we see that when we generate a lambda value (for the second-last command of the
server.Rscript), we do so by making the variable a function of the minimum and maximum value ofn, which we have defined as 1 to 100. This is where we define the interaction betweennand our probability function (known as lambda), which in turn gives rise to a reactive expression:此外,我们看到当生成lambda值时(对于
server.R脚本的倒数第二个命令),我们通过使变量成为n的最小值和最大值的函数来实现,我们将其定义为1到100。这是我们定义n和我们的概率函数(称为lambda)之间的相互作用的地方,后者又引起一个React式:
#Generate lambda value based on input$lambda from ui.R
  n=1:100
  lambda <- seq(min(n), max(n), length.out = input$lambda)
  probability=lambda
HTML自定义 (HTML Customization)
As seen above, we created an application that is able to use a reactive expression in updating a line graph and its axes instantaneously. However, given that we are creating a web page with the application after all, suppose that we wish to update the page design using HTML?
如上所示,我们创建了一个应用程序,该应用程序可以使用React式表达式即时更新线图及其轴。 但是,考虑到我们毕竟要使用该应用程序创建网页,假设我们希望使用HTML更新页面设计?
The HTML editing that we’ll perform here is, in itself, quite basic. For this tutorial, we’ll simply concentrate on how to edit the titles of the web page in terms of font and color. However, the purpose behind this is to illustrate specifically how to edit the user interface code in R to be able to customize the web page, which is the main takeaway for this tutorial. This involves a slight modification of the ui.R file that we generated above to allow for HTML inserts.
我们将在此处执行HTML编辑本身是非常基本的。 在本教程中,我们将仅着眼于如何根据字体和颜色编辑网页标题。 但是,这样做的目的是为了具体说明如何在R中编辑用户界面代码以能够自定义网页,这是本教程的主要内容。 这涉及对我们上面生成的ui.R文件的略微修改,以允许HTML插入。
One of the most important things to note is that we are only modifying our ui.R file — the server.R file remains the same as above. This is clearly because HTML is being used for the purposes of modifying the user interface; it’s not being used to modify the parameters of the application itself.
需要注意的最重要的事情之一是,我们只修改了ui.R文件server.R文件与上面相同。 显然,这是因为HTML用于修改用户界面。 它没有被用来修改应用程序本身的参数。
(The template that I’m using to edit the headings of the web page in this instance is based on Chris Beeley’s Second Edition of Web Application Development with R Using Shiny. I have personally found it to be a great guide, and highly recommend it to anyone looking to increase their knowledge of R/Shiny programming and web platforms.)
(本例中,我用来编辑网页标题的模板基于Chris Beeley的第二版Web应用程序开发,其中包含R Using Shiny 。我个人认为它是一个很好的指南,强烈推荐它希望增加他们对R / Shiny编程和Web平台的了解的人。)
The modified ui.R program that we use to construct the updated web page is as follows:
我们用来构建更新的网页的经过修改的ui.R程序如下:
ui.R
用户界面
#Call the “shiny” library
library(shiny)
# Define UI for application that draws a probability plot
shinyUI(fluidPage(
tags$head(HTML("<link href='http://fonts.googleapis.com/css?family=Jura' rel='stylesheet' type = 'text/css'>")),
h2("Probability Plots", style = "font-family: 'Jura'; color: red; font-size: 64px;"),
# Application title
#titlePanel("Probability Plots"),
# Sidebar with a slider input for value of lambda
sidebarLayout(
sidebarPanel(
sliderInput("lambda",
"Number of trials:",
min = 1,
max = 50,
value = 1)
),
# Show a plot of the generated probability plot
mainPanel(
h3("Probability Graph", style = "font-family: 'Jura'; color: blue; font-size: 32px;"),
HTML("<p>Probability readings</p>"),
plotOutput("ProbPlot")
)
)
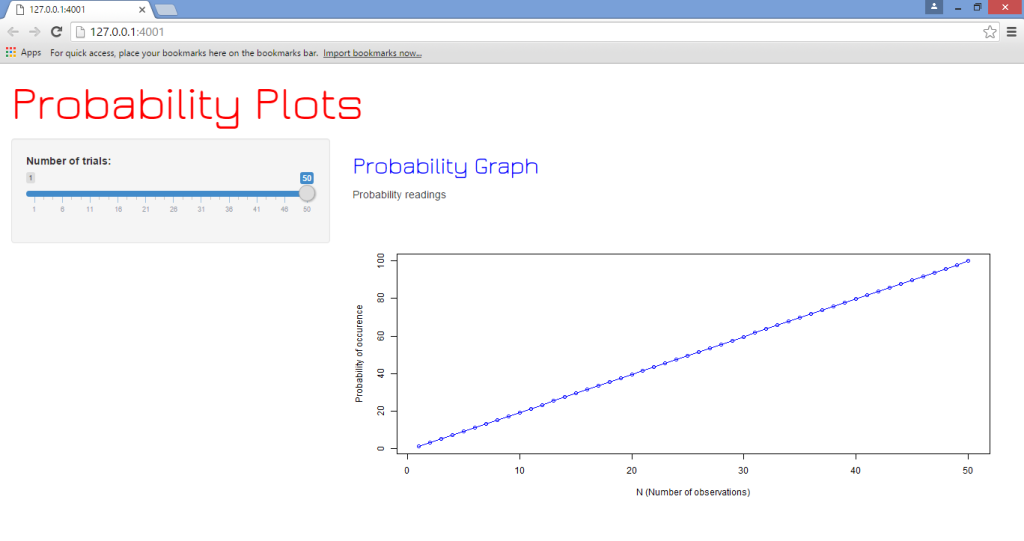
))In looking at the difference between this ui.R script and that of the previous one, we note that we’re adding to the shinyUI(fluidPage) command by defining Google Fonts as the font family using the tags$head command. Moreover, we use the h2 heading to define the “Probability Plots” heading for the page itself, and subsequently the h3 heading to define the “Probability Graph” for the graph we have plotted.
在查看此ui.R脚本与上一个脚本之间的区别时,我们注意到我们通过使用tags$head命令将Google字体定义为字体系列,从而添加到了shinyUI(fluidPage)命令。 此外,我们使用h2标题来定义页面本身的“概率图”标题,然后使用h3标题来定义我们所绘制的图的“概率图”。
Once we run the above code in conjunction with the server.R script, we generate the following graph (along with the same slider selection and reactivity as we observed previously):
一旦将以上代码与server.R脚本一起运行,我们将生成以下图形(以及与前面观察到的相同的滑块选择和React性):
结论 (Conclusion)
In this tutorial, we’ve covered:
在本教程中,我们介绍了:
- The procedures to install RStudio and load a Shiny Web App in R 在R中安装RStudio和加载Shiny Web App的过程
- How to create a plot in Shiny and form reactive expressions 如何在Shiny中创建图并形成React式
- Using HTML to customize Shiny webpages. 使用HTML自定义有光泽的网页。
Needless to say, this application is merely touching the tip of the iceberg in terms of Shiny’s many capabilities with the R platform.
不用说,就Shiny R平台的众多功能而言,此应用程序仅触及冰山一角。
Moreover, Shiny can also be used with other languages such as JavaScript in customizing the user interface of the respective web pages being loaded by the application. However, the above tutorial serves to act as a baseline in developing and running Shiny applications.
此外,Shiny还可以与其他语言(例如JavaScript)一起使用,以自定义由应用程序加载的各个网页的用户界面。 但是,以上教程可作为开发和运行Shiny应用程序的基准。
I hope this tutorial has been helpful and of interest to you. Let us know what you think in the comments below, and tell us if there are any other Shiny and R topics you’d like us to cover.
希望本教程对您有所帮助并引起您的兴趣。 让我们知道您在以下评论中的想法,并告诉我们您是否希望涵盖其他Shiny和R主题。
翻译自: https://www.sitepoint.com/shiny-r-and-html-merging-data-science-and-web-development/
r shiny取列数据


 475
475

 被折叠的 条评论
为什么被折叠?
被折叠的 条评论
为什么被折叠?
 到【灌水乐园】发言


