


数据透视表 缺失值
As you know, pivot tables are a quick and easy way to summarize a huge table of data in Excel. With just a few clicks, you can create totals for thousands of rows of data, without writing a single formula. Then, with filters and Slicers, zero in on specific parts of the data. But there's an underused feature that you might be missing – do you know how to compare pivot table values as percentages?
如您所知,数据透视表是在Excel中汇总大量数据表的快速简便方法。 只需单击几下,您就可以为数千行数据创建总计,而无需编写单个公式。 然后,使用过滤器和切片器,将数据的特定部分归零。 但是您可能会缺少一个未充分利用的功能-您知道如何将数据透视表值作为百分比进行比较吗?
认识Karine Lago (Meet Karine Lago)
Karine Lago is an Excel MVP from Brazil, and you can see her work on her YouTube channel, and her Excel blog – both are in Portuguese. Karine has posted almost 100 YouTube videos since 2013, and she covers Excel, VBA and Power BI topics.
Karine Lago是来自巴西的Excel MVP,您可以在她的YouTube频道和她的Excel博客上看到她的工作-都是葡萄牙语。 自2013年以来,Karine已发布了近100个YouTube视频,涵盖了Excel,VBA和Power BI主题。
Recently, Karine invited me to do a guest video her YouTube channel. As a topic, I suggested "How to compare Pivot Table values as percentages", and Karine thought that would be a good fit for her audience.
最近,Karine邀请我在她的YouTube频道上做客座视频。 作为一个主题,我建议“如何比较数据透视表值的百分比”,Karine认为这很适合她的听众。
I don't speak Portuguese, so I recorded in English. Later, Karine added an introduction, and closed captions with the translation. You can see the final result below. Thanks, Karine – it was a pleasure to work with you!
我不会说葡萄牙语,所以我用英语录制。 后来,卡琳(Karine)添加了简介,并为翻译加上了字幕。 您可以在下面看到最终结果。 谢谢,Karine –很高兴与您合作!
在数据透视表中显示值 (Show Values in Pivot Tables)
Before you watch the video, here's a little bit about the topic.
在观看视频之前,这里有一些有关该主题的内容。
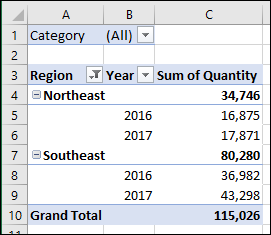
Most pivot tables show a sum of the numbers from the raw data – that's the default setting when you add a number field to the pivot table.
大多数数据透视表显示原始数据中数字的总和-这是在数字表中添加数字字段时的默认设置。
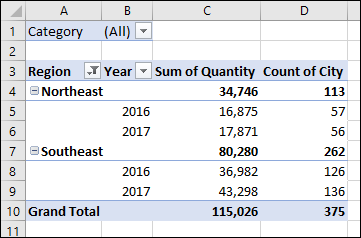
Or, if you add a field with text in the Values area, Excel automatically shows a count of the items in each total. And no, there isn't any way to change the default calculation, so it always uses SUM.
或者,如果您在“值”区域中添加带有文本的字段,Excel会自动显示每个总计中的项目计数。 不, 没有任何方法可以更改默认计算,因此它始终使用SUM。
更改百分比 (Change to Percentages)
Instead of leaving the numbers as the default, you can change them, to make it easier to compare the values in the pivot table.
您可以更改它们,而不是将这些数字保留为默认值,以便更轻松地比较数据透视表中的值。
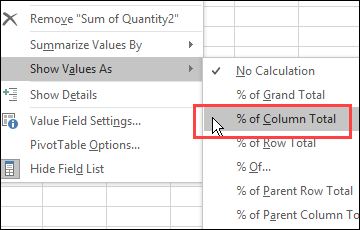
For example, in the pivot table below, I added a second copy of the Quantity field. Then, I right-clicked on a number in that new column, clicked Show Values As, and selected % of Column Total.
例如,在下面的数据透视表中,我添加了“数量”字段的第二个副本。 然后,我右键单击该新列中的数字,单击“显示为”,然后选择“ 占列总数的百分比” 。
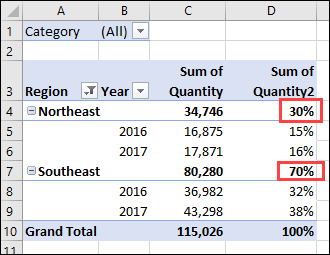
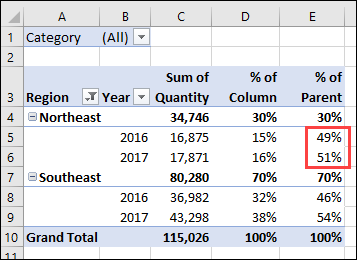
The new column shows the percentage that was sold in each region, in each year, compared to the overall total quantity. I formatted the column with zero decimal places, so it's easier to read.
新列显示了每年每个地区在总销量中所占的百分比。 我将列的格式设置为零位小数,因此更易于阅读。
Now, instead of trying to mentally compare the large numbers in the region subtotals (34,746 and 80,280), you can quickly see that 70% of the quantity was sold in the Southeast region, and only 30% in the Northeast.
现在,您无需试图从心理上比较该区域小计(34,746和80,280)中的大量数字,而是可以很快地看到70%的数量在东南地区出售,而仅30%在东北地区出售。
将值显示为的更多选项 (More Options for Show Values As)
There are many other options in the Show Values As list, including % of Parent settings. The Parent options let you compare items within a subtotal, such as Region.
“将值显示为”列表中还有许多其他选项,包括“父项”设置的百分比 。 父选项可让您比较小计内的项目,例如“地区”。
NOTE: The Parent options were added in Excel 2010, when "Show Values As" was added to the right-click menu.
注意:在“将值显示为”添加到右键单击菜单时,在Excel 2010中添加了“父级”选项。
In the next screen shot, I've added a third copy of the Quantity field, and set it to show % of Parent Row Total. In the % of Parent column, you can see that 51% of the Northeast sales were in 2017, compared to 49% in 2016.
在下一个屏幕截图中,我添加了“数量”字段的第三个副本,并将其设置为显示“父行总计”的% 。 在父级百分比列中,您可以看到2017年东北地区销售额的51%,而2016年为49%。
In the video, I also show how to add a column with % of Parent Total. That option is a little different from the others – you can select a specific Row field, and compare all the values within that field item.
在视频中,我还演示了如何添加具有“父级总计”百分比的列。 该选项与其他选项略有不同–您可以选择特定的“行”字段,然后比较该字段项中的所有值。
观看视频 (Watch the Video)
Here is our video that shows how to compare pivot table values as percentages. You'll see the steps for building the basic pivot table, then three ways to compare the values –
这是我们的视频,显示了如何比较数据透视表值的百分比。 您将看到构建基本数据透视表的步骤,然后是三种比较值的方法–
- % of Column 列百分比
- % of Parent Row 父行的百分比
- % of Parent Total 占父母总数的百分比
Karine does an introduction in Portuguese, then an English intro at the 2:24 mark, and my tutorial starts at the 2:55 mark.
Karine用葡萄牙语进行了介绍,然后在2:24进行了英语介绍,而我的教程则在2:55进行了介绍。
翻译自: https://contexturesblog.com/archives/2017/09/21/compare-pivot-table-values-as-percentages/
数据透视表 缺失值


 770
770

 被折叠的 条评论
为什么被折叠?
被折叠的 条评论
为什么被折叠?
 到【灌水乐园】发言


