


excel禁用宏的格式
If you need to know what color is in a worksheet cell, or a shape, you can check it manually, or use VBA code to find the color number. There are conditional formatting color macros too, but they're a bigger challenge, and didn't work for a project that I built recently. Here's what I was working on, and some of the Excel color resources that I used along the way. There are links to download my sample file, and one from Visio MVP, John Marshall.
如果您需要知道工作表单元格或形状中的颜色,则可以手动检查它,或使用VBA代码查找颜色编号。 也有条件格式的颜色宏,但是它们是一个更大的挑战,并且不适用于我最近构建的项目。 这是我的工作,以及我在此过程中使用的一些Excel颜色资源。 有链接下载我的示例文件,其中一个链接来自Visio MVP John Marshall。
条件格式颜色图表 (Conditional Formatting Color Chart)
Someone asked if it was possible to use conditional formatting in an Excel pie chart. They had found formulas to add conditional formatting in a column chart, but that didn't do what they needed. In this case, the data had two different amounts – the total orders, and the total amount that had been invoiced. From those amounts, the Percent Invoiced had been calculated. The pie chart needed to show
有人问是否可以在Excel饼图中使用条件格式。 他们已经找到了在柱形图中添加条件格式的公式,但这并没有满足他们的需要。 在这种情况下,数据有两个不同的金额–总订单和已开具发票的总金额。 从这些金额中,已计算出发票百分比。 需要显示的饼图
- slice size based on the order amount 切片大小基于订单金额
- slice colour based on a colour scale for the % invoiced 根据发票百分比的色标确定切片颜色
That sounded like an interesting challenge, so I decided to tackle it.
这听起来像是一个有趣的挑战,所以我决定去解决它。
样本数据 (Sample Data)
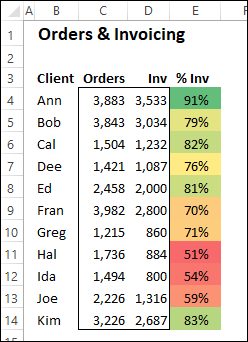
- To investigate the problem, I created a small data set, similar to what the email had described. The first column had client names 为了调查问题,我创建了一个小的数据集,类似于电子邮件中描述的那样。 第一列有客户名称
- Second column showed total order amount 第二栏显示总订单金额
- Third column had the total amount invoiced 第三栏已开具发票总额
- Final column calculated the percent invoiced 最后一栏计算了发票的百分比
- There was color scale (Green-Yellow-Red) on the % Invoiced column %发票列上有色标(绿-黄-红)
Here's a screen shot of my sample. It has 11 Client names – the same number that the email question had used.
这是我的样本的屏幕截图。 它有11个客户名称-与电子邮件问题所使用的名称相同。
- The highest % Invoiced cell is for Ann – it's dark green, because that's a good value. 发票百分比最高的单元格是Ann –呈深绿色,因为这是一个很好的价值。
- The lowest % Invoiced is for Hal, and it's dark red, because that's a bad thing! 发票的最低百分比是Hal,它是深红色的,因为这是一件坏事!
图表颜色 (Chart Colours)
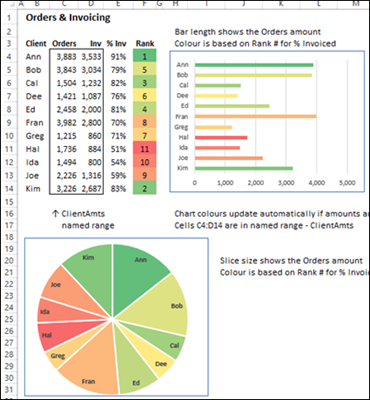
Here's what the completed chart should look like.
这是完成的图表的外观。
- Ann and Bob have large slices, and they're both colored green, so their invoicing percentage is good. Ann和Bob切成薄片,并且都被涂成绿色,因此开票率很高。
- Hal and Ida have small slices, but they're colored red, so the invoicing has fallen behind for those clients. 哈尔(Hal)和艾达(Ida)的食物很薄,但是它们的颜色是红色的,因此这些客户的发票已经落后了。
- Fran has one of the largest slices, and it's colored orange, so that account should be checked soon! Fran是最大的一块,它的颜色为橙色,因此应尽快检查该帐户!
But, how can we get those colors into the chart?
但是,如何将这些颜色放入图表中?
获取色标颜色 (Get the Color Scale Colors)
If you manually check the color for one of those % Invoiced cells, it shows "No Fill", because the color comes from conditional formatting. A Google search found lots of macros that returned the fill color, but only a few that promised to return a conditional formatting color. And none of those worked for me.
如果您手动检查那些“已开具发票的百分比”单元格之一的颜色,它会显示“ No Fill”,因为该颜色来自条件格式。 Google搜索发现许多宏返回了填充颜色,但是只有少数几个承诺返回条件格式的颜色。 这些都不对我有用。
Chip Pearson has code for conditional formatting colors, but it doesn't seem to work in newer versions of Excel
Chip Pearson拥有用于条件格式颜色的代码,但在新版本的Excel中似乎不起作用
Rick Rothstein has a macro to get the conditional formatting colour (comment #5), but that didn't work with my colour scale
Rick Rothstein有一个宏可以获取条件格式的颜色 (注释#5),但这不适用于我的色标
Update: Thanks to Andy Pope, who gave me the property that I needed to get the Conditional Formatting color -- DisplayFormat. I've changed the macro to use that property.
更新 :感谢Andy Pope ,他为我提供了获得条件格式设置颜色DisplayDisplay所需的属性。 我已经更改了宏以使用该属性。
我笨拙的解决方法 (My Clunky Workaround)
Because I couldn't get the conditional formatting colors (before Andy Pope's tip), I used a clunky workaround. It involved a second sheet with a color list, with the cells filled with colors from the color scale. The painful steps are described below, but you can skip reading this, and go straight to the macro.
由于无法获得条件格式的颜色(在Andy Pope提出建议之前),因此我使用了笨拙的解决方法。 它涉及带有颜色列表的第二张工作表,其中的单元格填充了色标中的颜色。 痛苦的步骤如下所述,但是您可以跳过阅读, 直接进入宏 。
获取色标 (Get the Color Scale)
The sample data has 11 clients listed, so the chart needed to match a color scale of that size.
该示例数据列出了11个客户端,因此该图表需要匹配该大小的色标。
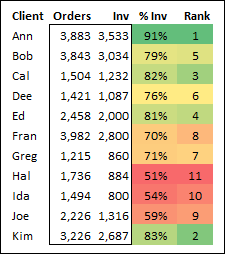
- First, I added a ranking column in the sample data, to calculate the rank for each % Invoiced amount. 首先,我在示例数据中添加了一个排名列,以计算每个%发票金额的排名。
- Next, I added a Red – Yellow – Green color scale formatting to the Rank column cells. 接下来,我向“等级”列单元格添加了“红色–黄色–绿色”色阶格式。
As you can see, the colors are slightly different, because the percentages aren't equally distributed, like the numbers 1 to 11 are. So, I removed the conditional formatting from the % Invoiced column, and decided to use the colours for 1 to 11.
如您所见,颜色略有不同,因为百分比不是均匀分布的,就像数字1到11一样。 因此,我从%发票列中删除了条件格式,并决定将颜色用于1到11。
颜色清单 (The Color List)
Next, I created a Color List
接下来,我创建了一个颜色列表
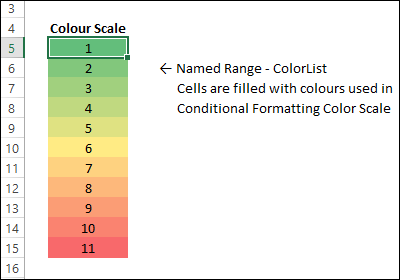
- On a "Colours" sheet in the workbook, I typed a list of numbers, from 1 to 11. 在工作簿的“颜色”表上,我键入了一个数字列表,从1到11。
- Then, I applied a Red – Yellow – Green conditional formatting color scale to those cells. 然后,我对这些单元格应用了Red – Yellow – Green条件格式颜色刻度。
- That list was named, as ColorList 该列表被命名为ColorList
- Next, I needed to find out what those colors were, so I could use then in the chart. 接下来,我需要找出那些颜色是什么,以便可以在图表中使用它们。
And that's when the fun began.
就是从那时开始的乐趣。
色彩解决方法 (The Color Workaround)
Since I couldn't get the conditional formatting color with a macro, I had to resort to brute force, to get the color for each ranking number. Close your eyes, if you're a squeamish type – this gets a bit ugly!
由于无法使用宏获取条件格式的颜色,因此我不得不求助于蛮力,以获取每个排名编号的颜色。 如果您是娇气的类型,请闭上眼睛-这有点难看!
- To get the colors, I copied the ColorList cells. 为了获得颜色,我复制了ColorList单元格。
- Then, I pasted them into Word 然后,我将它们粘贴到Word中
- Next, I copied the list from Word, and pasted them back onto the 1-11 cells in Excel 接下来,我从Word复制了列表,并将其粘贴回Excel中的1-11单元格中
- The conditional formatting was gone, and the cells had a fill color instead. 条件格式消失了,单元格改为具有填充色。
The colors were the same, but now Excel could extract the color number from those cells The macro would find the cell in the color list that matched the client's rank number, and use the color from that color list cell. However, now that the revised macro uses the DisplayFormat property, the workaround isn't needed. The macro can get the conditional format color from the % Invoiced column instead.
颜色是相同的,但是现在Excel可以从那些单元格中提取颜色编号。宏将在颜色列表中找到与客户的等级编号匹配的单元格,并使用该颜色列表单元格中的颜色。 但是,既然修订后的宏使用了DisplayFormat属性,则不需要解决方法。 宏可以改为从“发票百分比”列中获取条件格式颜色。
宏为图表着色 (Macro to Color the Chart)
The original request was for a pie chart with conditional formatting. In the sample file, I also created a Bar Chart, because it's easier to compare the client amounts in that type of chart, instead of a pie chart. Here's the macro – ColorChartDataPoints - that I use to color the pie chart slices, and the bars in the Bar Chart, based on the % Invoiced conditional formatting for each client.
最初的要求是使用条件格式的饼图。 在示例文件中,我还创建了一个条形图,因为比较这种类型的图而不是饼图的客户金额更加容易。 这是宏– ColorChartDataPoints-我根据每个客户的%发票条件格式,使用它们对饼图切片和条形图中的条进行着色。
- The macro gets the location of the source data, based on the formula for the chart series. 宏根据图表系列的公式获取源数据的位置。
- Then, it gets the conditional formatting color from the 3rd column to the right of the source data's start column 然后,它从源数据的起始列右侧的第3列获取条件格式颜色
- That color is used for the slice/bar. 该颜色用于切片/条。
NOTE: The macro has been updated to use the DisplayFormat property, instead of a ranking list.
注意:宏已更新为使用DisplayFormat属性,而不是排名列表。
Sub ColorChartDataPoints()
'colour data point based on
'value in rank column
Dim ws As Worksheet
Dim ch As ChartObject
Dim ser As Series
Dim dp As Point
Dim ptnum As Long
Dim rngSD01 As Range
Dim strF  As String
Dim strRng  As String
Dim CharStart As Long
Dim CharEnd As Long
Dim ColOff As Long
Dim PtColor As Long

ColOff = 3  'offset to Rank column
Set ws = ActiveSheet

For Each ch In ws.ChartObjects
  Set ser = ch.Chart.FullSeriesCollection(1)
  strF = ch.Chart.SeriesCollection(1).Formula

  CharStart = InStr(1, strF, ",")
  CharEnd = InStr(InStr(1, strF, ",") _
        + 1, strF, ",")
  strRng = Mid(strF, CharStart + 1, _
         CharEnd - CharStart - 1)
  Set rngSD01 = ws.Range(strRng)
  ptnum = 1

  For Each dp In ser.Points
    PtColor = rngSD01.Cells(ptnum, 1) _
        .Offset(0, ColOff).DisplayFormat.Interior.Color
    dp.Format.Fill.ForeColor.RGB = PtColor
    ptnum = ptnum + 1
  Next dp
Next ch

End Sub
最终结果 (The Final Result)
Here's the finished Conditional Formatting Color report, with the sample data, the bar chart, and the pie chart. It was an interesting project, so download the workbook (link below), if you'd like to test it.
这是完成的“条件格式颜色”报告,其中包含示例数据,条形图和饼图。 这是一个有趣的项目,因此,如果您要测试它,请下载工作簿(下面的链接)。
NOTE: There is also an event procedure on the Chart sheet, and it automatically runs the ColorChartDataPoints macro, if an Order total or Invoice amount is changed.
注意:在图表表上还有一个事件过程,并且如果更改了订单总额或发票金额,它将自动运行ColorChartDataPoints宏。
颜色列表工作簿 (Color Lists Workbook)
All this work with Excel colors reminded me that John Marshall had sent me his Excel Colours project a while ago. If you'd like an Excel file with tons of colour lists, you can download a copy of John's sample file from the Technet Gallery.
所有使用Excel Colors进行的工作都使我想起John Marshall前一段时间已将他的Excel Colors项目发送给我。 如果您想要带有大量颜色列表的Excel文件,可以从Technet Gallery下载John的样本文件的副本。
John is a Microsoft Visio MVP, and needed colour lists for a Visio project. That's easier to do in Excel, so he set up the colour lists there. The workbook has 11 sheets with colour samples, and the RGB, Hex, and other values. The main list is shown below
John是Microsoft Visio MVP,并且需要Visio项目的颜色列表。 在Excel中这样做更容易,因此他在那里设置了颜色列表。 该工作簿有11张工作表,其中包含颜色样本以及RGB,Hex和其他值。 主列表如下所示
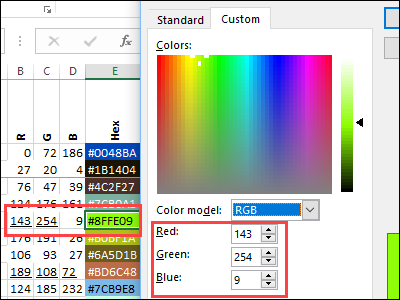
If you select a cell, and go into the More Colors option, you can see the RGB settings for the selected cell, on the Custom tab. Those numbers should match the values that you'll see in the Colour lists of John's workbook.
如果选择一个单元格,然后进入“更多颜色”选项,则可以在“自定义”选项卡上看到所选单元格的RGB设置。 这些数字应与您将在John工作簿的“颜色”列表中看到的值匹配。
更多颜色清单 (More Color Lists)
There are several other colour lists in John's workbook too, including Crayola, LEGO and Pantone. On the workbook's Introduction sheet, John gives details on the source for each list.
John的工作簿中还有其他几种颜色列表,包括Crayola,LEGO和Pantone。 在工作簿的“简介”表上,John提供了每个列表来源的详细信息。
To keep the workbook from slowing down, the colour list formulas are in the first row only (orange cells). Below that, the formulas have been copied, and pasted as values (green cells). If you change any of the colours, you could copy the formulas down again.
为了防止工作簿变慢,颜色列表公式仅位于第一行(橙色单元格)。 在此之下,公式已被复制并粘贴为值(绿色单元格)。 如果您更改任何颜色,则可以再次复制公式。
Most of the formulas are based on User Defined Functions (UDFs) that calculate each colour's values.
大多数公式都是基于用户定义函数(UDF)来计算每种颜色的值。
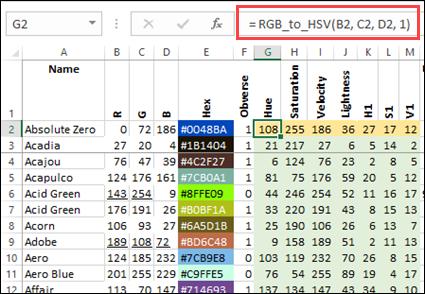
In the screen shot shown below, you can see a formula that uses a UDF named RBG_to_HSV UDF. It calculates the colour's Hue, based on the RGB (Red Green Blue) values in columns B, C and D.
在下面显示的屏幕快照中,您可以看到一个使用名为RBG_to_HSV UDF的UDF的公式。 它根据B,C和D列中的RGB(红绿蓝)值计算颜色的色相。
The workbook and its code are unlocked, so go to the Visual Basic Editor, and take a look at the functions in the code module, to see how they work.
该工作簿及其代码已解锁,因此请转到Visual Basic编辑器,并查看代码模块中的功能,以了解它们的工作方式。
更多Excel颜色资源 (More Excel Color Resources)
Here are a few more of the Excel Color, and Excel Chart Color resources that I used, while working on this interesting project.
在进行这个有趣的项目时,这里还有一些我使用的Excel Color和Excel Chart Color资源。
Color Info
颜色信息
StackOverflow – Get Cell Color Properties
StackOverflow – 获取单元格颜色属性
Jon Peltier explains pretty much everything you'd want to know about Excel colors in the user interface
Jon Peltier 在用户界面中几乎解释了您想了解的有关Excel颜色的所有信息
My blog post shows how to make the Colors window bigger
我的博客文章显示了如何使“颜色”窗口变大
Wikipedia - The RGB Color Model and the HSL/HSV Values
维基百科-RGB颜色模型和HSL / HSV值
Chart Colors
图表颜色
Jon Peltier's macro to change series color based on cell color
Jon Peltier的宏可以根据单元格颜色更改系列颜色
Jon Peltier's macro to change series color based on the series name
Jon Peltier的宏根据系列名称更改系列颜色
获取颜色工作簿 (Get the Color Workbooks)
Here's how to get the two sample Excel files that I mentioned:
这是获取我提到的两个示例Excel文件的方法:
To get a copy of my Conditional Formatting Color file, go to the Excel Sample Files page on my Contextures website. In the Charts section, look for CH0011 – Chart Colour Based on Rank. The zipped file is in xlsm format, and contains macros.
若要获取我的“条件格式颜色”文件的副本,请转到Contextures网站上的“ Excel示例文件”页面。 在“图表”部分中,查找“ CH0011 –基于等级的图表颜色” 。 压缩文件为xlsm格式,并包含宏。
You can download a copy of John Marshall's Colour Lists workbook from the Technet Gallery.
您可以从Technet Gallery下载John Marshall的Color Lists工作簿的副本。
翻译自: https://contexturesblog.com/archives/2018/03/15/excel-conditional-formatting-colour-macro-problems/
excel禁用宏的格式


 598
598

 被折叠的 条评论
为什么被折叠?
被折叠的 条评论
为什么被折叠?
 到【灌水乐园】发言


