excel动态图表ppt
Excel中动态图表的问题 (Problems With Dynamic Charts in Excel)

Recently, I wrote about creating dynamic charts in Excel, where you can select a date range from drop down lists. In that article I warned that the dynamic values would disappear if the entire range is selected, in Excel 2007. I've done more testing, to see when the values stick, and when they disappear, and there's a new version of the file for you.
最近,我写了关于在Excel中创建动态图表的信息 ,您可以从下拉列表中选择日期范围。 在那篇文章中,我警告说,如果在Excel 2007中选择了整个范围,则动态值将会消失。我已经进行了更多的测试,以查看值何时会消失,何时消失以及是否有适用于该文件的新版本。您。
Excel 2007测试 (Excel 2007 Tests)
First, I tested Excel 2007, with and without an Excel Table, and using different formulas for the named ChartDates range.
首先,我测试了带有和不带有Excel表的Excel 2007,并为命名的ChartDates范围使用了不同的公式。
| Table | Dyn Lost | ChartDates Range |
| Yes | Yes | =Table1[Date] |
| Yes | Yes | =OFFSET(Chart!$A$1,1,0, COUNT(Chart!$A:$A),1) |
| Yes | Yes | =Chart!$A$2:$A$23 |
| No | No | =OFFSET(Chart!$A$1,1,0, COUNT(Chart!$A:$A),1) |
| No | No | =Chart!$A$2:$A$23 |
| 表 | 失落的达因 | ChartDates范围 |
| 是 | 是 | =表1 [日期] |
| 是 | 是 | = OFFSET(图表!$ A $ 1,1,0,COUNT(图表!$ A:$ A),1) |
| 是 | 是 | =图表!$ A $ 2:$ A $ 23 |
| 没有 | 没有 | = OFFSET(图表!$ A $ 1,1,0,COUNT(图表!$ A:$ A),1) |
| 没有 | 没有 | =图表!$ A $ 2:$ A $ 23 |
With the data in an Excel Table, the dynamic chart values were always lost, if the full date range was selected.
如果选择了整个日期范围,则使用Excel表中的数据时,动态图表值始终会丢失。
So, the best option in Excel 2007 is to avoid an Excel Table, and use a dynamic ChartDates range.
因此,Excel 2007中的最佳选择是避免使用Excel表,并使用动态ChartDates范围。
Excel 2003测试 (Excel 2003 Tests)
I hadn't noticed the problem of disappearing dynamic values in earlier versions of Excel, so I tested the Lists feature in Excel 2003. Here are the test results:
我没有注意到早期版本的Excel中动态值消失的问题,因此我在Excel 2003中测试了列表功能。以下是测试结果:
| List | Dyn Lost | ChartDates Range |
| Yes | Sometimes* | =OFFSET(Chart!$A$1,1,0, COUNT(Chart!$A:$A),1) |
| Yes | Sometimes* | =Chart!$A$2:$A$23 |
| No | No | =OFFSET(Chart!$A$1,1,0, COUNT(Chart!$A:$A),1) |
| No | No | =Chart!$A$2:$A$23 |
| 清单 | 失落的达因 | ChartDates范围 |
| 是 | 有时* | = OFFSET(图表!$ A $ 1,1,0,COUNT(图表!$ A:$ A),1) |
| 是 | 有时* | =图表!$ A $ 2:$ A $ 23 |
| 没有 | 没有 | = OFFSET(图表!$ A $ 1,1,0,COUNT(图表!$ A:$ A),1) |
| 没有 | 没有 | =图表!$ A $ 2:$ A $ 23 |
*If the entire range is shown in the chart, and you add a new item at the end of the chart data, dynamic values in the chart are lost. However, you can select the entire range, without losing the dynamic values.
*如果整个范围都显示在图表中,并且在图表数据的末尾添加了一个新项目,则图表中的动态值将丢失。 但是,您可以选择整个范围,而不会丢失动态值。
So, the best option in Excel 2003 is to avoid a List, and use a dynamic ChartDates range.
因此,Excel 2003中最好的选择是避免使用List,并使用动态ChartDates范围。
控制开始和结束日期选择 (Control the Start and End Date Selection)
In the creating dynamic charts in Excel post comments, Jeff Reese asked how you could ensure that the user selects an End Date that's greater than the Start Date.
在Excel中创建动态图表后评论中,Jeff Reese问您如何确保用户选择的结束日期大于开始日期。
Michael Pierce suggested a dynamic range for each of the drop down lists.
迈克尔·皮尔斯(Michael Pierce)为每个下拉列表建议了一个动态范围。
- My suggestion would be to create named ranges for the Start and End Date, using the same offset technique as is used for XValues and YValues. The StartValues range would start at the beginning of the list and continue through the EndDate – 1. The EndValues range would begin at Start Date + 1 and continue through the end of the list. That way, the list of valid end dates is updated any time a selection is made for either date. 我的建议是使用与XValues和YValues相同的偏移技术,为开始日期和结束日期创建命名范围。 StartValues范围将从列表的开头开始,一直到EndDate –1。EndValues范围将从Start Date + 1开始,直到列表末尾。 这样,无论何时选择任一日期,都会更新有效结束日期的列表。
Derek suggested using the earlier date as the Start Date and the later date as the End Date:
Derek建议将较早的日期用作开始日期,将较晚的日期用作结束日期:
- Alternatively, have the start date and end date be replaced in the formulae with MIN(start date, end date) and MAX(start date, end date), ensuring that whichever is the greater is used as the end date. I assume the graph would just look silly if the two dates were the same, not broken. 或者,在公式中将开始日期和结束日期替换为MIN(开始日期,结束日期)和MAX(开始日期,结束日期),确保使用较大的日期作为结束日期。 我认为,如果两个日期相同,则图表将看起来很傻,不会被破坏。
计算开始和结束日期 (Calculate the Start and End Dates)
Michael's suggestion would work well, but users might have problems switching from an April date range to a May date range. The May end date would have to be selected first, to make the May start dates available.
Michael的建议效果很好,但是用户可能无法从4月的日期范围切换到5月的日期范围。 必须首先选择5月的结束日期,才能使用5月的开始日期。
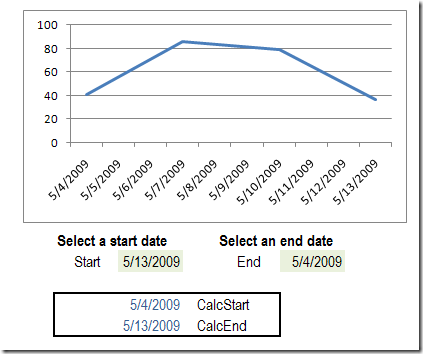
I decided to go with Derek's suggestion, and use the earlier date as the start date, whether it's in the Start Date cell, or the End Date cell.
我决定接受Derek的建议,并使用较早的日期作为开始日期,无论是在“开始日期”单元格还是“结束日期”单元格中。
The CalcStart formula: =IF(StartDate=0,MIN(ChartDates),MIN(StartDate,EndDate))
CalcStart公式: = IF(StartDate = 0,MIN(ChartDates),MIN(StartDate,EndDate))
The CalcEnd formula: =IF(EndDate=0,MAX(ChartDates),MAX(StartDate,EndDate))
CalcEnd公式: = IF(EndDate = 0,MAX(ChartDates),MAX(StartDate,EndDate))

I named the date calculation cells as CalcStart and CalcEnd, and used those names in the XValues definition:
我将日期计算单元格命名为CalcStart和CalcEnd,并在XValues定义中使用了这些名称:
=OFFSET(Chart!$A$2,MATCH(CalcStart,ChartDates,0)-1,0, MATCH(CalcEnd,ChartDates,0)-MATCH(CalcStart,ChartDates,0)+1,1)
= OFFSET(图表!$ A $ 2,MATCH(CalcStart,ChartDates,0)-1,0, MATCH(CalcEnd,ChartDates,0)-MATCH(CalcStart,ChartDates,0)+1,1)
下载修订的样本文件 (Download the Revised Sample File)
You can download the revised Excel 2007 sample file for Dynamic Date Range Charts. In it, the Excel Table has been removed, and the start and end date calculations added.
您可以为动态日期范围图表下载修订的Excel 2007示例文件。 其中,Excel表已被删除,并且开始日期和结束日期计算已添加。
翻译自: https://contexturesblog.com/archives/2009/05/06/problems-with-dynamic-charts-in-excel/
excel动态图表ppt


 1192
1192

 被折叠的 条评论
为什么被折叠?


