


excel动态图表ppt
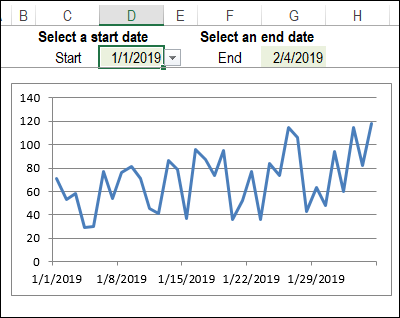
Someone asked me how to create a chart where there could select a date range, and the chart would update automatically, to show results for those dates. Here's a quick look at the chart with dynamic date range setup, and there's a download link at the end.
有人问我如何创建一个可以选择日期范围的图表,该图表将自动更新,以显示这些日期的结果。 快速浏览一下带有动态日期范围设置的图表,最后还有一个下载链接。
日期范围图 (Chart for Date Range)
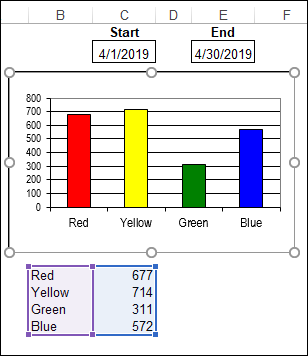
The person who asked for help wants to print out a chart of daily test results, for any selected period. They had tried the date range chart tutorial on my website: Excel Chart for Date Range, but it wasn't what they needed.
寻求帮助的人希望在任何选定时期内打印出每日测试结果的图表。 他们在我的网站上尝试了日期范围图表教程: 日期范围的Excel图表 ,但这不是他们所需要的。
That chart is based on a set range of 8 cells, which have colour names, and total sales for those colours in the selected date range.
该图表基于8个单元格的设置范围,这些单元格具有颜色名称,以及这些颜色在选定日期范围内的总销售额。
动态日期范围 (Dynamic Date Range)
Instead of a set range for the chart, he needed a dynamic range. For example, if he selected March 1st to March 31st as the date range, there would be 31 days of data, with multiple tests per day. In February, the list would be shorter.
除了需要为图表设置范围外,他还需要一个动态范围。 例如,如果他选择3月1日至3月31日作为日期范围,则将有31天的数据,每天要进行多次测试。 在二月份,名单会更短。
I created a chart sample that did that, way back in 2009. The article showed how to set up the dynamic ranges, and date selector cells, and the chart.
我创建了一个图表示例,可以追溯到2009年 。 本文介绍了如何设置动态范围,日期选择器单元格以及图表。
One of the steps was to set up a named Excel table, which makes it easy to create dynamic ranges. Then, the chart series could be based on those dynamic ranges.
步骤之一是建立一个命名的Excel表,这使创建动态范围变得容易。 然后,图表系列可以基于这些动态范围。

动态范围问题 (Dynamic Range Problem)
But, there was a problem with that method, which I mentioned at the end of the article.
但是,该方法存在一个问题,我在本文末尾提到。
Warning: If you select the entire range, the series formula will revert to absolute cell references instead of the named ranges.
警告 :如果选择整个范围,则序列公式将恢复为绝对单元格引用,而不是命名范围。
And you never know when somebody might forget that warning, and mess up your workbook!
而且您永远都不知道有人何时会忘记该警告并弄乱您的工作簿!
避免动态范围问题 (Avoid the Dynamic Range Problem)
A few days later, I wrote another article, and uploaded a new version of the dynamic chart sample file.
几天后,我写了另一篇文章,并上传了动态图表示例文件的新版本 。
I advised against using formatted Excel tables, and recommended OFFSET formulas instead. In my tests, the dynamic ranges were never lost with that method.
我建议不要使用格式化的Excel表,而建议使用OFFSET公式。 在我的测试中,该方法从未丢失动态范围。
That version had a formula to calculate start and end dates too, in case they were reversed in the selection drop downs.
该版本也有一个公式来计算开始和结束日期,以防它们在选择下拉列表中被逆转。
新动态日期范围图 (New Dynamic Date Range Chart)
The revised sample file worked well, but I hadn't changed the instruction sheet in the workbook. It still mentioned Excel Tables, and the formulas were all based on table ranges.
修改后的示例文件效果很好,但是我没有更改工作簿中的说明表。 它仍然提到Excel表格,并且所有公式均基于表格范围。
To fix that problem, I've created a new version of the chart with dynamic date range workbook.
为了解决该问题,我使用动态日期范围工作簿创建了图表的新版本。
The chart data was moved to a separate sheet, and the calculated date section was moved to an Admin sheet. That sheet could be hidden, so nobody messes up the formulas.
图表数据已移至单独的工作表,而“计算日期”部分已移至“管理”工作表。 该工作表可能是隐藏的,因此没有人弄乱公式。
图表表 (Chart Sheet)
Now the chart is on its own sheet, with the date selection drop downs above it. There's lots of room now, so you could make the chart bigger.
现在,图表位于自己的工作表中,日期选择下拉到其上方。 现在有很多空间,因此您可以放大图表。
没有格式化的表 (No Formatted Table)
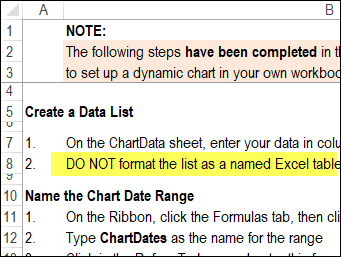
The Setup sheet has updated instructions, and it warns you not to format the list as and Excel Table.
设置工作表已更新说明,它警告您不要将列表格式设置为Excel Table。
The instructions also show the OFFSET formulas, instead of the table references.
这些说明还显示了OFFSET公式,而不是表引用。
获取样本文件 (Get the Sample File)
To get the sample file with the completed chart with dynamic date range, and the instructions, go to the Excel Sample Files page on my Contextures website.
若要获取带有完整图表以及动态日期范围的示例文件和说明,请转到Contextures网站上的Excel Sample Files页面 。
In the Charts section, look for CH0013 - Chart with Dynamic Date Range. The zipped file is in xlsx format, and does not contain any macros.
在“图表”部分中,查找“ CH0013-具有动态日期范围的图表” 。 压缩文件为xlsx格式,不包含任何宏。
翻译自: https://contexturesblog.com/archives/2019/08/08/excel-chart-with-dynamic-date-range/
excel动态图表ppt


 1994
1994

 被折叠的 条评论
为什么被折叠?
被折叠的 条评论
为什么被折叠?
 到【灌水乐园】发言


