


excel数据透视表
This week I'm working on a client's sales plans for the upcoming fiscal year. They forecast sales per month by product and customer, and we use some pretty complicated formulas to sort things out. Of course, anywhere that it makes sense to use a pivot table, I create one. It's a great way to summarize all the details, and review the overall totals. Running totals are easy with Excel pivot tables!
本周,我正在为客户制定下一个财政年度的销售计划。 他们根据产品和客户预测每月的销售量,我们使用一些非常复杂的公式进行分类。 当然,在需要使用数据透视表的任何地方,我都会创建一个。 这是汇总所有详细信息并查看总体总计的好方法。 使用Excel数据透视表,运行总计很容易!
数据透视表没有公式 (No Formulas for Pivot Tables)
For example, on a worksheet you can use formulas to create a running total, but in a pivot table it's much easier -- you can quickly create running totals with a couple of mouse clicks.
例如,在工作表上,您可以使用公式来创建运行总计,但在数据透视表中要容易得多-您只需单击几下鼠标即可快速创建运行总计。
Let's take a look at an Excel pivot table based on some faked sales data. In the screen shot below, you can see the total sales per region per month, and the Grand Total per month. By changing the Sales field settings, you can show a running total, instead of the normal Sum.
让我们看一下基于一些伪造的销售数据的Excel数据透视表。 在下面的屏幕快照中,您可以查看每月每个区域的总销售额以及每月的总计。 通过更改“销售”字段设置,您可以显示运行总计,而不是正常的总和。

添加运行总计 (Add the Running Total)
To change the sales field, and show a running total, follow these steps:
要更改销售字段并显示运行总计,请按照下列步骤操作:
-
- In the pivot table, right-click one of the Sales amount cells. 在数据透视表中,右键单击“销售金额”单元格之一。
- In the context menu that appears, click Summarize Data By 在出现的上下文菜单中,单击“汇总数据依据”
- Click More Options 单击更多选项

-
- In the Value Field Settings dialog box, click the Show Values As tab 在“值字段设置”对话框中,单击“将值显示为”选项卡
- From the Show Values As dropdown list, select Running Total In. 从“将值显示为”下拉列表中,选择“运行总计”。
- Select the Base Field where you want to see the running total. In this example, we'd like to see the running total down the list of dates, so OrderDate is selected as the Base Field. 选择要查看运行总计的基本字段。 在此示例中,我们希望看到日期列表中的运行总计,因此将OrderDate选择为“基本字段”。

- Click OK, to close the Value Field Settings dialog box. 单击确定,以关闭“值字段设置”对话框。
The pivot table changes, to show the running total for sales.
数据透视表将更改,以显示销售的运行总额。
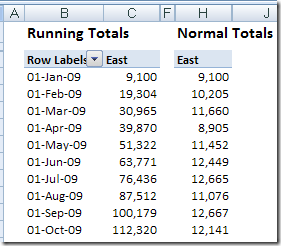
In the following screenshot, you can see the running totals in column C, and the original monthly totals in column H. Each month's total sales is added to the previous total, to show the running total.
在下面的屏幕截图中,您可以在C列中看到运行总计,在H列中看到原始的每月总计。每个月的总销售额将添加到先前的总计中,以显示运行总计。
更改运行总计基数字段 (Change the Running Total Base Field)
The most common use for running totals is to show amounts accumulated over time, as in the sales by month example above. However, you can use a non-date field as the base field for a running total. For example, in an election, you could show a running total of votes as each district submits its results. Or, for a large construction project, you could show a running total of expenses over the project phases.
运行总计的最常见用途是显示一段时间内累积的金额,如上面的按月销售额示例。 但是,您可以将非日期字段用作运行总计的基础字段。 例如,在选举中,您可以显示每个地区提交其结果时的连续投票总数。 或者,对于大型建筑项目,您可以显示项目阶段的费用总额。
In this pivot table, I've added City to the Column area, and used that as the Base Field for the running total.
在此数据透视表中,我已将“城市”添加到“列”区域,并将其用作运行总计的“基本字段”。

Now, instead of the running total going down the pivot table by month, it goes across the pivot table, by city.
现在,它不是按月在数据透视表中向下移动的总计,而是按城市遍历数据透视表。
Be careful though -- if you use a Base Field that isn't in the pivot table layout, you'll see #N/A for all the running total values.
不过请注意-如果您使用的数据字段不在数据透视表布局中,则所有运行中的总计值都会显示为#N / A。

年终总计停止 (Running Totals Stop at Year End)
If your pivot table shows the data grouped by year and month, the running total will stop at the year end, then start over for the next year. For a workaround, there are instructions on my pivot table blog:
如果数据透视表显示按年和月分组的数据,则运行总计将在年底停止,然后从下一年开始。 要解决此问题,我的数据透视表博客上有说明:
http://www.pivot-table.com/2013/07/17/running-total-stops-at-year-end/
http://www.pivot-table.com/2013/07/17/running-total-stops-at-year-end/
Excel 2003数据透视表中的运行总计 (Running Totals in Excel 2003 Pivot Tables)
The running total technique is similar in Excel 2003 pivot table, and you can see the instructions here: Excel 2003 Pivot Table Running Totals. It also shows the results when there are multiple fields in the row area, and a running total is added to one of those fields.
Excel 2003数据透视表中的运行总计技术类似,您可以在此处查看说明: Excel 2003数据透视表运行总计 。 当行区域中有多个字段并将运行总计添加到这些字段之一时,它还会显示结果。
观看总计视频 (Watch the Running Totals Video)
To see the steps for creating running totals in Excel 2003, please watch this short Pivot Table Running Totals video.
若要查看在Excel 2003中创建运行总计的步骤,请观看此简短的“数据透视表运行总计”视频。
翻译自: https://contexturesblog.com/archives/2010/03/03/running-totals-are-easy-with-excel-pivot-tables/
excel数据透视表


 767
767

 被折叠的 条评论
为什么被折叠?
被折叠的 条评论
为什么被折叠?
 到【灌水乐园】发言


