


 本文介绍了如何在Excel中创建动态图表,包括如何将图表数据标签链接到单元格值,使得当数据变化时,图表标签能自动更新。此外,还展示了如何将图表标题与单元格值关联,以实现更富有创意和动态的图表标题。

怎样在单元格中插入图表

Make your chart labels in Microsoft Excel dynamic by linking them to cell values. When the data changes, the chart labels automatically update. In this article, we explore how to make both your chart title and the chart data labels dynamic.
通过将Microsoft Excel图表标签链接到单元格值,可以使它们动态。 数据更改时,图表标签将自动更新。 在本文中,我们探讨了如何使图表标题和图表数据标签都动态化。
We have the sample data below with product sales and the difference in last month’s sales.
以下是带有产品销售量和上个月销售量差异的示例数据。
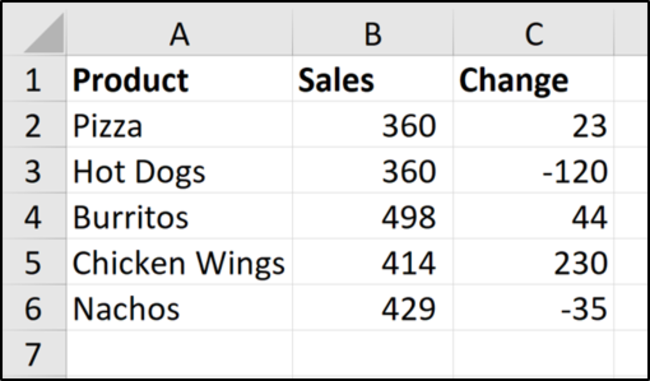
We want to chart the sales values and use the change values for data labels.
我们要绘制销售值图表并将更改值用于数据标签。
 最低0.47元/天 解锁文章


 被折叠的 条评论
为什么被折叠?
被折叠的 条评论
为什么被折叠?
 到【灌水乐园】发言


