


kibana 日志查询技巧

Hi Habrausers!
您好Habrausers!
As you may know Kibana is a visualization instrument, part of ELK (Elastic, Logstash, Kibana) stack. With the help of Kibana you may analyze and visualize your data, build different charts and combine them on the dashboard to present data in the most beautiful way.
您可能知道,Kibana是一种可视化工具,是ELK (弹性,Logstash,Kibana)堆栈的一部分。 在Kibana的帮助下,您可以分析和可视化数据,构建不同的图表,并将它们组合在仪表板上,以最精美的方式显示数据。
People who use Kibana in our company have different background — some of them are technical who process data, some are managers who simply want to monitor some KPIs. And all have various questions. In spite of Kibana is rather popular in IT companies, there are not many articles or courses about it. To fill the gap I have created Kibana Tips & Tricks — weekly letters with frequently asked questions or themes. Such letters help our users to become more familiar with Kibana. There are no secrets — just detailed description of how you may work with your data.I would like to share the first part of 'Kibana Tips & Tricks' with you — series of simple how-to articles for people who would like to know more about data analysis and visualization in Kibana. Today we will see how to view events in Kibana.
在我们公司中使用Kibana的人员具有不同的背景-有些是处理数据的技术人员,有些是只想监视某些KPI的经理。 所有人都有各种各样的问题。 尽管Kibana在IT公司中相当流行,但关于它的文章或课程却很少。 为了填补空白,我创建了Kibana技巧与窍门-每周信件,其中包含常见问题或主题。 这样的信件有助于我们的用户更加熟悉Kibana。 没有秘密,只有详细说明如何处理数据。我想与您分享“ Kibana技巧与窍门”的第一部分,这是一系列简单的操作方法文章,面向希望了解Kibana中的数据分析和可视化知识的人们。 今天,我们将看到如何查看Kibana中的事件。
The simplest an quickest way to see events in Kibana is to use
在Kibana中查看事件的最简单,最快的方法是使用
发现视图 (Discover view)
.
。
The
的
发现视图 (Discover view)
presents all the data in your index as a table of documents and allows you to see the number of events for selected time period.
以文档表的形式显示索引中的所有数据,并允许您查看选定时间段内的事件数。
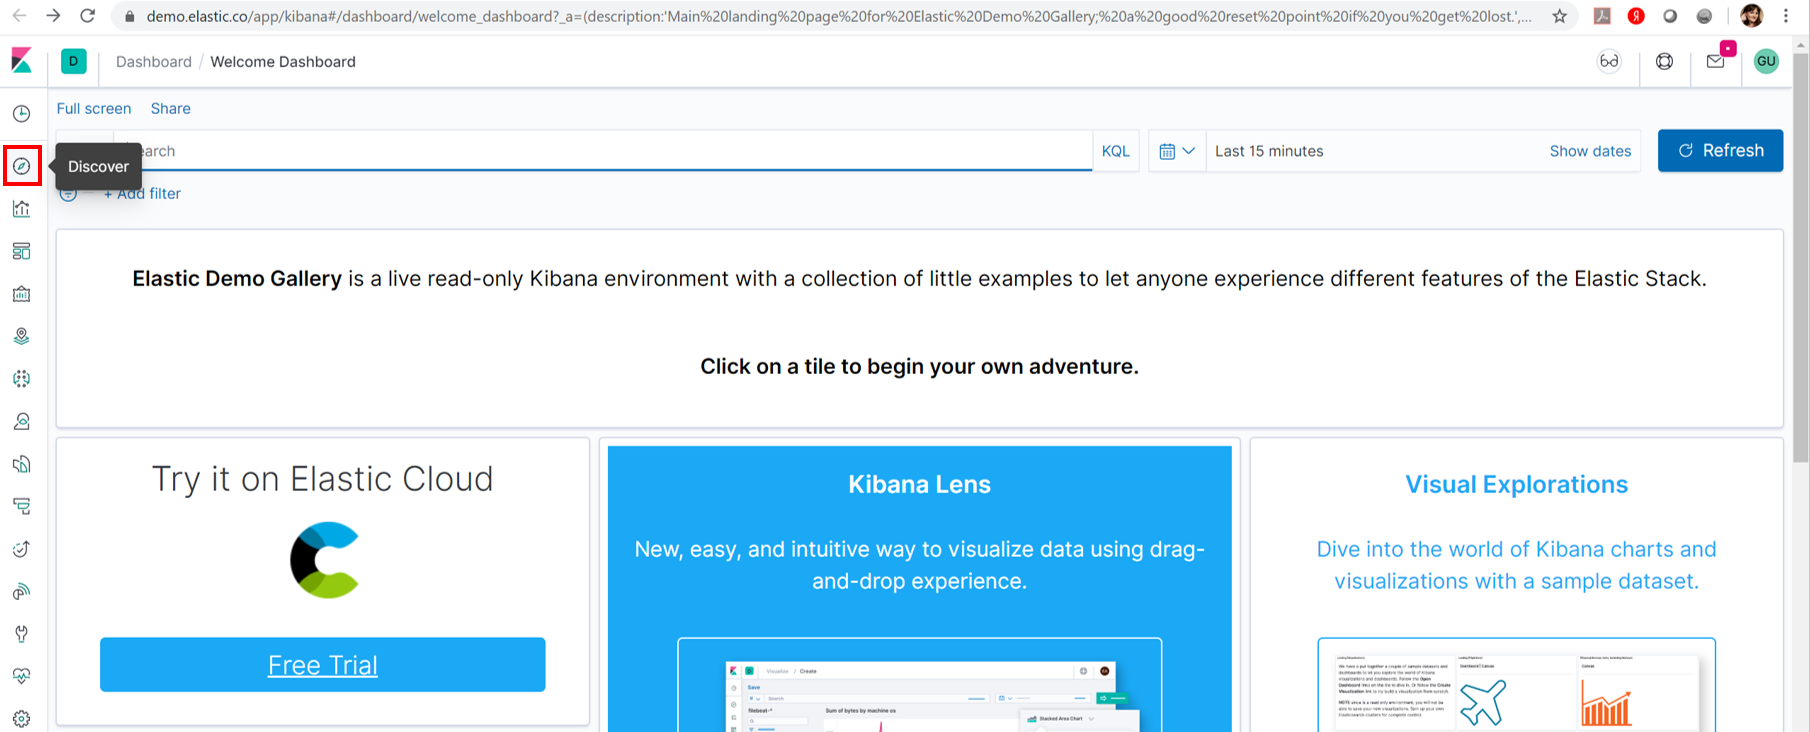
To access discover mode click on
要访问发现模式,请单击
发现 (Discover)
on the left Kibana panel:
在左侧的Kibana面板上:
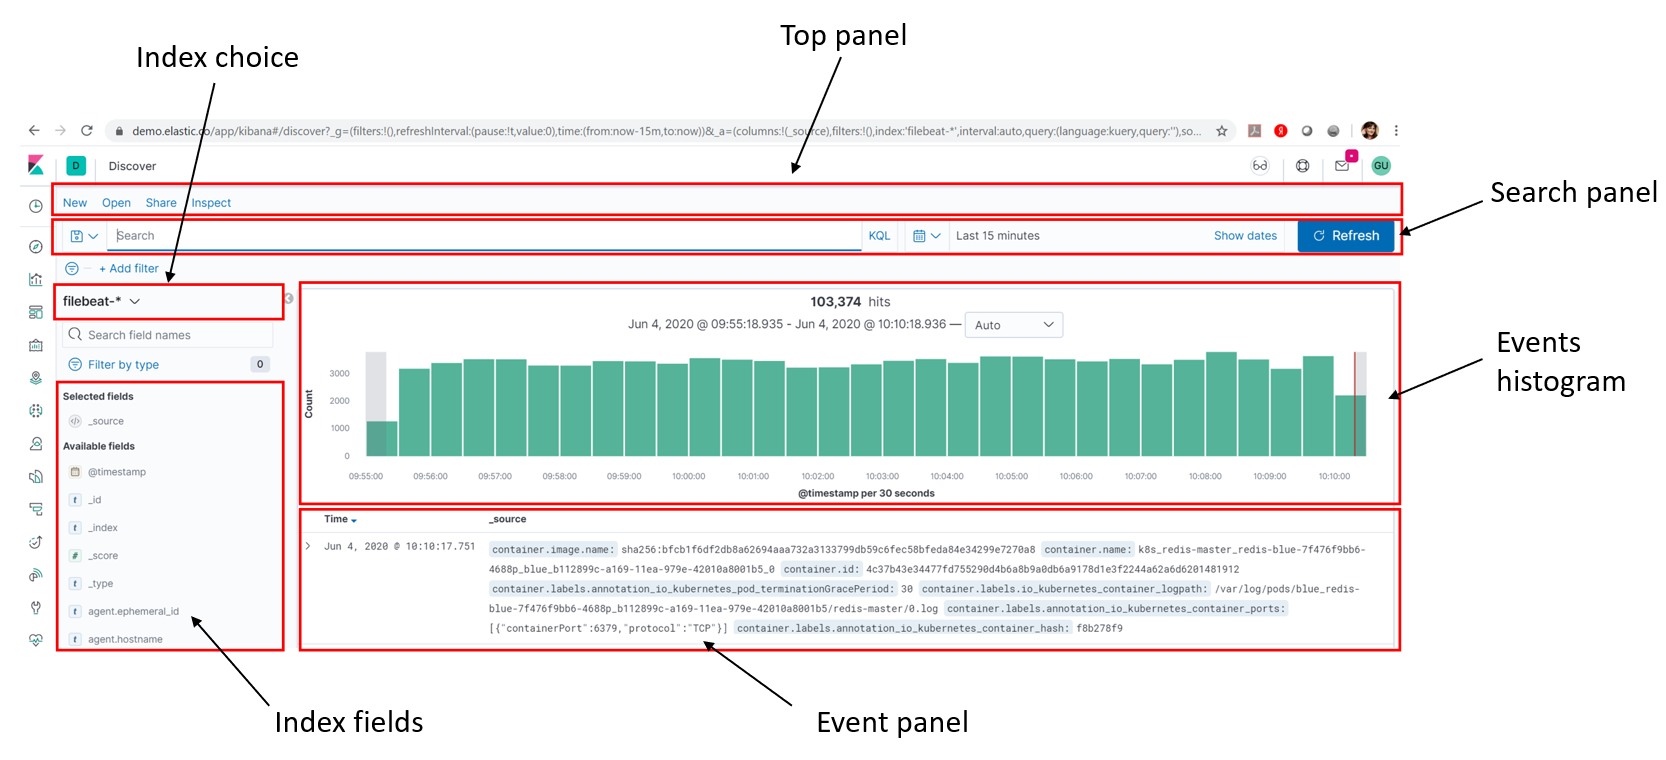
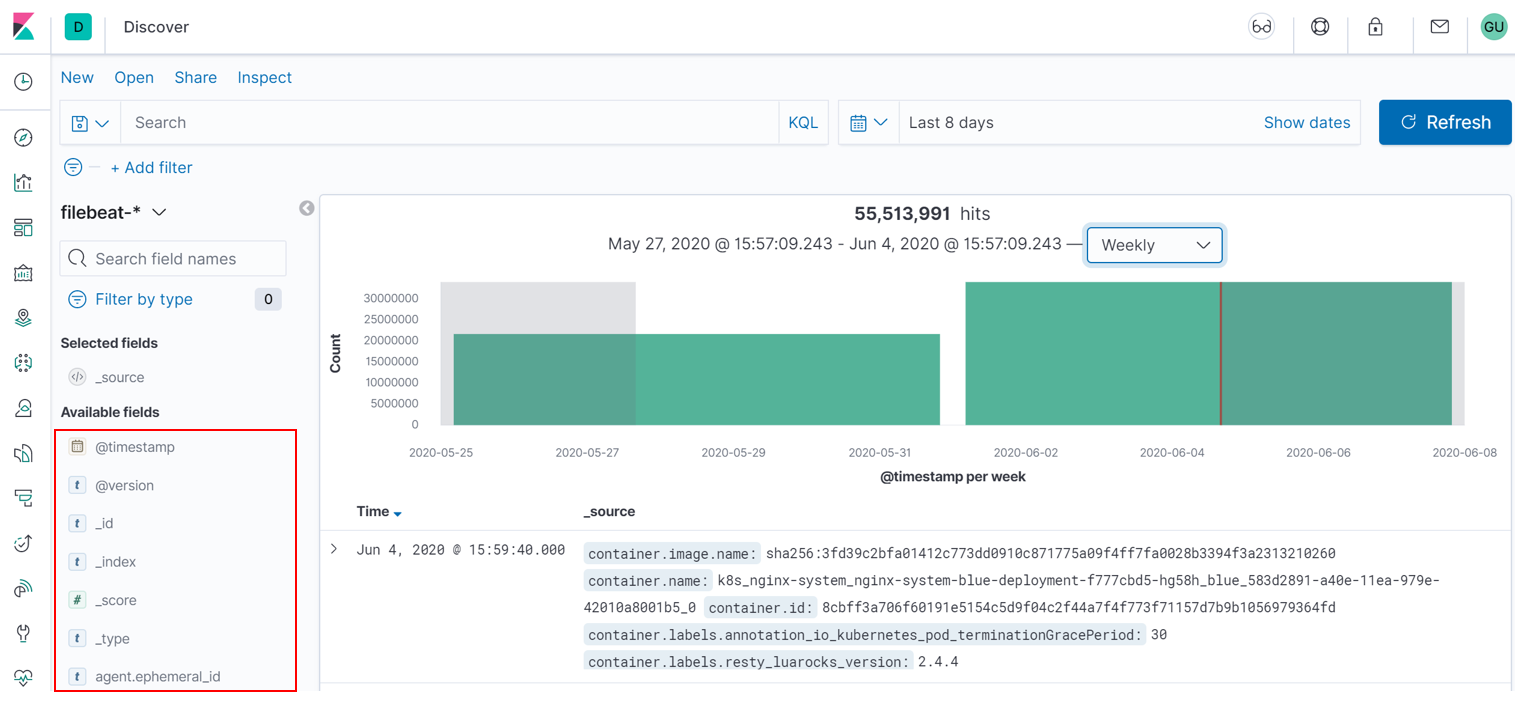
Discover view consists of several parts:
发现视图包括以下几部分:
顶板 (Top panel)
with the ability to save a search or share it
可以保存或共享搜索
搜索面板 (Search panel)
— where you may put specific filters, search for event and change the time range
—您可以在其中放置特定的过滤器,搜索事件并更改时间范围
索引选择 (Index choice)
— to change the index you want to view the data from
—更改要查看其数据的索引
索引字段列表 (Index fields list)
which lists all available fields for this index
列出了该索引的所有可用字段
事件直方图 (Events histogram)
— total number of events per time bucket over a time range
—在一个时间范围内每个时间段的事件总数
活动窗格 (Event pane)
— list of individual events
—单个事件列表
Let's analyze discover view and see what we can do with specific index and event.
让我们分析发现视图,看看我们可以使用特定的索引和事件来做什么。
顶板 (Top Panel)
On the Top panel you see buttons:
在顶部面板上,您可以看到按钮:
新 (New)
,
,
保存 (Save)
,
,
打开 (Open)
,
,
分享 (Share)
and Inspect.
和检查。
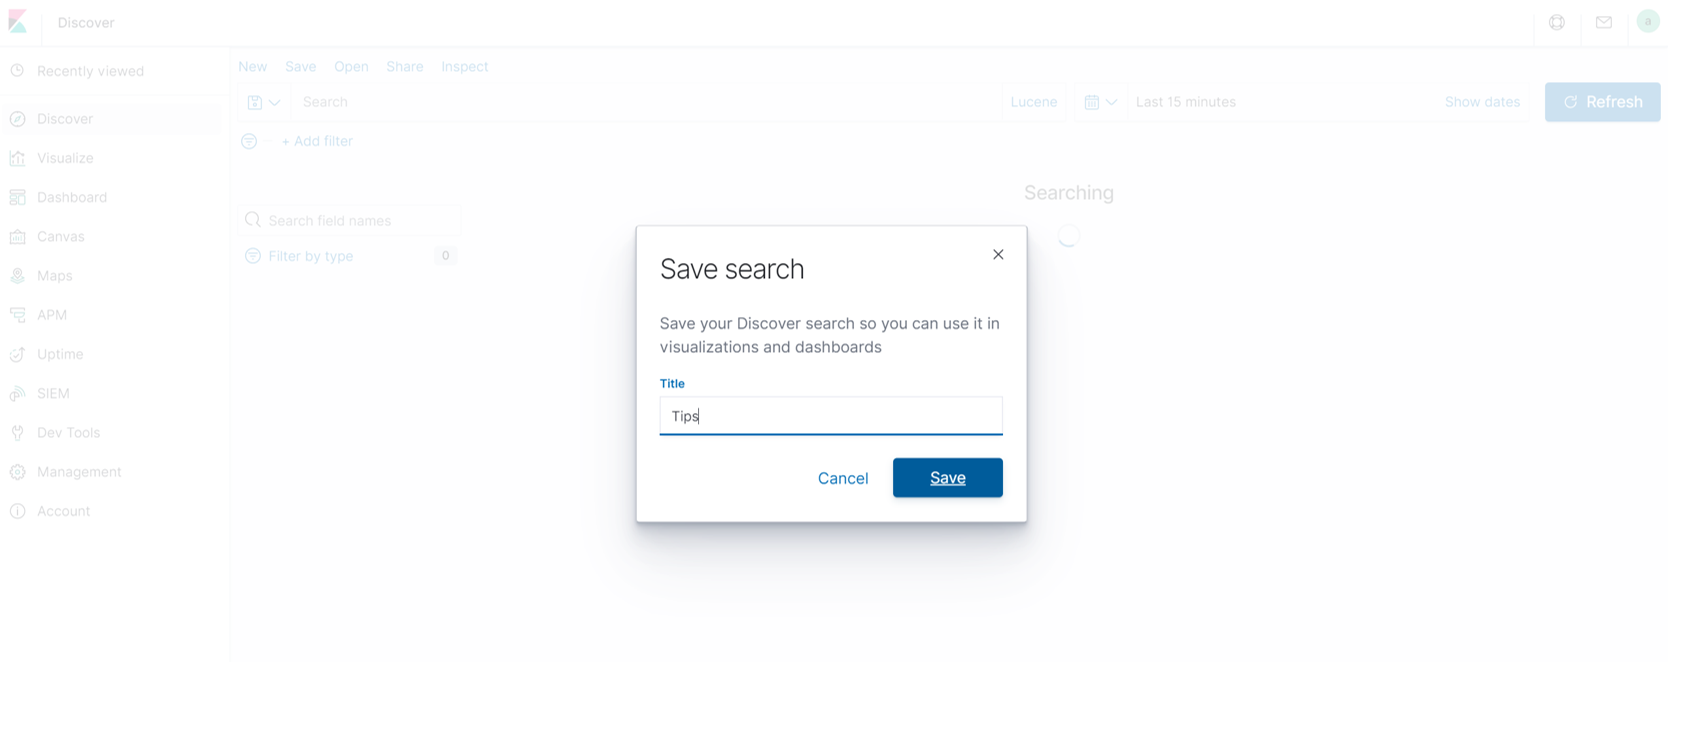
To save the data inside discover click on the
要将数据保存在发现中,请单击
保存 (Save)
button on top right corner as shown below:
右上角的按钮,如下所示:
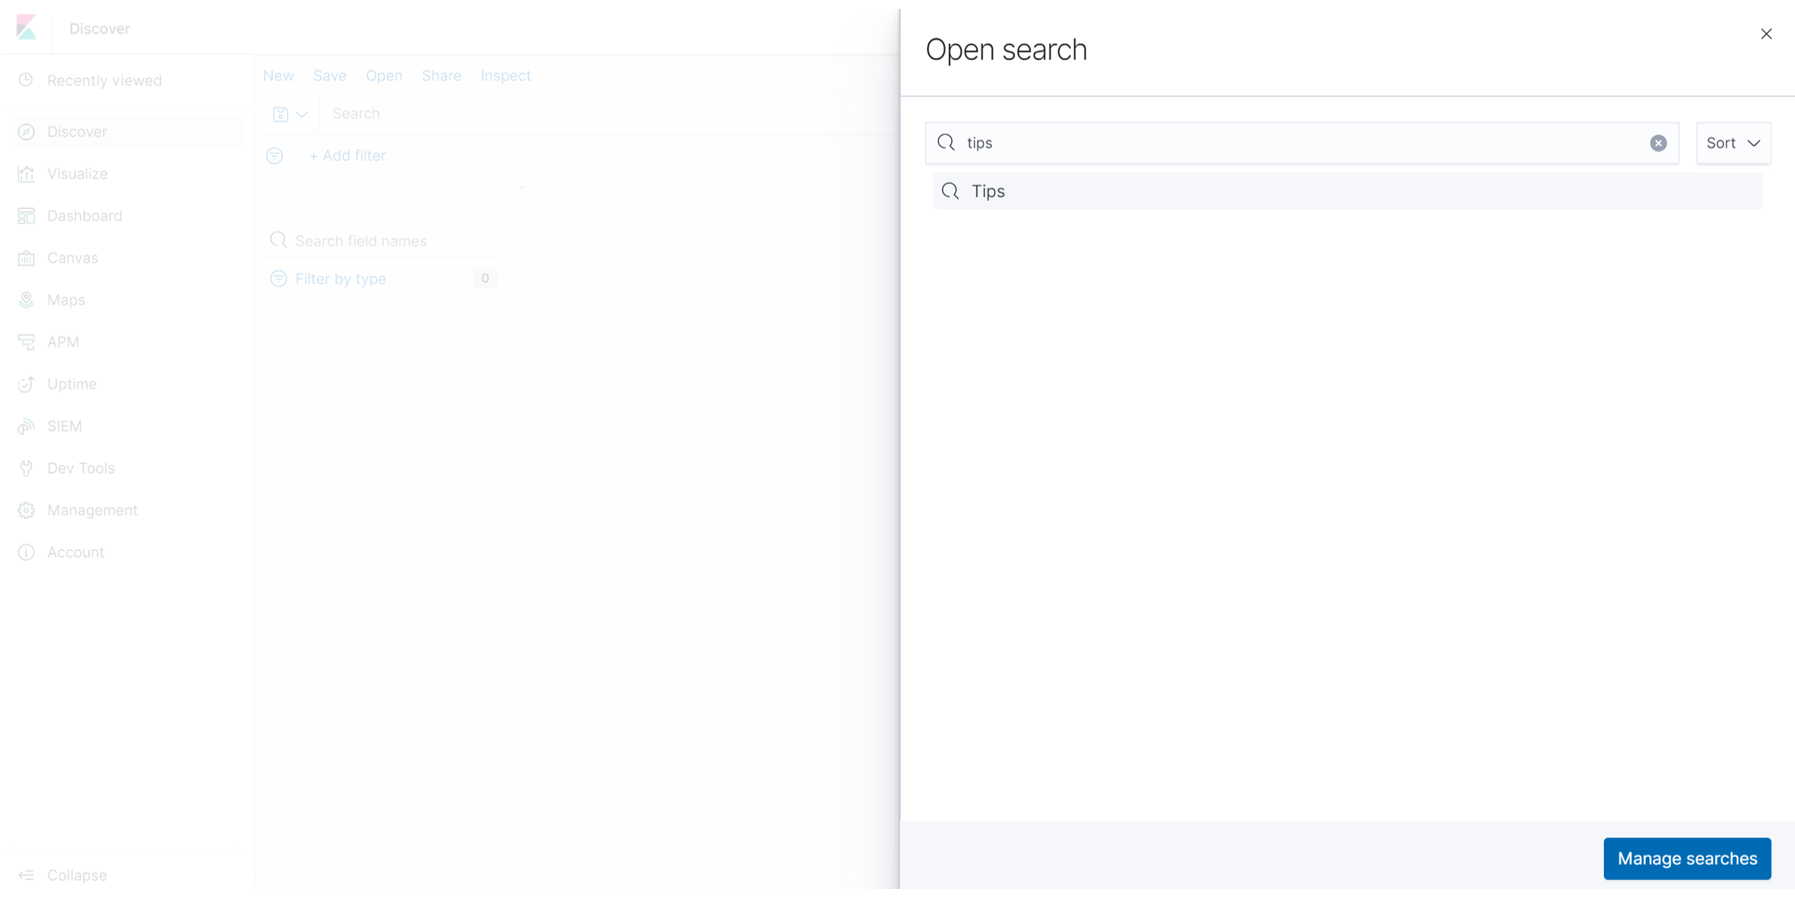
After saving you will be able to open it — just click on
保存后,您可以打开它-只需单击
打开 (Open)
button and input your saved search name:
按钮并输入您保存的搜索名称:
If you want to share the data with others use
如果您想与他人共享数据,请使用
分享 (Share)
button:
按钮:
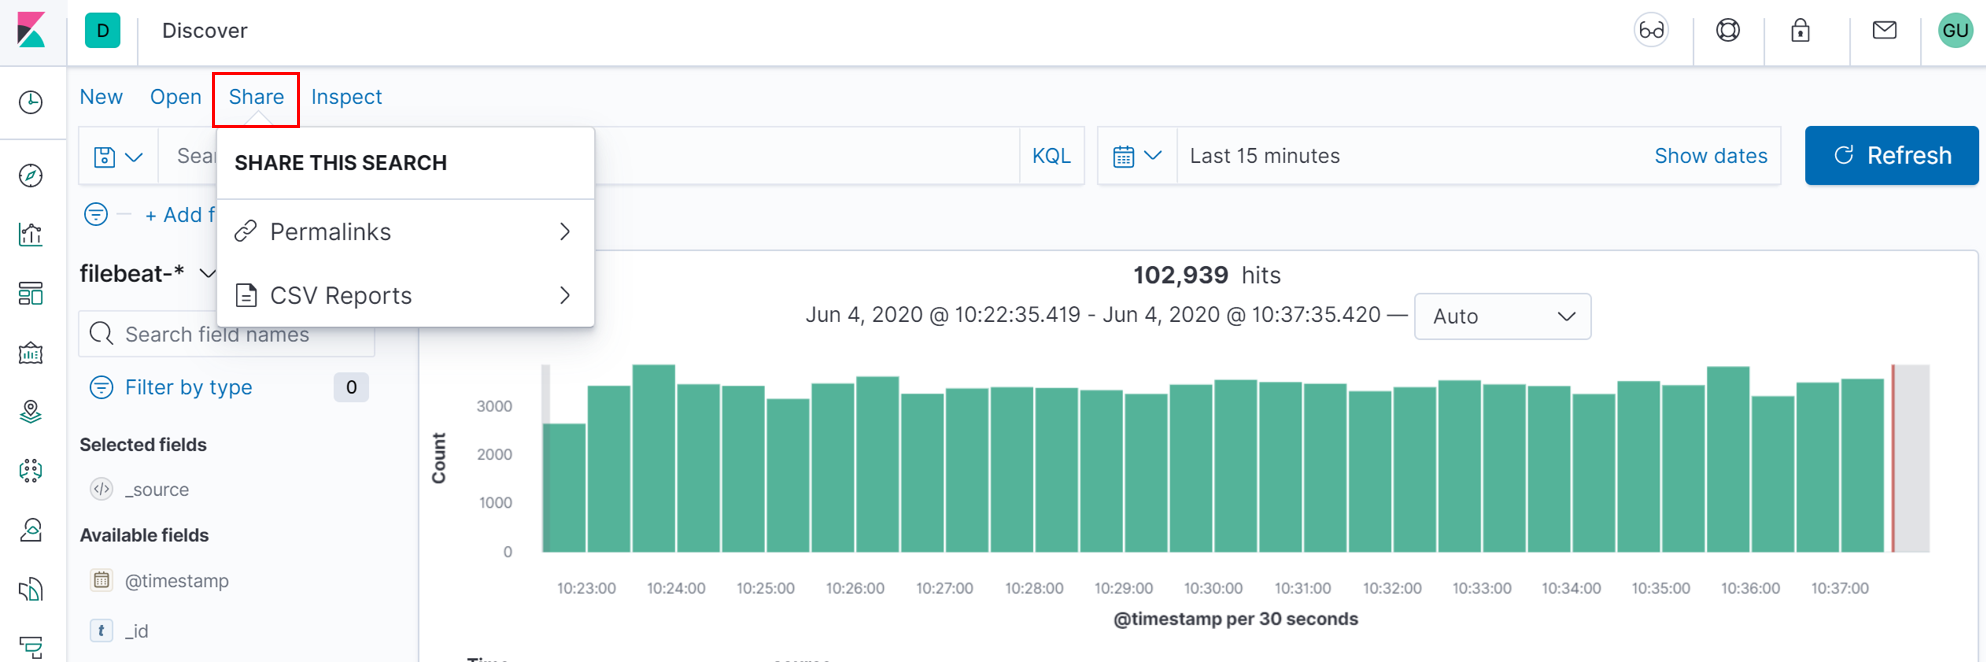
Choose
选择
固定链接 (Permalink)
.
。
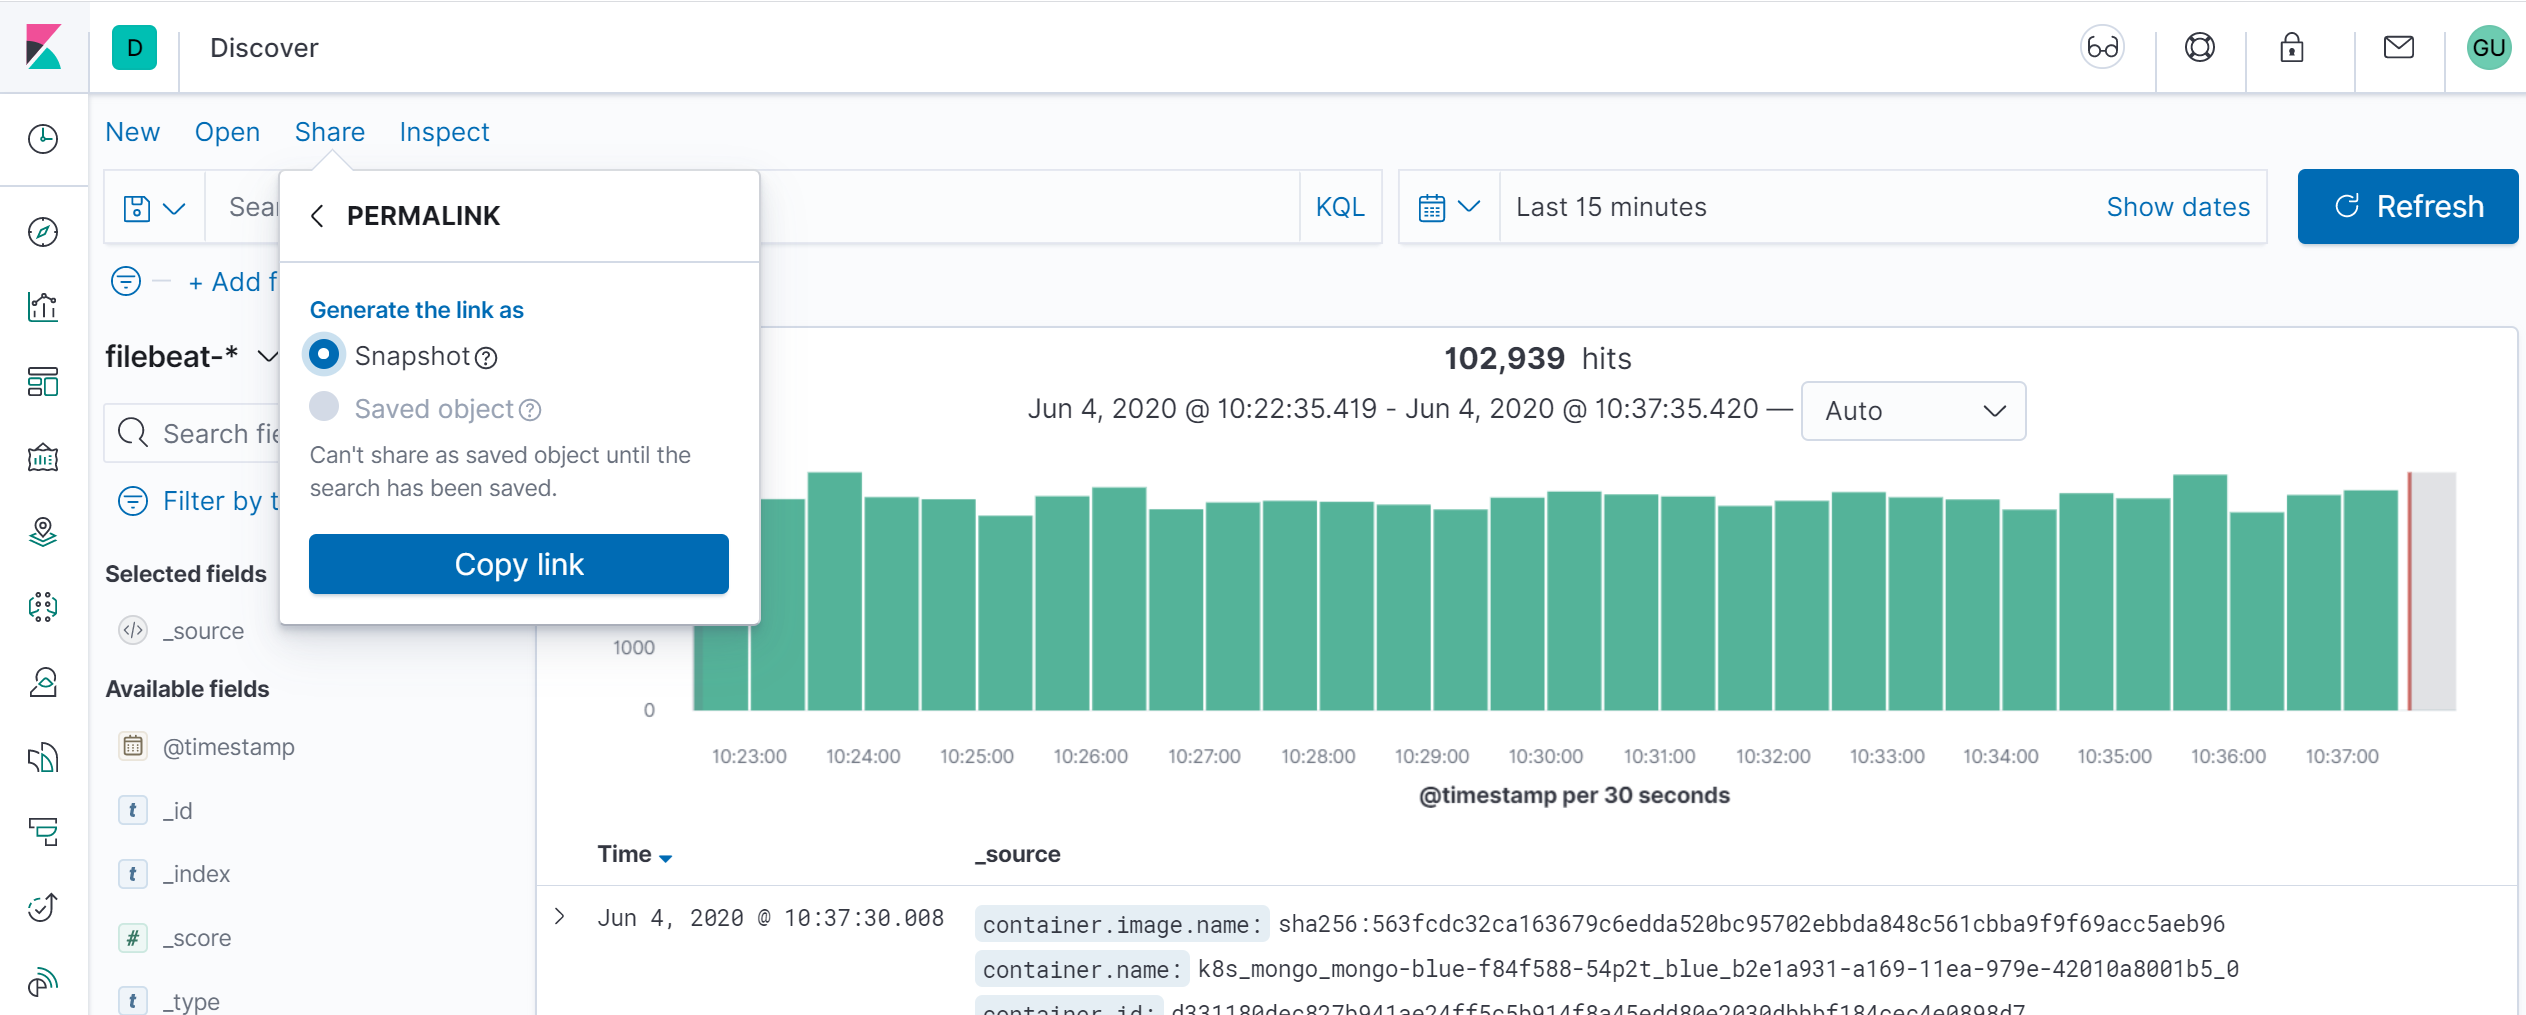
The
的
快照 ( Snapshot )
option will give a Kibana link which will display data available in the search currently.
选项将提供一个Kibana链接,该链接将显示当前搜索中可用的数据。
The
的
保存的对象 ( Saved object)
option will give a Kibana link which will display the recent data available in your search.
选项将提供一个Kibana链接,该链接将显示搜索中可用的最新数据。
If you turn on
如果打开
短网址 (Short URL)
option — new short url will be generated for your search (this option depends on access level).
选项-将会为您的搜索生成新的短网址(此选项取决于访问级别)。
搜索面板 (Search Panel)
You can use
您可以使用
搜索面板 (Search Panel)
to look for data inside the index. Examples are below:
在索引中查找数据。 示例如下:
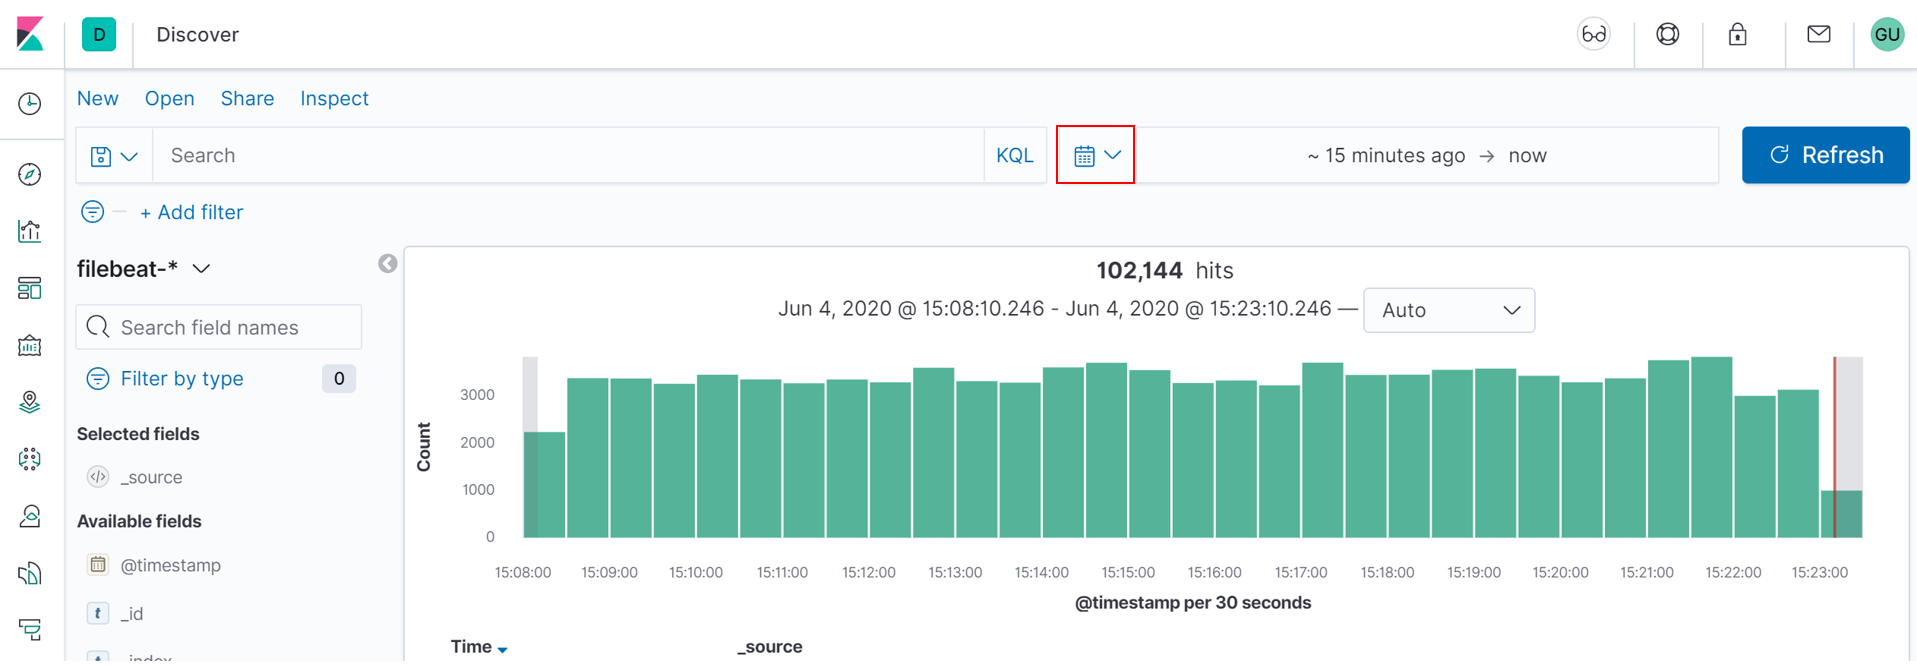
To see data for specific time range you need to click on
要查看特定时间范围内的数据,您需要点击
显示日期 (Show dates)
in the top right corner and than on calendar icon.
在右上角,然后在日历图标上。
You can choose between
您可以选择
快速选择 (Quick select)
,
,
常用的 (Commonly used)
,
,
最近使用的日期范围 (Recently used date ranges)
and
和
自动刷新 (Auto-refresh)
options.
选项。

With
用
快速选择 (Quick select)
option you may choose last or future period, define seconds, minutes, hours, months or years and than put preferable range in numbers.
选项,您可以选择上一个或将来的时间段,定义秒,分钟,小时,月或年,然后在数字上设置更合适的范围。
常用的 (Commonly used)
allows you to choose the time range from predefined options
允许您从预定义选项中选择时间范围
In
在
刷新每一 (Refresh every)
section you can set time interval in Kibana will auto-refresh the screen and get fresh data according to interval you set.
您可以在Kibana中设置时间间隔的部分将根据您设置的时间间隔自动刷新屏幕并获取新数据。
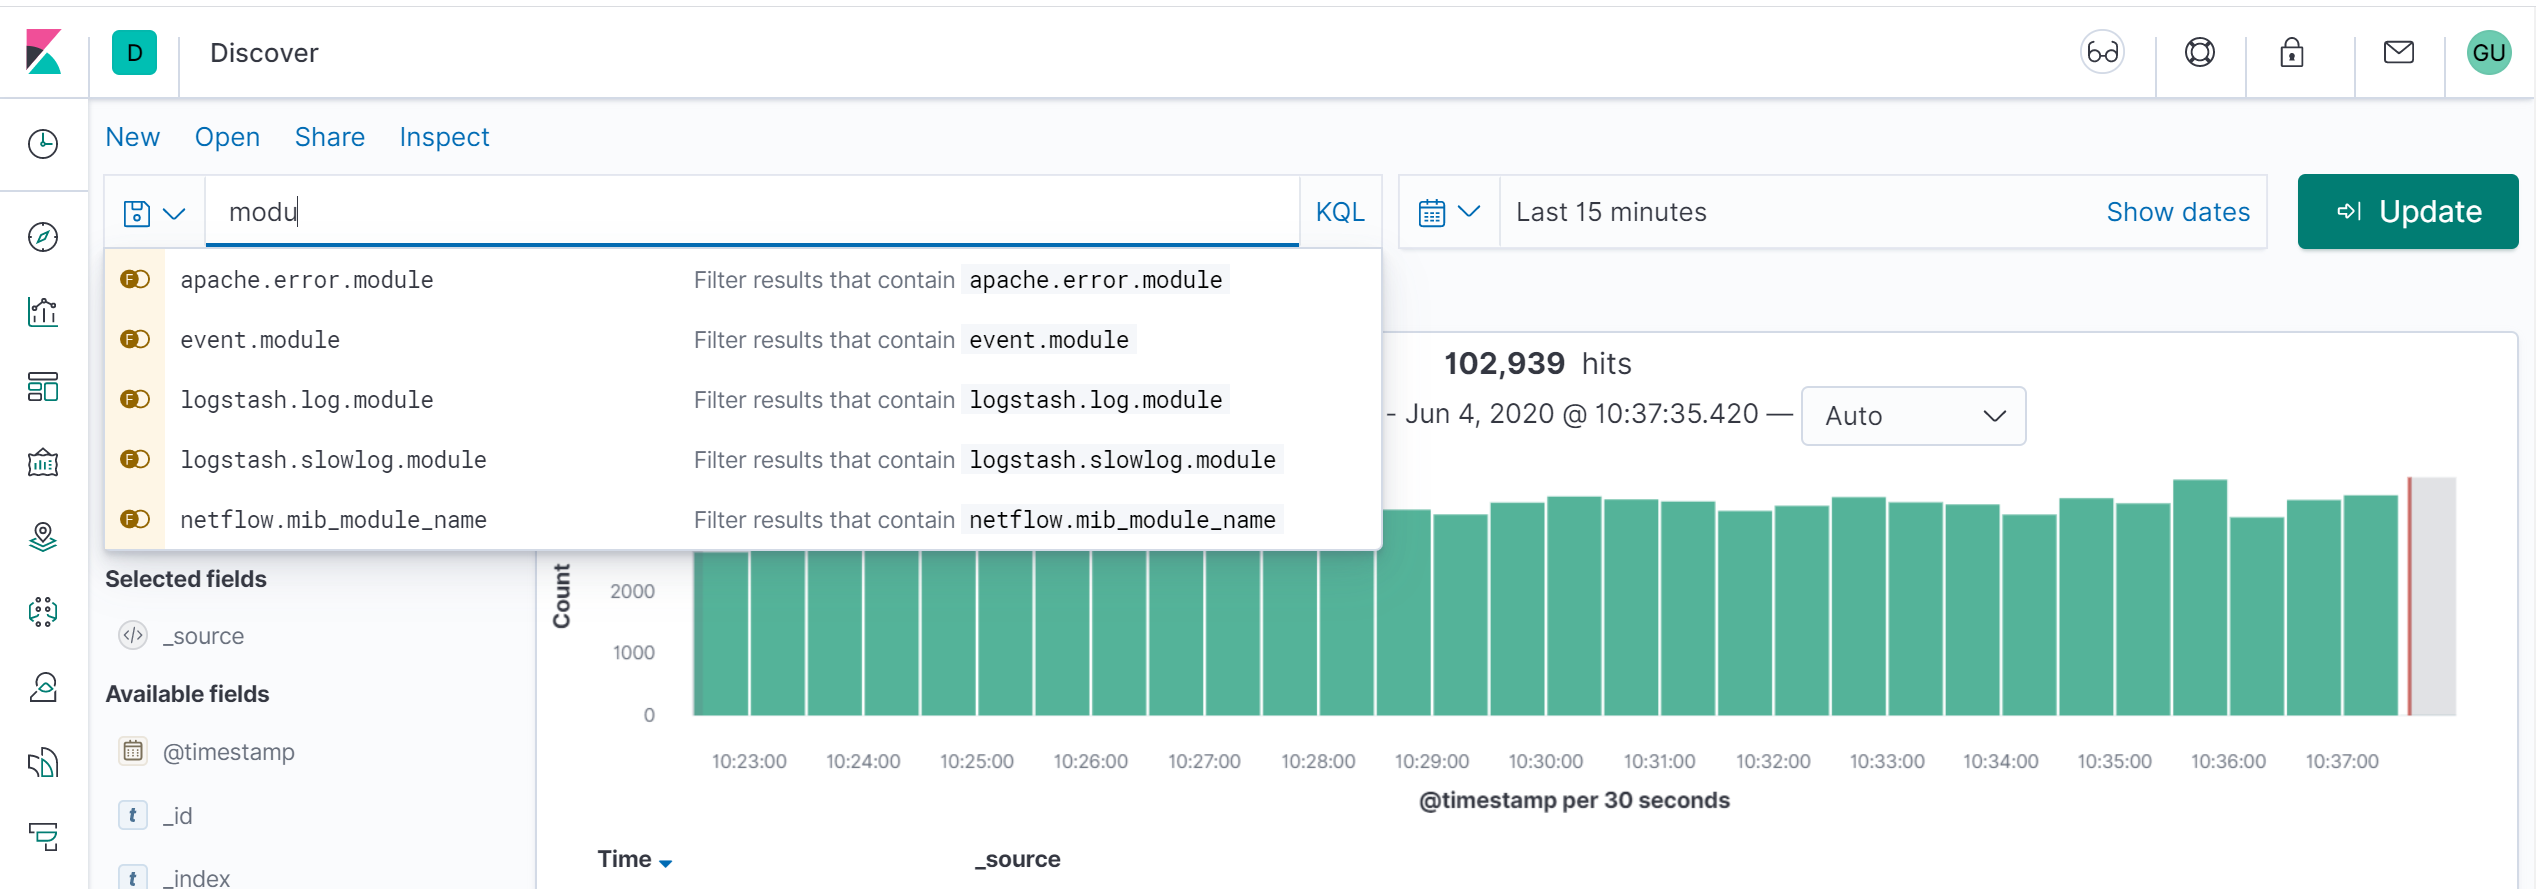
If you want to search by specific field in the list (event.module in our case), put
如果要按列表中的特定字段(在本例中为event.module)进行搜索,请输入
event.module:«kafka» (event.module: «kafka»)
in the search pane end push "
在搜索窗格中,按“
更新资料 (Update)
" button.
”按钮。
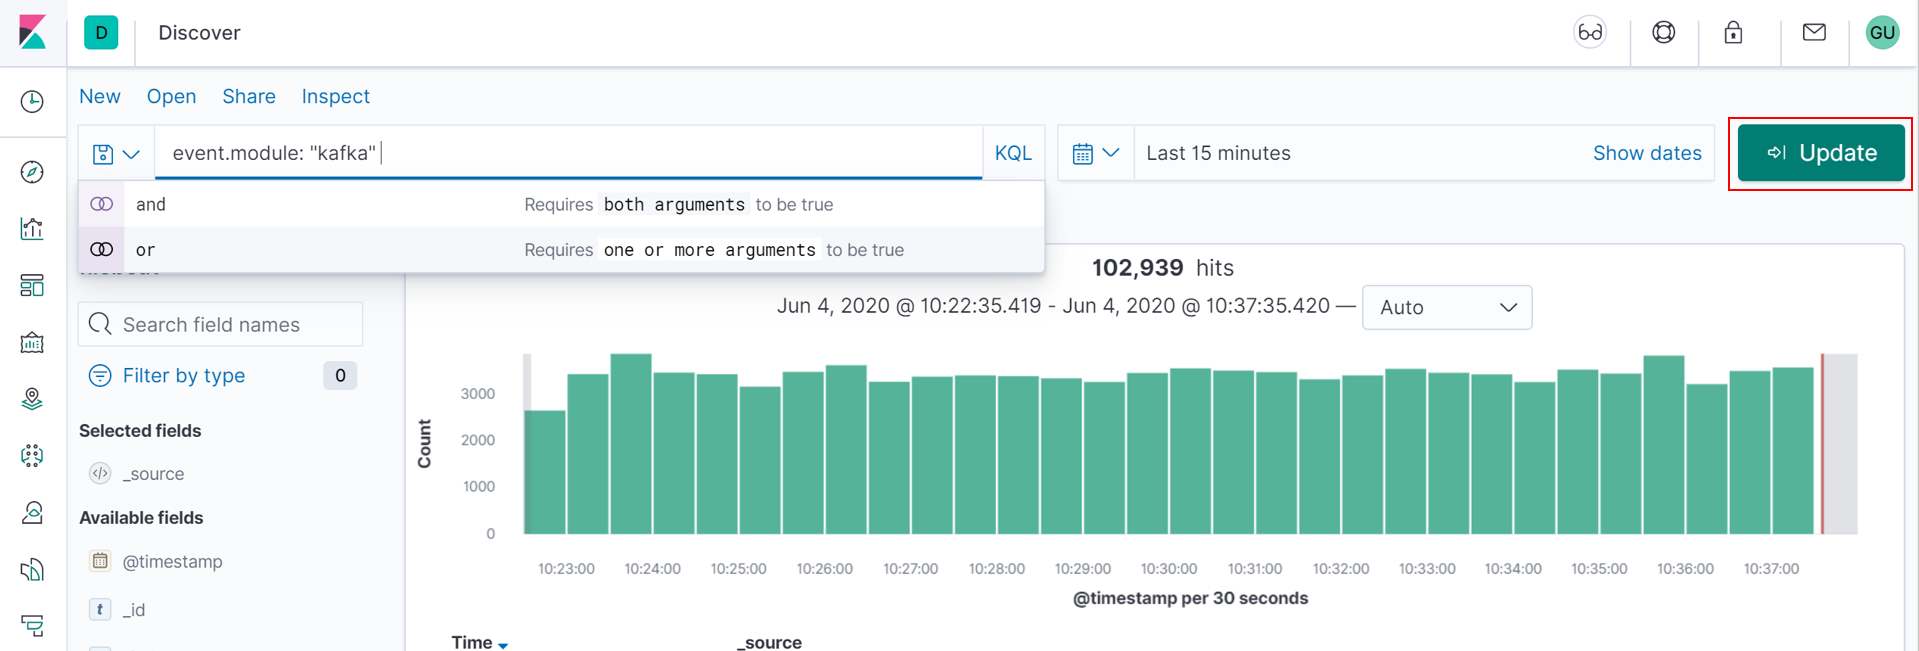
Writing search query is rather simple as it provides autocomplete — I only put
编写搜索查询非常简单,因为它提供了自动填充功能-我只说了
«modu» («modu»)
and received the list of available fields to filter by:
并收到可用字段列表进行过滤:
索引选择 (Index select)
By default for demo Kibana you will see page for
默认情况下, 演示版Kibana会显示
filebeat- * (filebeat-*)
index.
指数。
To choose another index press an
要选择另一个索引,请按
箭头 (arrow)
.
。

Also you may see such picture with message
你也会看到这样的图片和消息
“没有结果符合您的搜索条件” (“No results match your search criteria”)
:
:

That means you have no events matching the defined time period or filters. Adjust filters and the time range — it should fix the problem.
这意味着您没有符合定义的时间段或过滤器的事件。 调整过滤器和时间范围-应该可以解决问题。
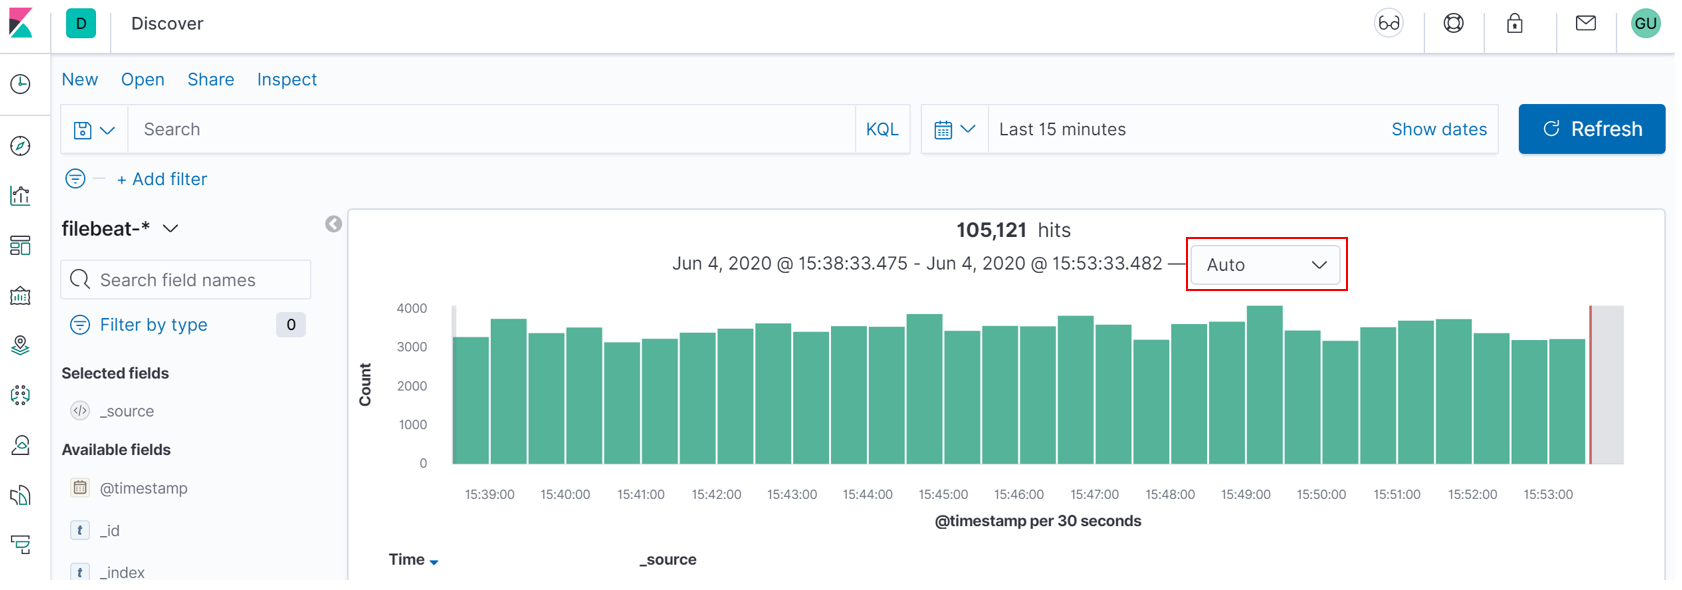
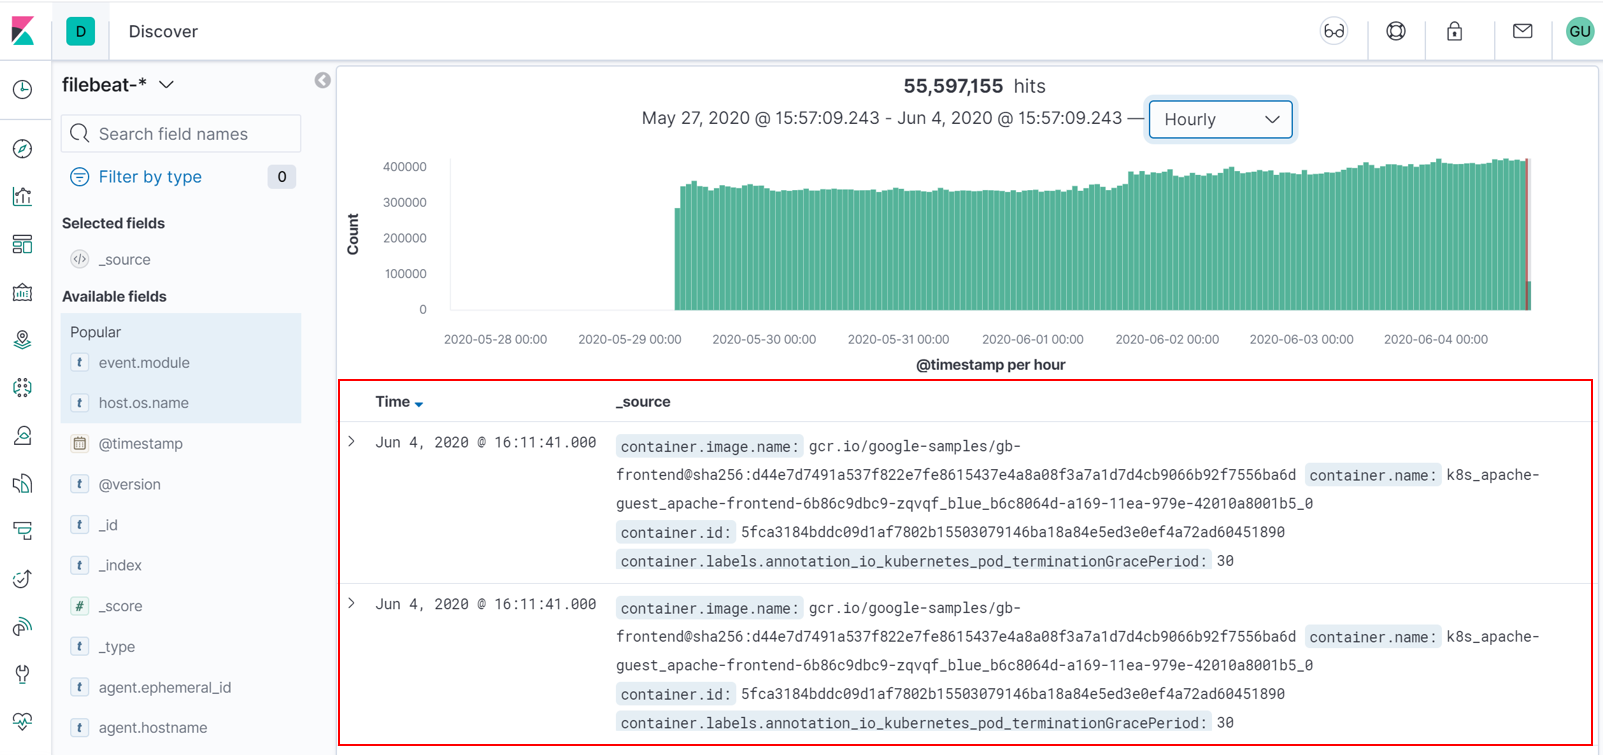
事件直方图 (Events histogram)
You can see the number of events per time interval on the histogram in the center of the screen.
您可以在屏幕中央的直方图中看到每个时间间隔的事件数。
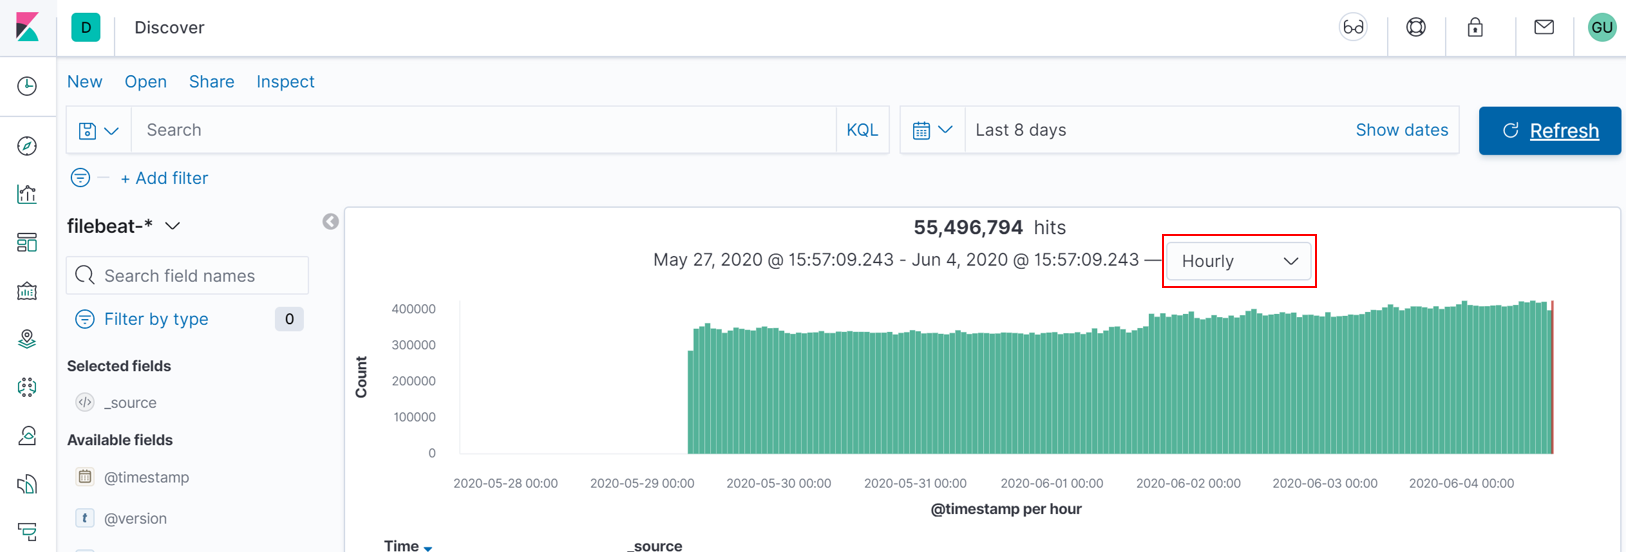
By default the number of events is shown using «auto» time granularity, but you may change it.
默认情况下,事件数是使用“自动”时间间隔显示的,但是您可以更改它。
Hourly:
每小时:
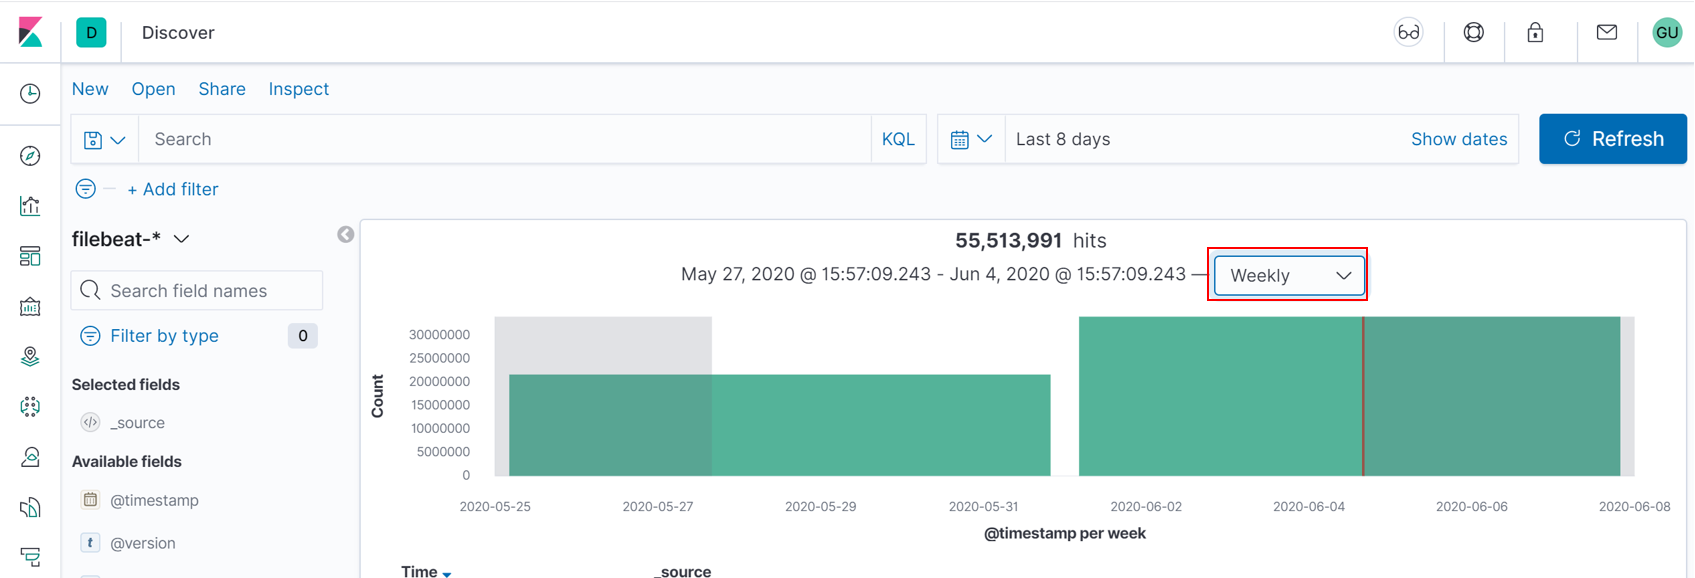
Weekly:
每周:
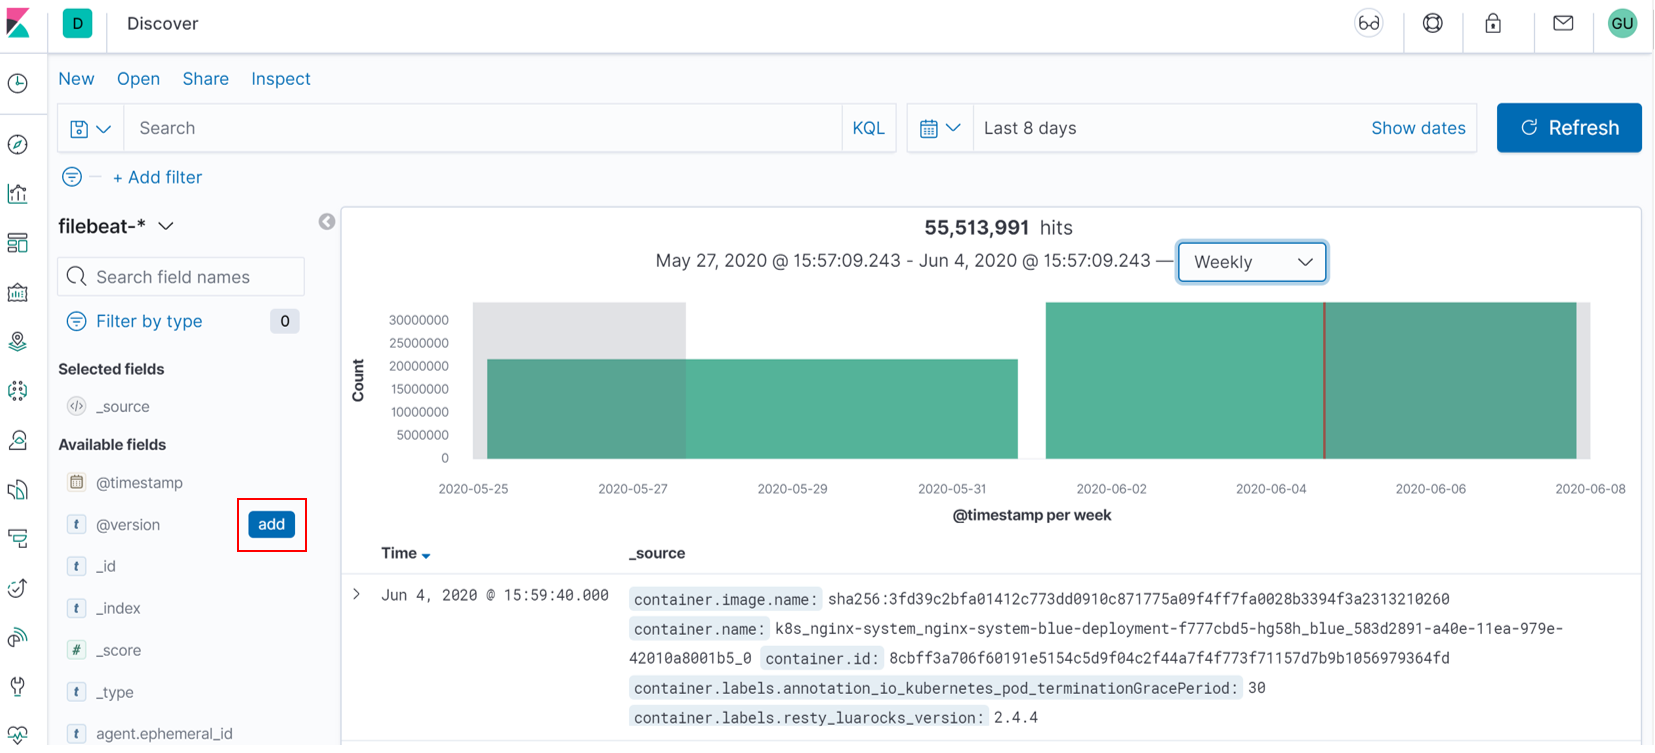
索引字段列表 (Index fields list)
All available fields are located on the left side of the screen:
所有可用字段位于屏幕左侧:
You can select the fields from available and add them to tabular mode. To do it just click on add button on the right:
您可以从可用字段中选择字段,并将其添加到表格模式。 为此,只需单击右侧的添加按钮:
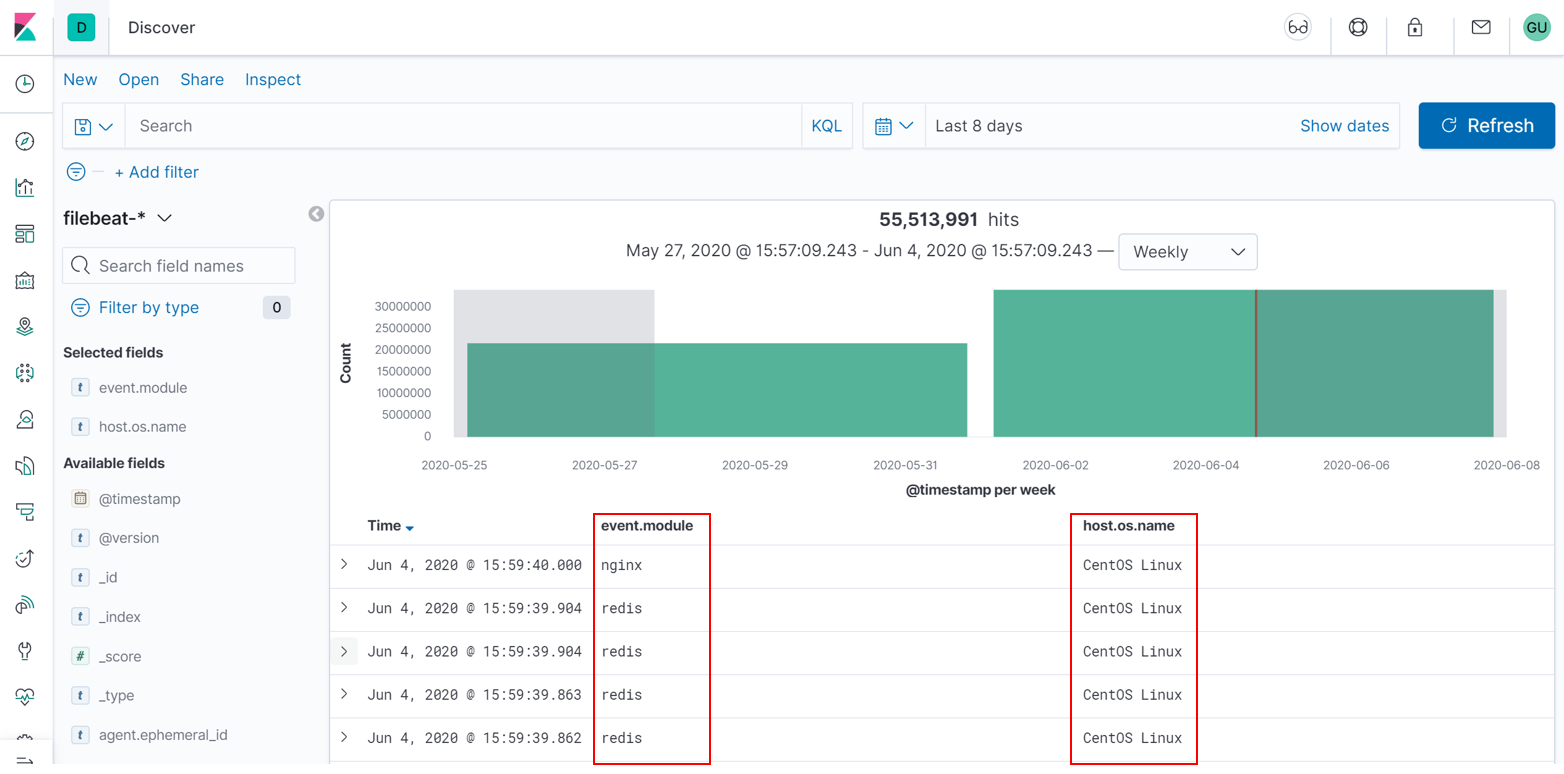
On the screenshot below 2 fields were added —
在下面的屏幕截图中,添加了2个字段-
event.module (event.module)
and
和
host.os.name (host.os.name)
:
:
活动面板 (Event panel)
All events are shown in row format.
所有事件均以行格式显示。
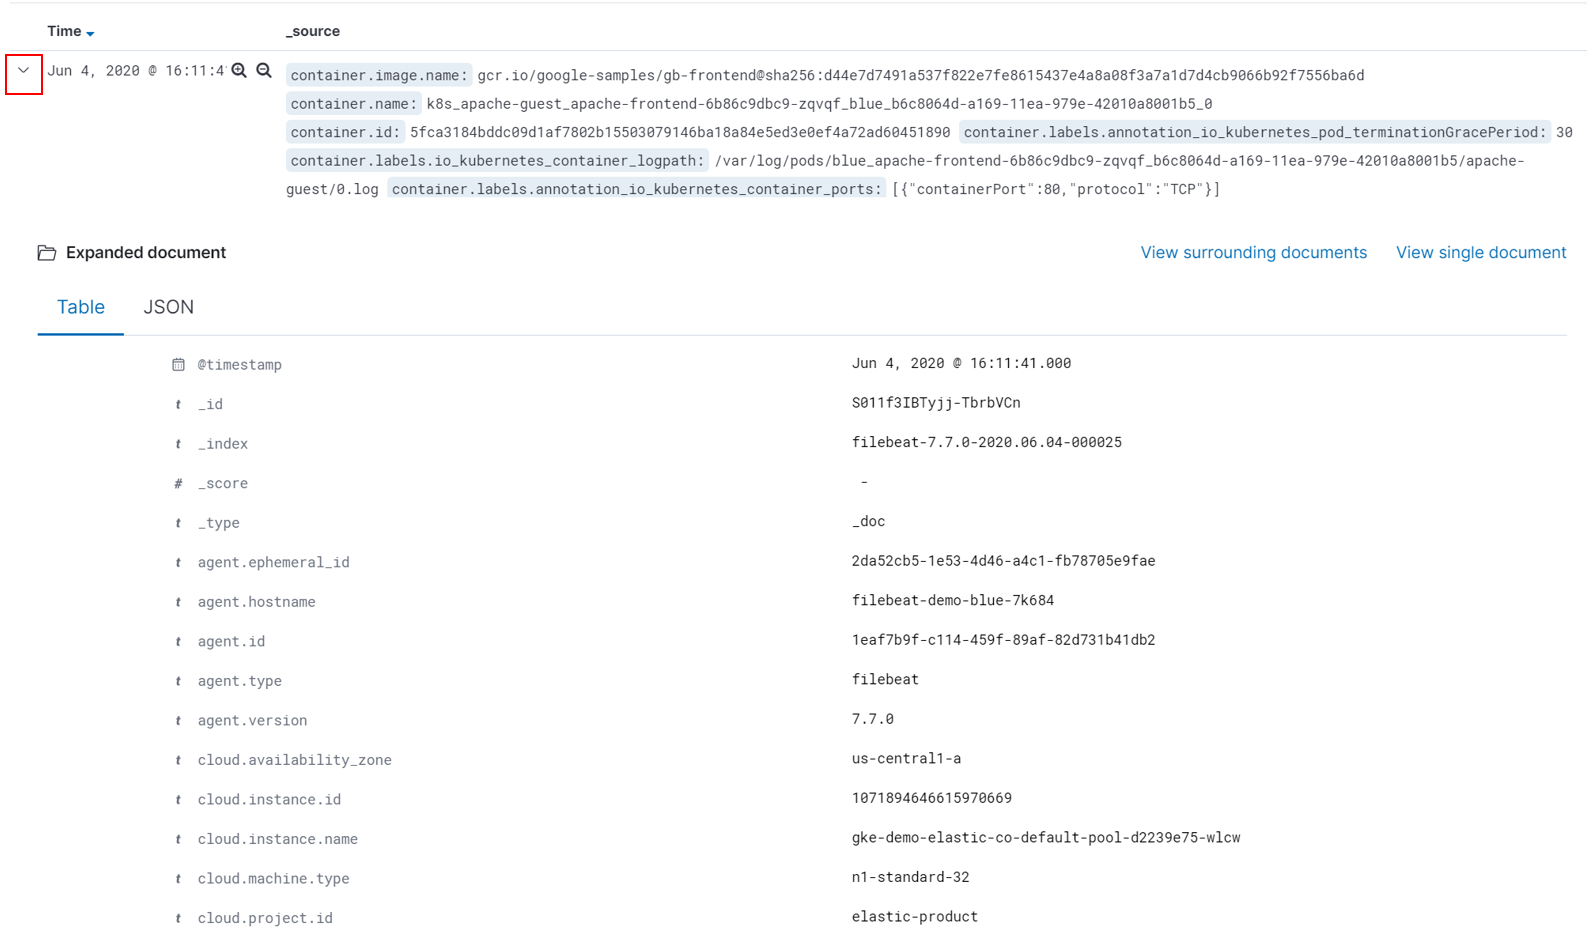
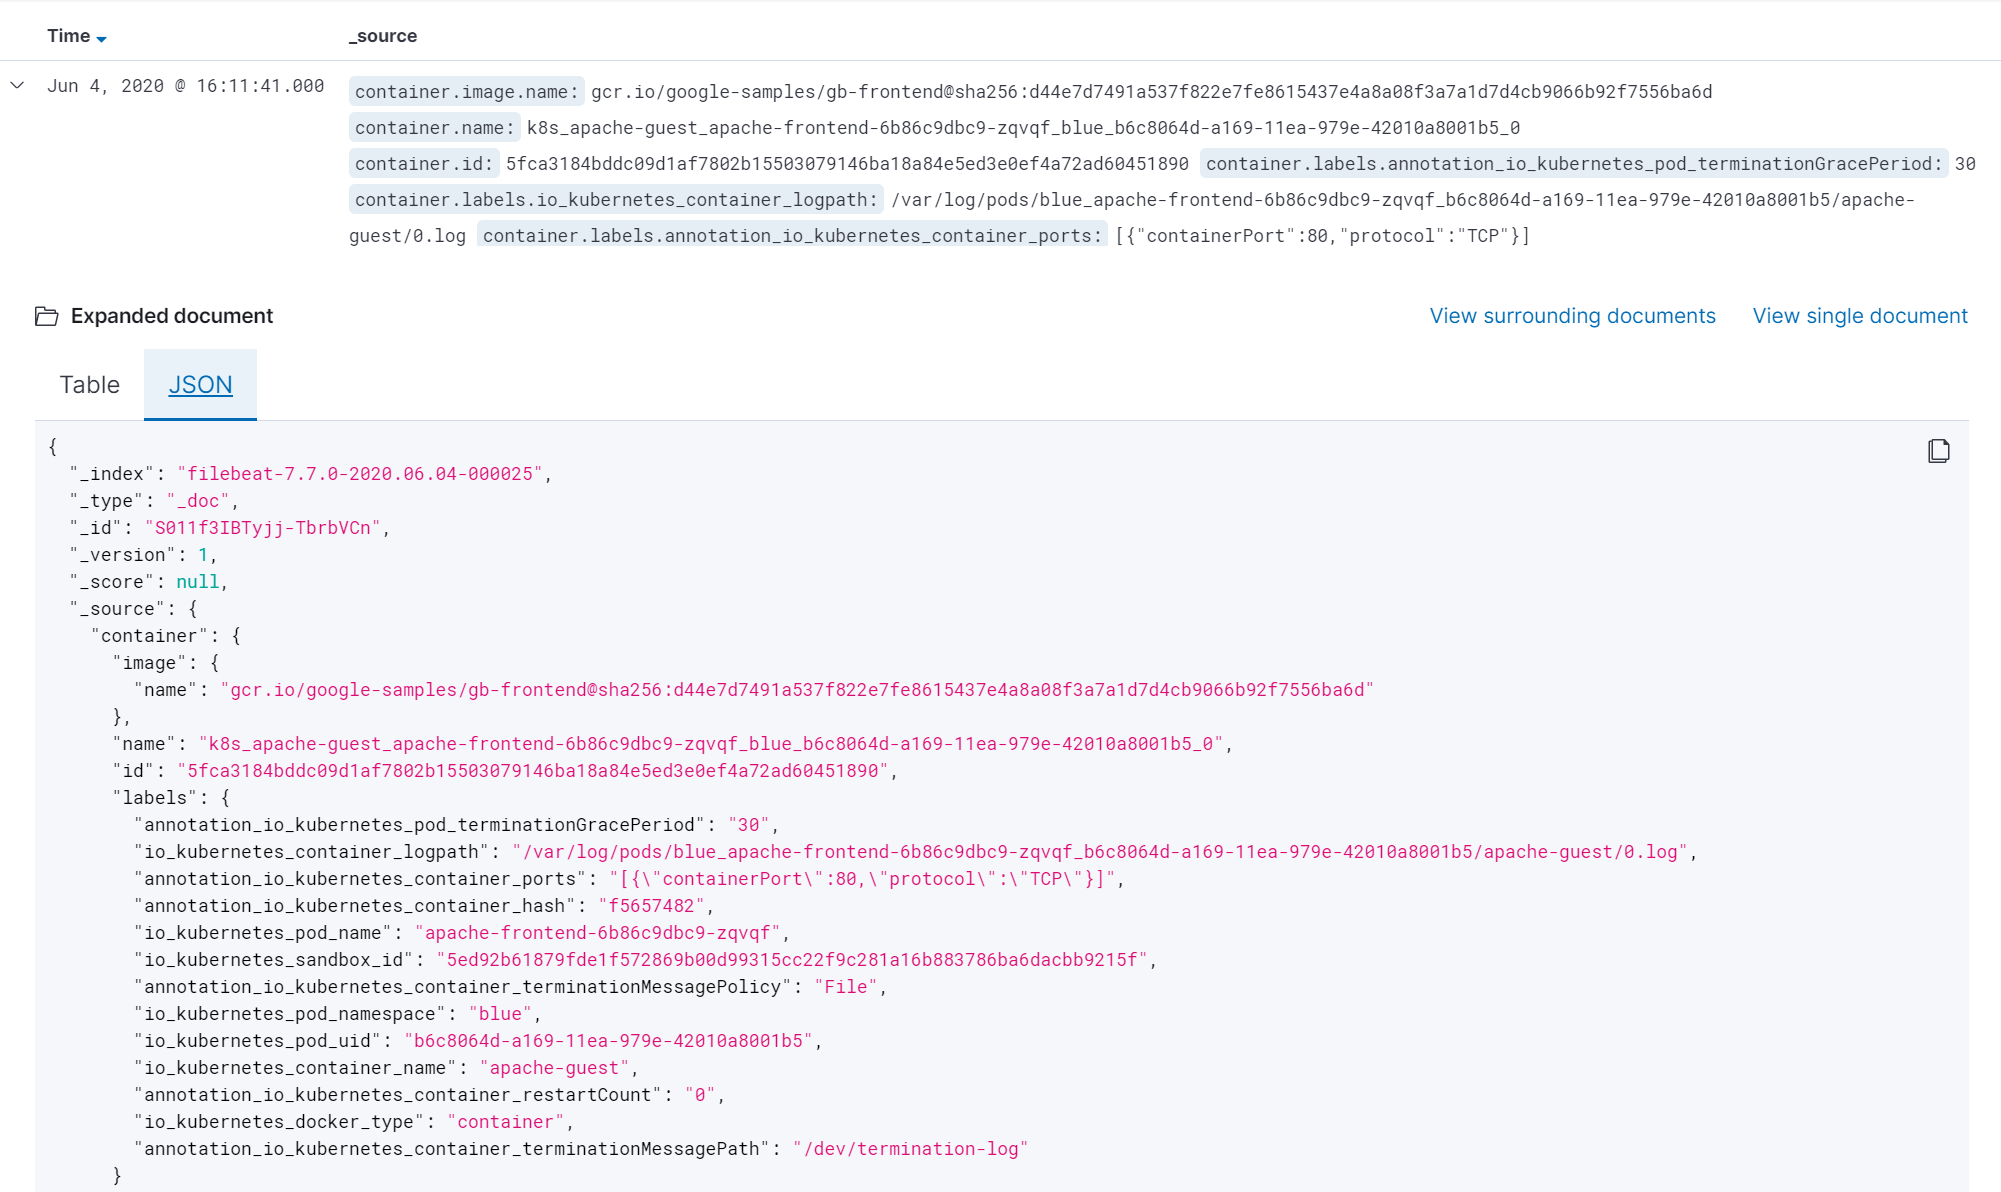
Click the arrow to expand the row and it will give you details in Table format or JSON format.
单击箭头展开该行,它将为您提供Table格式或JSON格式的详细信息。
Table mode:
表格模式:
JSON mode:
JSON模式:
That's all for today! I hope that you now have a basic understanding of how to use Kibana and view events in Discover mode.
今天就这些! 我希望您现在对如何使用Kibana和在“发现”模式下查看事件有基本的了解。
If you have any questions regading Kibana that may be covered in «Tips & Tricks» feel free to share your ideas in comments.
如果您对《基巴纳语》有任何疑问,而《技巧和窍门》可能会涉及这些问题,请随时在评论中分享您的想法。
有用的链接 (Useful links)
For those who would like to try Kibana you may use demo here
对于那些想尝试Kibana的人,您可以在此处使用演示
In case of other questions please read Kibana documentation
如有其他疑问,请阅读Kibana文档
Initial picture of elk was taken here
麋鹿的原始照片是在这里拍摄的
kibana 日志查询技巧


 1万+
1万+

 被折叠的 条评论
为什么被折叠?
被折叠的 条评论
为什么被折叠?
 到【灌水乐园】发言


