


bmon linux

With the bmon Linux application, you can see the bandwidth usage on your network connections. However, understanding the finer details requires some detective work, so we’ve done it for you!
使用bmon Linux应用程序,您可以查看网络连接上的带宽使用情况。 但是,了解更详细的信息需要进行一些侦探工作,因此我们已为您完成了!
bmon如何运作 (How bmon Works)
Dynamic graphs and real-time statistics that show the activity on your various network interfaces can give you a great heads-up on your network’s performance and bandwidth consumption. This is exactly what bmon provides for you, right in a terminal window.
动态图和实时统计数据显示了您各种网络接口上的活动,可以使您对网络的性能和带宽消耗有个深刻的了解。 这正是bmon在终端窗口中为您提供的 。
You can glance at the graphs now and then, just as you would the speedometer in your car. Likewise, if something on your vehicle needs to be investigated, a mechanic might hook it up to a diagnostic system and check the readouts. bmon has a similar of detailed readouts.
您可以不时浏览一下图表,就像您车上的速度表一样。 同样,如果需要检查车辆上的某些物品,那么技工可能会将其连接到诊断系统并检查读数。 bmon具有类似的详细读数。
It has to be said, though—bmon command’s statistics can be baffling at first. For example, there are three called “Ip6 Reasm/Frag.” What’s up with that?
不过必须要说的是bmon命令的统计信息起初可能令人困惑。 例如,有三个称为“ Ip6重新分配/碎片”。 那是怎么回事?
Nevertheless, once you’ve cracked the code, the command’s readouts are invaluable if you want a more detailed understanding of your network traffic.
不过,一旦您破解了代码,如果您想更详细地了解网络流量,该命令的读数将非常宝贵。
We’ve put in the work for you, and even checked the source code to get to the bottom of some of these. Thankfully, everything else about bmon is reasonably simple.
我们已经为您完成了工作,甚至检查了源代码以深入了解其中的一些内容。 值得庆幸的是,关于bmon所有其他事情都相当简单。
安装bmon (Installing bmon)
To install bmon on Ubuntu, use this command:
要在Ubuntu上安装bmon ,请使用以下命令:
sudo apt-get install bmon

To install on Fedora, type the following:
要在Fedora上安装,请键入以下内容:
sudo dnf install bmon

For Manjaro, the command is the following:
对于Manjaro,命令如下:
sudo pacman -Sy bmon

bmon显示 (The bmon Display)
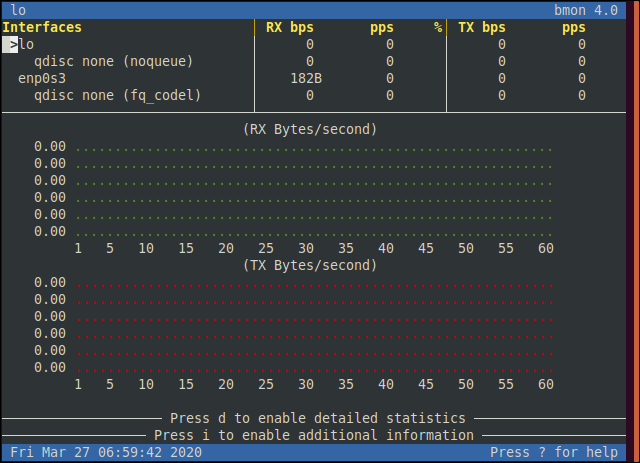
Type bmon and hit Enter to start the program. The bmon display is split into several panes. The top three are labeled “Interfaces,” “RX,” and “TX.” The central pane displays the detailed statistics and graphs.
键入bmon并按Enter键以启动程序。 bmon显示分为几个窗格。 前三个标记为“接口”,“ RX”和“ TX”。 中央窗格显示详细的统计信息和图形。
The “Interfaces” pane shows you the network interfaces with which your computer is equipped. It also shows the queueing discipline (qdisc) each network interface is using (more about these later).
“接口”窗格显示您的计算机配备的网络接口。 它还显示了每个网络接口正在使用的排队规则(qdisc)(稍后将详细介绍)。
The “RX” pane displays the received bits per second and packets per second for each interface and its queue. The “TX” pane shows the transmitted bits per second and packets per second for each interface and its queue.
“ RX”窗格显示每个接口及其队列的每秒接收的比特数和每秒的数据包数。 “ TX”窗格显示每个接口及其队列的每秒传输位和每秒数据包。
On our computer, we only have two interfaces installed: the loopback interface (also called loopback adapter), and the wired ethernet adapter. The loopback interface is called “lo,” and the ethernet interface is called “enp0s3.”
在我们的计算机上,我们仅安装了两个接口: 回送接口 (也称为回送适配器)和有线以太网适配器。 环回接口称为“ lo”,而以太网接口称为“ enp0s3”。
The ethernet adapter on your machine might have a different name. If you’re using a laptop, you’ll see a wireless adapter, too, and its name will probably begin with “wl.”
您计算机上的以太网适配器的名称可能不同。 如果您使用的是笔记本电脑,则还会看到无线适配器,其名称可能以“ wl”开头。
bmon displays information about the network interface that’s currently selected. The selected interface is the one with a highlighted greater-than sign (>) next to it. You can press the Up and Down Arrows to move the greater-than sign and select the interface you want to monitor. We chose the ethernet adapter.
bmon显示有关当前所选网络接口的信息。 所选界面旁边是突出显示的大于号( > )。 您可以按向上和向下箭头移动大于号,然后选择要监视的界面。 我们选择了以太网适配器。
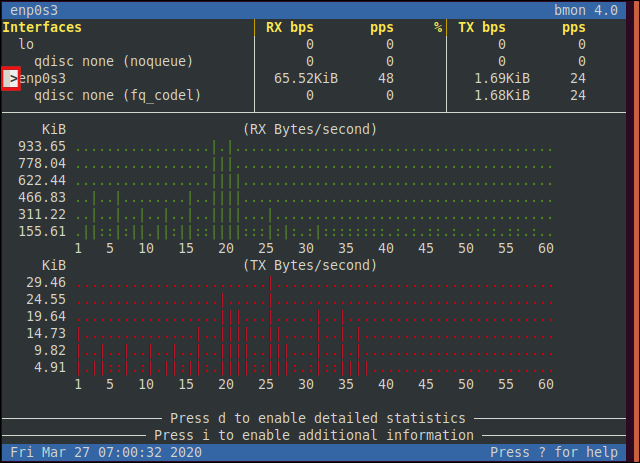
Now that we’re on an active network interface, we see some activity in the graphs and readouts. If you’re not seeing any graphs, stretch the terminal window downward.
现在我们处于活动的网络接口上,我们在图形和读数中看到了一些活动。 如果没有看到任何图形,请向下拉伸终端窗口。
Press the Left and Right Arrow keys to change the statistic being graphed. For some graphs, you’ll have to press H before they’ll populate; those that require this will tell you so.
按左右箭头键更改所绘制的统计信息。 对于某些图形,您必须先按H键,然后才能填充它们。 那些需要这样做的人会告诉你。
To see the statistics for the network interface, stretch the terminal window until it’s tall enough to show them, and then press D to display them. If you press I (for Info), you see a small amount of additional information.
要查看网络接口的统计信息,请拉伸终端窗口,直到它足够高以显示它们,然后按D来显示它们。 如果按I(获取信息),则会看到少量其他信息。
If you maximize the terminal window, it displays multiple graphs. Press Less Than (<) and Greater Than (>) to add or remove pairs of graphs. If you press G, it toggles the display of graphs on and off, altogether.
如果最大化终端窗口,它将显示多个图形。 按小于(<)和大于(>)来添加或删除图形对。 如果按G,它将完全切换图的显示。
When you press the question mark (?), you see the “Quick Reference” help screen with common keystrokes.
当您按下问号(?)时,您会看到带有常见按键的“快速参考”帮助屏幕。
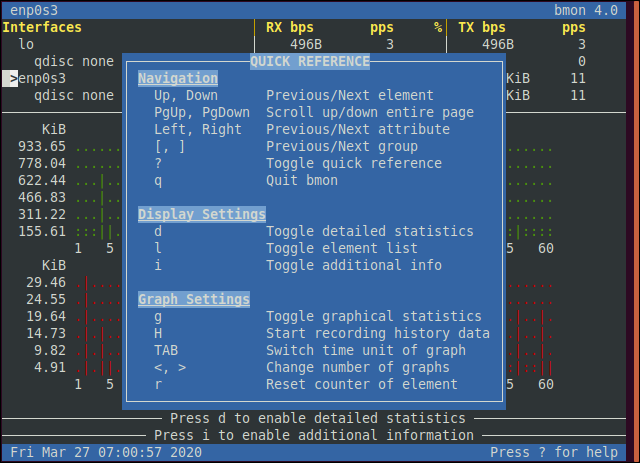
Press the question mark (?) again to close the “Quick Reference” screen.
再次按问号(?)以关闭“快速参考”屏幕。
详细统计 (The Detailed Statistics)
If your terminal window is tall and wide enough (stretch it out, if it isn’t), you can press “D” to toggle the detailed view on and off.
如果您的终端窗口足够高且足够宽(如果没有,则将其拉伸),您可以按“ D”以打开或关闭详细视图。

The number of columns you see depends on the width of the terminal window. In a standard 80-column terminal window, you’ll see two. The wider the window, the more columns you see. You don’t get more statistics with a wider window, though; you’ll still see the same set of figures. But the columns will be shorter.
您看到的列数取决于终端窗口的宽度。 在标准的80列终端窗口中,您将看到两个。 窗口越宽,您看到的列越多。 但是,您不会在更大的窗口范围内获得更多统计信息; 您仍然会看到相同的一组数字。 但是列会更短。
The top entry in each column might lead you to think the one on the left shows information in bytes, while the one on the right shows information in packets. However, that’s not the case.
每列的顶部条目可能使您认为左侧的信息以字节为单位显示信息,而右侧的信息以包为单位显示信息。 但是,事实并非如此。
Each column holds a set of statistics. The name of the value, and the received (RX) and transmitted (TX) values are shown for each statistic. If any values appear as a hyphen (-), it means that statistic isn’t recorded for that direction.
每列包含一组统计信息。 将为每个统计信息显示值的名称以及已接收( RX )和已发送( TX )的值。 如果有任何值显示为连字符( - ),则表示未记录该方向的统计信息。
Some of the stats are inward (received) or outward (transmitted) only. For example, a hyphen (-) in the transmitted column indicates that statistic is invalid for outgoing packets, and will only apply to incoming packets. The top line shows the received and transmitted traffic in bytes (on the left) and packets (on the right).
一些统计信息仅是向内(接收)或向外(传输)的。 例如,传输列中的连字符( - )表示该统计信息对于传出数据包无效,仅适用于传入数据包。 第一行以字节(左侧)和数据包(右侧)显示接收和发送的流量。
All of the other statistics are listed in alphabetical order, hopping from column to column. Several of them share the same name. We’ll explain what they all mean below. We’ve also spelled out abbreviated names. If IPv6 isn’t mentioned, that statistic refers to IPv4.
所有其他统计信息均按字母顺序列出,从一列跳到另一列。 其中几个共享相同的名称。 我们将在下面解释它们的全部含义。 我们还拼出了缩写名称。 如果未提及IPv6,则该统计信息指的是IPv4。
The statistics in the left column are as follows:
左栏中的统计信息如下:
Bytes: Traffic in bytes.
字节:流量(以字节为单位)。
Abort Error: A count of abort errors. Somewhere in the connection path between the source and the destination, a piece of software caused a connection to abort.
中止错误:中止错误计数。 在源和目标之间的连接路径中的某个位置,某个软件导致连接中断。
Collisions: A count of collision errors. Two or more devices have tried to send a packet simultaneously. This shouldn’t be a problem in a full-duplex network.
碰撞:碰撞错误计数。 两个或更多设备尝试同时发送数据包。 在全双工网络中这应该不是问题。
CRC Errors: A count of cyclic redundancy check errors.
CRC错误: 循环冗余校验错误的计数。
Errors: The total count of errors.
错误:错误总数。
Frame Error: A count of frame errors. A frame is a network container for a packet. An error means malformed frames were detected.
ICMPv6: The number of Internet Control Message Protocol v6 traffic packets.
ICMPv6: Internet控制消息协议 v6流量数据包的数量。
ICMPv6 Errors: A count of ICMP v6 errors.
ICMPv6错误: ICMP v6错误的计数。
Ip6 Broadcast: A count of IPv6 Broadcasts, which are sent to all devices on the network.
Ip6广播:发送到网络上所有设备的IPv6 广播计数。
Ip6 CE Packets: CE stands for “customer edge.” This usually applies to routers. They connect with the provider edge (PE) of the connectivity service to which the customer subscribes.
Ip6 CE数据包: CE代表“ 客户边缘” 。 这通常适用于路由器。 它们与客户订阅的连接服务的提供商边缘 (PE)连接。
Ip6 Delivers: The count of incoming IPv6 packets.
Ip6交付:传入IPv6数据包的计数。
Ip6 ECT(1) Packets: An Explicit Congestion Notification (ECN) allows either end of a network connection to alert the other of impending congestion. Packets are marked with a flag that serves as the warning. The receiving end can reduce transmission rates to try to avoid congestion and possible packet loss. ECN-Capable Transport (ECT) packets are marked with a flag to indicate they’re being delivered via an ECN Capable Transport. This allows intermediate routers to react accordingly. Type 1 ECN packets tell the receiving end to enable ECN and add it to outgoing transmissions.
Ip6 ECT(1)数据包: 显式拥塞通知 (ECN)允许网络连接的任一端向即将发生的拥塞发出警报。 数据包标记有作为警告的标志。 接收端可以降低传输速率,以避免拥塞和可能的数据包丢失。 支持ECN的传输(ECT)数据包带有标记,以指示它们正在通过支持ECN的传输进行传输。 这允许中间路由器做出相应的React。 类型1 ECN数据包告诉接收端启用ECN并将其添加到传出传输中。
Ip6 Header Errors: The count of packets with errors in the IPv6 Header.
Ip6标头错误: IPv6标头中有错误的数据包计数。
Ip6 Multicast packets: The count of IPv6 Multicast (a form of broadcast) packets.
Ip6组播数据包: IPv6 组播 (广播的一种形式)数据包的计数。
Ip6 Non-ECT Packets: The count of IPv6 packets not flagged as ECT(1).
Ip6非ECT数据包:未标记为ECT(1)的IPv6数据包的计数。
Ip6 Reassembly/Fragment OK: The count of IPv6 packets that were fragmented due to size and successfully reassembled upon receipt.
Ip6重组/分段正常:由于大小而被分段并在接收时成功重组的IPv6数据包的计数。
Ip6 Reassembly Timeouts: The count of IPv6 packets that were fragmented due to size, but failed to be reassembled upon receipt because of timeouts.
Ip6重组超时:由于大小而被分段但由于超时而未能在接收时重组的IPv6数据包的计数。
Ip6 Truncated Packets: The count of truncated packets. When an IPv6 packet is transmitted, it can be flagged as a candidate for truncation. If any intermediate routers can’t handle the packet because it exceeds the maximum transmission unit (MTU), the router truncates the packet, marks it as such, and forwards it on to the destination. When it’s received, the far end can send an ICMP packet back to the source, telling it to update its MTU estimate to shorten its packets.
Ip6截断数据包:截断数据包的计数。 传输IPv6数据包时,可以将其标记为截断的候选对象。 如果任何中间路由器由于数据包超出最大传输单位 (MTU)而无法处理该数据包,则路由器会截断该数据包,将其标记为该数据包,然后将其转发到目的地。 收到后,远端可以将ICMP数据包发送回源,告诉它更新其MTU估计值以缩短其数据包。
Ip6 Discards: The count of discarded IPv6 packets. If any devices between the source and destination weren’t set up correctly, and their IPv6 settings don’t work, they won’t handle IPv6 traffic; it will be discarded.
Ip6丢弃:丢弃的IPv6数据包的计数。 如果源与目标之间的任何设备未正确设置,并且其IPv6设置不起作用,则它们将无法处理IPv6流量; 它将被丢弃。
Ip6 Packets: The total count of all types of IPv6 packets.
Ip6数据包:所有类型的IPv6数据包的总数。
Missed Error: The count of packets missing from a transmission. Packets are numbered so the original message can be recreated. If any are missing, they’re absence is conspicuous.
错过的错误:传输中丢失的数据包计数。 数据包已编号,因此可以重新创建原始消息。 如果有任何缺失,那么他们的缺席是显而易见的。
No Handler: The count of packets for which no protocol handler was found.
No Handler:没有找到协议处理程序的数据包计数。
Window Error: The count of window errors. The window of a packet is the number of octets in the header. If this holds an abnormal number, the header can’t be interpreted.
窗口错误:窗口错误计数。 数据包的窗口是报头中的八位位组数。 如果它包含一个异常数字,则无法解释标头。
The statistics in the right column are as follows:
右栏中的统计信息如下:
Packets: Traffic in packets.
数据包:以数据包为单位的流量。
Carrier Errors: A count of carrier errors. These occur if a problem arises with the modulation of a signal. This could indicate either a duplex mismatch between networking equipment or physical damage to a cable, socket, or connector.
运营商错误:运营商错误的计数。 如果信号调制出现问题,则会发生这些情况。 这可能表示网络设备之间的双工不匹配或电缆,插座或连接器的物理损坏。
Compressed: The number of compressed packets.
压缩:压缩包的数量。
Dropped: The number of packets dropped, which, as a result, failed to reach their destination (possibly due to congestion).
丢弃:丢弃的数据包数量,导致未能到达目的地(可能是由于拥塞)。
FIFO Errors: The count of first in, first out (FIFO) buffer errors. The network interface transmission buffer is overrunning because it isn’t being emptied fast enough.
FIFO错误:的计数先入先出 (FIFO)缓冲器错误。 网络接口传输缓冲区耗尽,因为它没有足够快地被清空。
Heartbeat Errors: Hardware or software might utilize a regular signal to show they’re operating correctly or to allow synchronization. The number here is how many “heartbeats” have been lost.
心跳错误:硬件或软件可能会利用常规信号来表明它们运行正常或允许同步。 这里的数字是丢失了多少“心跳”。
ICMPv6 Checksum Errors: The count of Internet Control Message Protocol v6 message checksum errors.
ICMPv6校验和错误: Internet控制消息协议v6消息校验和错误的计数。
Ip6 Address Errors: The count of errors due to bad IPv6 addresses
ip6地址错误:由于错误的IPv6地址而导致的错误计数
Ip6 Broadcast Packets: The count of IPv6 Broadcast packets.
Ip6广播数据包: IPv6广播数据包的计数。
Ip6 Checksum Errors: The count of IPv6 checksum errors. ICMP and User Datagram Protocol (UDP) packets in IPv6 use checksums, but regular IPv6 IP packets do not.
Ip6校验和错误: IPv6校验和错误的计数。 IPv6中的ICMP和用户数据报协议 (UDP)数据包使用校验和,而常规IPv6 IP数据包则不使用校验和。
Ip6 ECT(0) Packets: These are treated the same as ECT(1) packets.
Ip6 ECT(0)数据包:与ECT(1)数据包相同。
Ip6 Forwarded: The count of IPv6 packets unicast forwarding delivered. Unicast hops the packets from source to destination through a chain of intermediary routers and forwarders.
Ip6转发: 单播转发的IPv6报文计数。 单播通过中间路由器和转发器链将数据包从源跳到目的地。
Ip6 Multicasts: The number of IPv6 packets multicast forwarding delivered. Multicast sends the packets to a group of destinations simultaneously (which is how Wi-Fi works).
Ip6组播:传送的IPv6数据包的组播转发数 。 组播同时将数据包发送到一组目的地(这是Wi-Fi的工作方式)。
Ip6 No Route: The count of no route errors. This means the destination is unreachable because a route to the far end can’t be calculated
Ip6 No Route:无路由错误计数。 这意味着目的地无法到达,因为无法计算到远端的路线
Ip6 Reassembly/Fragment Failures: The count of IPv6 packets that were fragmented due to size, and failed to be reassembled upon receipt.
Ip6重组/分段失败:由于大小而被分段并且在接收时未能重新组装的IPv6数据包的计数。
Ip6 Reassembly/Fragment Requests: The count of IPv6 packets that were fragmented due to size, and had to be reassembled upon receipt.
Ip6重组/分段请求:由于大小而被分段并且必须在接收时进行重组的IPv6数据包的计数。
Ip6 Too Big Errors: The number of ICMP “too big” messages received, indicating that IPv6 packets were sent that were larger than the maximum transmission unit.
Ip6太大错误:接收到的ICMP“太大”消息的数量,表示发送的IPv6数据包大于最大传输单位。
Ip6 Unknown Protocol Errors: The count of packets received using an unknown protocol.
Ip6未知协议错误:使用未知协议接收的数据包计数。
Ip6 Octets: The volume of octets received and transmitted. IPv6 has a header of 40 octets (320 bits, 8 bits per octet), and a minimum packet size of 1,280 octets (10,240 bits).
Ip6八位位组:接收和发送的八位位组的数量。 IPv6的标头为40个八位位组 (320位,每八位位组8位),最小数据包大小为1,280个八位位组(10,240位)。
Length Error: The number of packets arriving with a length value in the header that’s shorter than the minimum possible packet length.
长度错误:到达报头的长度值比最小可能的数据包长度短的数据包数量。
Multicast: A count of multicast broadcasts.
组播:组播广播的计数。
Over Errors: A count of over errors. Either the receive buffer has overflowed, or packets have arrived with a frame value larger than what is supported, so they can’t be accepted.
过度错误:过度错误的计数。 要么接收缓冲区溢出,要么数据包到达的帧值大于所支持的帧值,因此无法接受它们。
附加信息 (The Additional Information)
If you press I (as in “Info”), it toggles the additional information panes. If additional information doesn’t appear, the window isn’t big enough. You can press D to turn off the detailed statistics, G to turn off the graphs, or you can stretch the window.
如果按I(如“信息”中的一样),它将切换其他信息窗格。 如果没有出现其他信息,则窗口不够大。 您可以按D键关闭详细统计信息,按G键关闭图形,或者可以拉伸窗口。
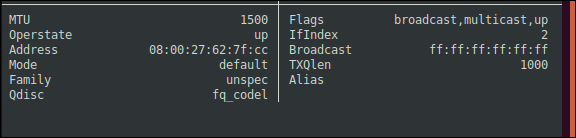
The additional information is as follows:
附加信息如下:
MTU: The maximum transmission unit.
MTU:最大传输单位。
Operstate: The operational state of the network interface.
Operstate:所述网络接口的操作状态。
Address: The media access control (MAC) address of the network interface.
地址:网络接口的媒体访问控制 (MAC)地址。
Mode: This is usually set to
default, but you could seetunnel,beet, orro. The first three relate to IP security (IPSec). Thedefaultsetting is usuallytransportmode, in which the payload is encrypted. Client-to-site virtual private networks (VPNs) typically use this. Site-to-site VPNs typically usetunnelmode, in which the entire packet is encrypted. In a Bound End-to-End Tunnel (beet) mode, a tunnel is created between two devices with fixed, hidden, IP addresses, and other, visible IP addresses. Theromode is a routing optimization method for mobile IPv6.模式:通常将其设置为
default,但您可能会看到tunnel,beet或ro。 前三个涉及IP安全性(IPSec) 。default设置通常是transport模式 ,其中对有效负载进行加密。 客户端到站点的虚拟专用网络 (VPN)通常使用此功能。 站点间VPN通常使用tunnel模式 ,在该模式下 ,整个数据包都被加密。 在“绑定的端到端隧道(beet)”模式下,将在两个具有固定,隐藏IP地址和其他可见IP地址的设备之间创建隧道。ro模式是用于移动IPv6的路由优化方法。Family: The network protocol family that is in use.
家族:正在使用的网络协议家族。
Qdisc: Queuing discipline. This can be set to
red(Random Early Detection),codel(Controlled Delay), orfq_codel(Fair Queueing with Controlled Delay).Qdisc:排队纪律。 可以将其设置为
red( 随机早期检测 ),codel( 受控延迟 )或fq_codel( 带有受控延迟的公平排队 )。Flags: These indicators show the capabilities of a network connection. Our connection can use
broadcastandmulticasttransmissions, and the interface isUp(operational and connected).标志:这些指示器显示网络连接的功能。 我们的连接可以使用
broadcast和multicast传输,并且接口为Up(可操作且已连接)。IfIndex: The Interface Index is a unique, identifying number associated with a network interface.
IfIndex:接口索引是与网络接口关联的唯一标识号。
Broadcast: The broadcast MAC address. Sending to this address broadcasts received packets to all devices.
广播:广播的MAC地址。 发送到该地址会将接收到的数据包广播到所有设备。
TXQlen: The transmission queue size (capacity).
TXQlen:传输队列大小(容量)。
Alias: An IP alias gives a physical network connection multiple IP addresses. It can then give access to different subnets via one network interface card. There are no aliases in use on our test computer.
别名: IP别名为物理网络连接提供了多个IP地址 。 然后,它可以通过一个网络接口卡提供对不同子网的访问。 测试计算机上没有使用别名。
bmon is a bit of a funny creature—neither fish, nor fowl, in some ways. The graphs have a primitive charm and give you a good indication of what’s going on.
bmon有点bmon有趣的生物,从某种意义上说,既不是鱼也不是鸟。 这些图具有原始的魅力,可为您提供良好的指示。
However, given the limitations of being rendered in ASCII, they can’t really be expected to be super-accurate. An occasional glance, though, can tell you if the connection is maxed out, mysteriously devoid of traffic, or somewhere in-between.
但是,考虑到以ASCII格式呈现的局限性,我们不能真正期望它们是超准确的。 但是,偶尔可以看一眼,可以告诉您连接是否已满,神秘地没有流量,或介于两者之间。
The detailed statistics, on the other hand, are just that: detailed and granular. Coupled with the somewhat casual approach in their labeling, it makes them even more difficult to decipher.
另一方面,详细的统计信息就是这样:详细而细致。 再加上标签上有些随意的方法,这使他们更难以解密。
Hopefully, the descriptions above will make bmon a little more approachable. It really is a useful, lightweight tool with which you can monitor the health of network traffic and the consumption of bandwidth.
希望上面的描述将使bmon更加平易近人。 它确实是一个有用的轻量级工具,可用于监视网络流量的运行状况和带宽消耗。
翻译自: https://www.howtogeek.com/664589/how-to-use-bmon-to-monitor-network-bandwidth-on-linux/
bmon linux


 751
751


 被折叠的 条评论
为什么被折叠?
被折叠的 条评论
为什么被折叠?
 到【灌水乐园】发言


