


python 数据透视表

One of the biggest challenges when facing a new data set is knowing where to start and what to focus on. Being able to quickly summarize hundreds of rows and columns can save you a lot of time and frustration. A simple tool you can use to achieve this is a pivot table, which helps you slice, filter, and group data at the speed of inquiry and represent the information in a visually appealing way.
面对新数据集时最大的挑战之一就是要知道从哪里开始以及应该关注什么。 能够快速汇总成百上千的行和列可以节省大量时间和精力。 数据透视表是您可以用来实现此目的的简单工具,它可以帮助您以查询的速度对数据进行切片,过滤和分组,并以视觉上有吸引力的方式表示信息。
数据透视表有什么用? (Pivot table, what is it good for?)
You may already be familiar with the concept of pivot tables from Excel, where they were introduced in 1994 by the trademarked name PivotTable. This tool enabled users to automatically sort, count, total, or average the data stored in one table. In the image below we used the PivotTable functionality to quickly summarize the Titanic data set. The larger table below displays the first ~30 rows of the data set, and the smaller tables are the PivotTables we created.
您可能已经熟悉Excel中的数据透视表的概念,该概念在1994年由商标名称PivotTable引入。 使用此工具,用户可以自动对一个表中存储的数据进行排序,计数,总计或平均。 在下图中,我们使用了数据透视表功能来快速汇总Titanic数据集。 下面较大的表显示了数据集的前30行,较小的表是我们创建的数据透视表。
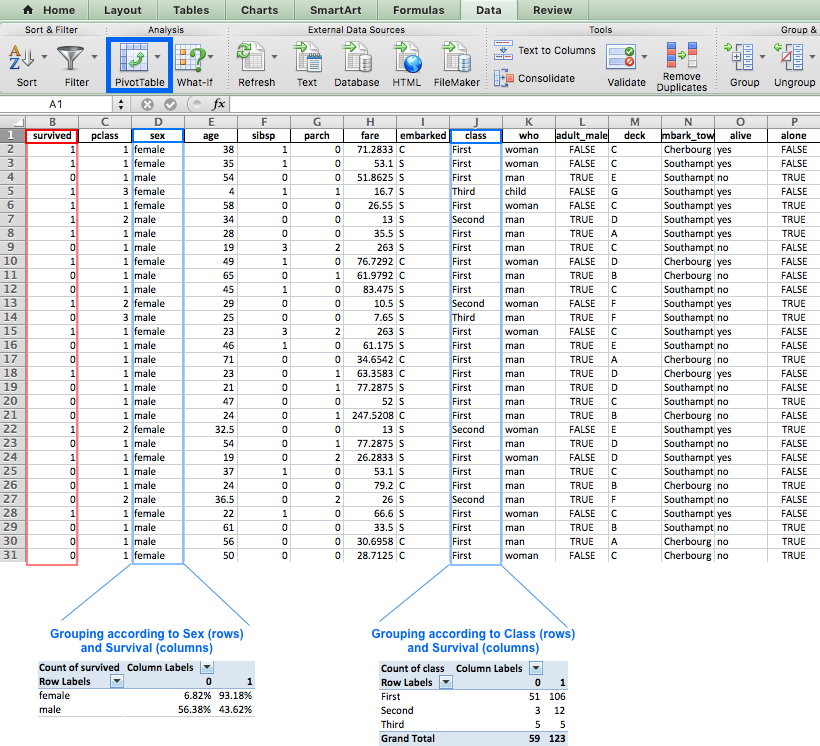
The pivot table on the left grouped the data according to the Sex and Survived column. As a result, this table displays the percentage of each gender among the different survival status (0: Didn’t survive, 1: Survived). This allows us to quickly see that women had better chances of survival than men. The table on the right also uses the Survived column, but this time the data is grouped by Class.
左侧的数据透视表根据“ Sex和Survived列对数据进行了分组。 结果,此表显示了每种性别在不同生存状态中所占的百分比( 0 :未生存, 1 :生存)。 这使我们能够Swift看到女性比男性拥有更好的生存机会。 右侧的表也使用了Survived列,但是这次数据是按Class分组的。
介绍我们的数据集:《世界幸福报告》 (Introducing our data set: World Happiness Report)
We used Excel for the above examples, but this post will demonstrate the advantages of the built-in pandas function pivot_table built in function in Pandas. We’ll use the World Happiness Report, which is a survey about the state of global happiness. The report ranks more than 150 countries by their happiness levels, and has been published almost every year since 2012. We’ll use data collected in the years 2015, 2016, and 2017, which is available for download if you’d like to follow along. We’re running python 3.6 and pandas 0.19.
在上面的示例中,我们使用了Excel,但是本文将演示内置熊猫函数内置的功能pivot_table 。 我们将使用《 世界幸福报告》 ,该报告是关于全球幸福状况的调查。 该报告按幸福等级对150多个国家/地区进行排名,自2012年以来几乎每年都会发布。我们将使用2015年,2016年和2017年收集的数据,如果您想了解的话可以下载。沿。 我们正在运行python 3.6和pandas 0.19。
Some interesting questions we might like to answer are:
我们可能想回答的一些有趣的问题是:
- Which are the happiest and least happy countries and regions in the world?
- Is happiness affected by region?
- Did the happiness score change significantly over the past three years?
- 世界上最幸福和最不开心的国家和地区是?
- 幸福会受到地区的影响吗?
- 在过去三年中,幸福感得分是否发生了显着变化?
Let’s import our data and take a quick first look:
让我们导入数据并快速浏览一下:
import import pandas pandas as as pd
pd
import import numpy numpy as as np
np
# reading the data
# reading the data
data data = = pdpd .. read_csvread_csv (( 'data.csv''data.csv' , , index_colindex_col == 00 )
)
# sort the df by ascending years and descending happiness scores
# sort the df by ascending years and descending happiness scores
datadata .. sort_valuessort_values ([([ 'Year''Year' , , "Happiness Score""Happiness Score" ], ], ascendingascending == [[ TrueTrue , , FalseFalse ], ], inplaceinplace == TrueTrue )
)
#diplay first 10 rows
#diplay first 10 rows
datadata .. headhead (( 1010 )
)
| Country | 国家 | Region | 地区 | Happiness Rank | 幸福等级 | Happiness Score | 幸福分数 | Economy (GDP per Capita) | 经济(人均GDP) | Family | 家庭 | Health (Life Expectancy) | 健康(预期寿命) | Freedom | 自由 | Trust (Government Corruption) | 信任(政府腐败) | Generosity | 慷慨大方 | Dystopia Residual | 反乌托邦残渣 | Year | 年 | ||
|---|---|---|---|---|---|---|---|---|---|---|---|---|---|---|---|---|---|---|---|---|---|---|---|---|---|
| 141 | 141 | Switzerland | 瑞士 | Western Europe | 西欧 | 1.0 | 1.0 | 7.587 | 7.587 | 1.39651 | 1.39651 | 1.34951 | 1.34951 | 0.94143 | 0.94143 | 0.66557 | 0.66557 | 0.41978 | 0.41978 | 0.29678 | 0.29678 | 2.51738 | 2.51738 | 2015 | 2015年 |
| 60 | 60 | Iceland | 冰岛 | Western Europe | 西欧 | 2.0 | 2.0 | 7.561 | 7.561 | 1.30232 | 1.30232 | 1.40223 | 1.40223 | 0.94784 | 0.94784 | 0.62877 | 0.62877 | 0.14145 | 0.14145 | 0.43630 | 0.43630 | 2.70201 | 2.70201 | 2015 | 2015年 |
| 38 | 38 | Denmark | 丹麦 | Western Europe | 西欧 | 3.0 | 3.0 | 7.527 | 7.527 | 1.32548 | 1.32548 | 1.36058 | 1.36058 | 0.87464 | 0.87464 | 0.64938 | 0.64938 | 0.48357 | 0.48357 | 0.34139 | 0.34139 | 2.49204 | 2.49204 | 2015 | 2015年 |
| 108 | 108 | Norway | 挪威 | Western Europe | 西欧 | 4.0 | 4.0 | 7.522 | 7.522 | 1.45900 | 1.45900 | 1.33095 | 1.33095 | 0.88521 | 0.88521 | 0.66973 | 0.66973 | 0.36503 | 0.36503 | 0.34699 | 0.34699 | 2.46531 | 2.46531 | 2015 | 2015年 |
| 25 | 25 | Canada | 加拿大 | North America | 北美 | 5.0 | 5.0 | 7.427 | 7.427 | 1.32629 | 1.32629 | 1.32261 | 1.32261 | 0.90563 | 0.90563 | 0.63297 | 0.63297 | 0.32957 | 0.32957 | 0.45811 | 0.45811 | 2.45176 | 2.45176 | 2015 | 2015年 |
| 46 | 46 | Finland | 芬兰 | Western Europe | 西欧 | 6.0 | 6.0 | 7.406 | 7.406 | 1.29025 | 1.29025 | 1.31826 | 1.31826 | 0.88911 | 0.88911 | 0.64169 | 0.64169 | 0.41372 | 0.41372 | 0.23351 | 0.23351 | 2.61955 | 2.61955 | 2015 | 2015年 |
| 102 | 102 | Netherlands | 荷兰 | Western Europe | 西欧 | 7.0 | 7.0 | 7.378 | 7.378 | 1.32944 | 1.32944 | 1.28017 | 1.28017 | 0.89284 | 0.89284 | 0.61576 | 0.61576 | 0.31814 | 0.31814 | 0.47610 | 0.47610 | 2.46570 | 2.46570 | 2015 | 2015年 |
| 140 | 140 | Sweden | 瑞典 | Western Europe | 西欧 | 8.0 | 8.0 | 7.364 | 7.364 | 1.33171 | 1.33171 | 1.28907 | 1.28907 | 0.91087 | 0.91087 | 0.65980 | 0.65980 | 0.43844 | 0.43844 | 0.36262 | 0.36262 | 2.37119 | 2.37119 | 2015 | 2015年 |
| 103 | 103 | New Zealand | 新西兰 | Australia and New Zealand | 澳大利亚和新西兰 | 9.0 | 9.0 | 7.286 | 7.286 | 1.25018 | 1.25018 | 1.31967 | 1.31967 | 0.90837 | 0.90837 | 0.63938 | 0.63938 | 0.42922 | 0.42922 | 0.47501 | 0.47501 | 2.26425 | 2.26425 | 2015 | 2015年 |
| 6 | 6 | Australia | 澳大利亚 | Australia and New Zealand | 澳大利亚和新西兰 | 10.0 | 10.0 | 7.284 | 7.284 | 1.33358 | 1.33358 | 1.30923 | 1.30923 | 0.93156 | 0.93156 | 0.65124 | 0.65124 | 0.35637 | 0.35637 | 0.43562 | 0.43562 | 2.26646 | 2.26646 | 2015 | 2015年 |
Each country’s Happiness Score is calculated by summing the seven other variables in the table. Each of these variables reveals a population-weighted average score on a scale running from 0 to 10, that is tracked over time and compared against other countries.
每个国家的Happiness Score是通过将表格中的其他七个变量相加得出的。 这些变量中的每一个都揭示了人口加权的平均得分,范围从0到10,随时间推移进行追踪,并与其他国家进行比较。
These variables are:
这些变量是:
Economy: real GDP per capitaFamily: social supportHealth: healthy life expectancyFreedom: freedom to make life choicesTrust: perceptions of corruptionGenerosity: perceptions of generosityDystopia: each country is compared against a hypothetical nation that represents the lowest national averages for each key variable and is, along with residual error, used as a regression benchmark
-
Economy:人均实际国内生产总值 -
Family:社会支持 -
Health:健康的预期寿命 -
Freedom:自由选择生活 -
Trust:对腐败的看法 -
Generosity:对慷慨的看法 -
Dystopia:将每个国家与一个假设国家进行比较,该国家代表每个关键变量的最低全国平均水平,并与剩余误差一起用作回归基准
Each country’s Happiness Score determines its Happiness Rank – which is its relative position among other countries in that specific year. For example, the first row indicates that Switzerland was ranked the happiest country in 2015 with a happiness score of 7.587. Switzerland was ranked first just before Iceland, which scored 7.561. Denmark was ranked third in 2015, and so on. It’s interesting to note that Western Europe took seven of the top eight rankings in 2015.
每个国家的Happiness Score决定其Happiness Rank -这是该年在其他国家中的相对排名。 例如,第一行表示瑞士在2015年的幸福感得分为7.587,是最幸福的国家。 瑞士排名第一,仅次于冰岛,得分为7.561。 丹麦在2015年排名第三,依此类推。 有趣的是,西欧在2015年的前八名中排名七。
We’ll concentrate on the final Happiness Score to demonstrate the technical aspects of pivot table.
我们将集中在最终的Happiness Score以演示数据透视表的技术方面。
Our data has 495 rows and 12 columns
Are there missing values? True
| Happiness Rank | 幸福等级 | Happiness Score | 幸福分数 | Economy (GDP per Capita) | 经济(人均GDP) | Family | 家庭 | Health (Life Expectancy) | 健康(预期寿命) | Freedom | 自由 | Trust (Government Corruption) | 信任(政府腐败) | Generosity | 慷慨大方 | Dystopia Residual | 反乌托邦残渣 | Year | 年 |
|---|
 最低0.47元/天 解锁文章


 58
58


 被折叠的 条评论
为什么被折叠?
被折叠的 条评论
为什么被折叠?
 到【灌水乐园】发言


