plotly python
Plotly是一个绘图生态系统,可让您在Python ,JavaScript和R中进行绘图。在本系列文章中,我将重点介绍使用Python库进行绘图 。
Plotly具有三种不同的Python API,使您可以选择如何驱动它:
- 感觉类似于Matplotlib 的面向对象的API
- 数据驱动的API ,通过构造类似JSON的数据的字典来指定图
- 一个“ Plotly Express” API ,为您提供类似于Seaborn的高级绘图功能
我将通过在每个API中绘制相同的图来探索每个API:历史英国选举结果的分组条形图。
在继续之前,请注意,您可能需要调整Python环境以使此代码运行,包括以下内容。
- 运行最新版本的Python( Linux , Mac和Windows的说明 )
- 验证您正在运行与这些库一起使用的Python版本
数据可在线获得,并可使用熊猫导入:
     import pandas

     as pd


df

     = pd.

     read_csv

     (

     'https://anvil.works/blog/img/plotting-in-python/uk-election-results.csv'

     )
现在我们准备出发了。
使用图对象制作图
Plotly的面向对象的API名为graph_objects。 它有点类似于Matplotlib的面向对象的API 。
要创建多条图,可以构造包含四个条图的图形对象:
     # Import Plotly and our data


     import plotly.

     graph_objects

     as go


     # Get a convenient list of x-values


years

     = df

     [

     'year'

     ]


x

     =

     list

     (

     range

     (

     len

     ( years

     )

     )

     )


     # Specify the plots


bar_plots

     =

     [


    go.

     Bar

     ( x

     = x

     , y

     = df

     [

     'conservative'

     ]

     , name

     =

     'Conservative'

     , marker

     = go.

     bar .

     Marker

     ( color

     =

     '#0343df'

     )

     )

     ,


    go.

     Bar

     ( x

     = x

     , y

     = df

     [

     'labour'

     ]

     , name

     =

     'Labour'

     , marker

     = go.

     bar .

     Marker

     ( color

     =

     '#e50000'

     )

     )

     ,


    go.

     Bar

     ( x

     = x

     , y

     = df

     [

     'liberal'

     ]

     , name

     =

     'Liberal'

     , marker

     = go.

     bar .

     Marker

     ( color

     =

     '#ffff14'

     )

     )

     ,


    go.

     Bar

     ( x

     = x

     , y

     = df

     [

     'others'

     ]

     , name

     =

     'Others'

     , marker

     = go.

     bar .

     Marker

     ( color

     =

     '#929591'

     )

     )

     ,


     ]


     # Specify the layout


layout

     = go.

     Layout

     (


    title

     = go.

     layout .

     Title

     ( text

     =

     "Election results"

     , x

     =

     0.5

     )

     ,


    yaxis_title

     =

     "Seats"

     ,


    xaxis_tickmode

     =

     "array"

     ,


    xaxis_tickvals

     =

     list

     (

     range

     (

     27

     )

     )

     ,


    xaxis_ticktext

     =

     tuple

     ( df

     [

     'year'

     ] .

     values

     )

     ,


     )


     # Make the multi-bar plot


fig

     = go.

     Figure

     ( data

     = bar_plots

     , layout

     = layout

     )


     # Tell Plotly to render it


fig.

     show

     (

     )
与Matplotlib中不同,无需手动计算钢筋的x位置。 情节地照顾您。
这是最后的情节:
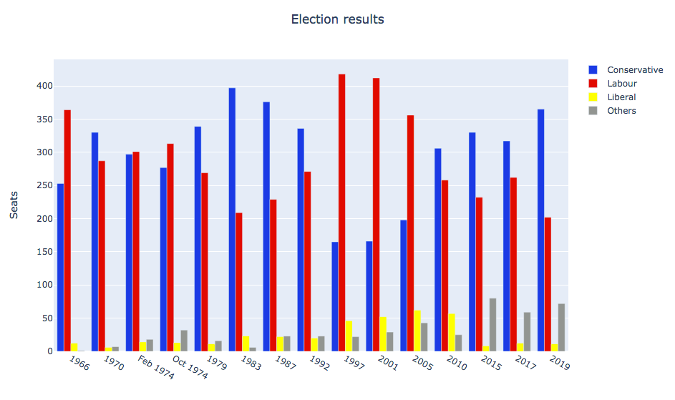
使用图形对象制作的多条图(©2019 Anvil )
使用Python数据结构绘制图
您还可以使用基本Python数据结构(与面向对象API的结构相同)来指定绘图。 这直接对应于用于Plotly JavaScript实现的JSON API。
     # Specify the plots


    fig

     =

     {


     'data' :

     [


     {

     'type' :

     'bar'

     ,

     'x' : x

     ,

     'y' : df

     [

     'conservative'

     ]

     ,

     'name' :

     'Conservative'

     ,

     'marker' :

     {

     'color' :

     '#0343df'

     }

     }

     ,


     {

     'type' :

     'bar'

     ,

     'x' : x

     ,

     'y' : df

     [

     'labour'

     ]

     ,

     'name' :

     'Labour'

     ,

     'marker' :

     {

     'color' :

     '#e50000'

     }

     }

     ,


     {

     'type' :

     'bar'

     ,

     'x' : x

     ,

     'y' : df

     [

     'liberal'

     ]

     ,

     'name' :

     'Liberal'

     ,

     'marker' :

     {

     'color' :

     '#ffff14'

     }

     }

     ,


     {

     'type' :

     'bar'

     ,

     'x' : x

     ,

     'y' : df

     [

     'others'

     ]

     ,

     'name' :

     'Others'

     ,

     'marker' :

     {

     'color' :

     '#929591'

     }

     }

     ,


     ]

     ,


     'layout' :

     {


     'title' :

     {

     'text' :

     'Election results'

     ,

     'x' :

     0.5

     }

     ,


     'yaxis' :

     {

     'title' :

     'Seats'

     }

     ,


     'xaxis' :

     {


     'tickmode' :

     'array'

     ,


     'tickvals' :

     list

     (

     range

     (

     27

     )

     )

     ,


     'ticktext' :

     tuple

     ( df

     [

     'year'

     ] .

     values

     )

     ,


     }


     }


     }


     # Tell Plotly to render it


    pio.

     show

     ( fig

     )
最终绘图与上一个绘图完全相同:
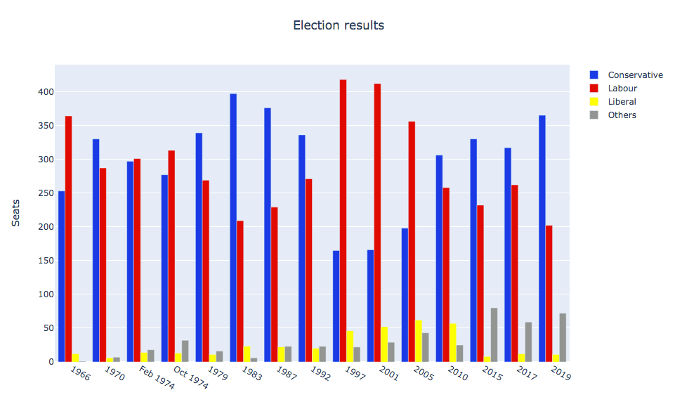
使用类似JSON的数据结构制作的多线图(©2019 Anvil )
使用Plotly Express进行绘图
Plotly Express是包装图形对象的高级API。
您可以使用(几乎)单行在Plotly Express中制作多条图:
     # Import Plotly and our data


     import plotly.

     express

     as px


     # Define the colourmap to get custom bar colours


    cmap

     =

     {


     'Conservative' :

     '#0343df'

     ,


     'Labour' :

     '#e50000'

     ,


     'Liberal' :

     '#ffff14'

     ,


     'Others' :

     '#929591'

     ,


     }


     # Make the plot!


    fig

     = px.

     bar

     ( df

     , x

     =

     "year"

     , y

     =

     "seats"

     , color

     =

     "party"

     , barmode

     =

     "group"

     , color_discrete_map

     = cmap

     )
这将使用长格式的数据,也称为“整洁数据”。 这些列是年份,聚会和席位,而不是按聚会划分。 这与在Seaborn中制作多条图非常相似。
     >> print(long)


     year         party  seats


0    1922  Conservative    344


1    1923  Conservative    258


2    1924  Conservative    412


3    1929  Conservative    260


4    1931  Conservative    470


..    ...           ...    ...


103  2005        Others     30


104  2010        Others     29


105  2015        Others     80


106  2017        Others     59


107  2019        Others     72


[108 rows x 3 columns]
您可以访问底层的Graph Objects API进行详细调整。 添加标题和y轴标签:
     # Use the Graph Objects API to tweak our plot


     import plotly.

     graph_objects

     as go


    fig.

     layout

     = go.

     Layout

     (


        title

     = go.

     layout .

     Title

     ( text

     =

     "Election results"

     , x

     =

     0.5

     )

     ,


        yaxis_title

     =

     "Seats"

     ,


     )
最后,请Plotly向您展示:
     # Tell Plotly to render it


    fig.

     show

     (

     )
这将在未使用的端口上运行一个临时Web服务器,并打开默认的Web浏览器以查看绘图(该Web服务器将立即拆除)。
不幸的是,结果并不完美。 x轴被视为整数,因此这些组相距甚远且很小。 这使得很难看到趋势。
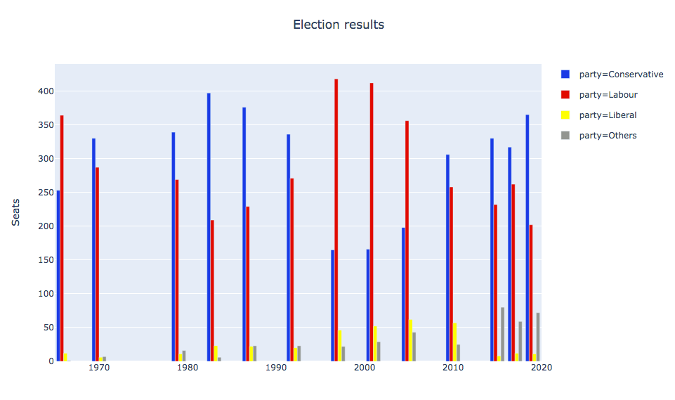
使用Plotly Express制作的多条图(©2019 Anvil )
您可能会尝试通过将X值转换为字符串来鼓励Plotly Express将x值视为字符串。 您可能希望这会导致它们以均匀的间距和词法顺序进行绘制。 不幸的是,您仍然可以在数值上获得有用的间隔。 设置xaxis_tickvals也不像在graph_objects中那样设置。
在这种情况下, Seaborn似乎没有提供足够的逃生舱口以完全提供所需的东西。 但是也许您可以编写自己的 API?构建自己的Plotly API
对Plotly的操作方式不满意? 构建自己的Plotly API!
Plotly的核心是一个JavaScript库,该库使用D3和stack.gl进行绘图。 JavaScript库具有使用指定图的JSON结构的接口。 因此,您只需要输出JavaScript库喜欢使用的JSON结构。
Anvil这样做是为了创建一个完全在浏览器中工作的Python Plotly API。
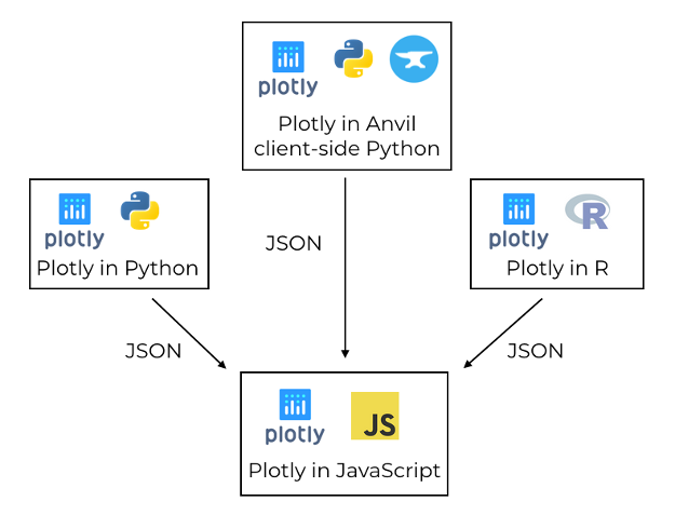
Plotly使用JavaScript库来创建图,该图由其他语言的库通过JSON驱动(©2019 Anvil )
在Anvil版本中,您可以同时使用Graph Objects API和上面介绍的Python数据结构方法。 您运行完全相同的命令,将数据和布局分配给Anvil应用程序中的“ 绘图”组件 。
这是用Anvil的客户端Python API编写的多栏图:
     # Import Anvil libraries


     from ._anvil_designer

     import EntrypointTemplate


     from anvil

     import *


     import anvil.

     server


     # Import client-side Plotly


     import plotly.

     graph_objs

     as go


     # This is an Anvil Form


     class Entrypoint

     ( EntrypointTemplate

     ) :


     def

     __init__

     (

     self

     , **properties

     ) :


     # Set Form properties and Data Bindings.


     self .

     init_components

     ( **properties

     )


     # Fetch the data from the server


    data

     = anvil.

     server .

     call

     (

     'get_election_data'

     )


     #  Get a convenient list of x-values


    years

     = data

     [

     'year'

     ]


    x

     =

     list

     (

     range

     (

     len

     ( years

     )

     )

     )


     # Specify the plots


    bar_plots

     =

     [


      go.

     Bar

     ( x

     = x

     , y

     = data

     [

     'conservative'

     ]

     , name

     =

     'Conservative'

     , marker

     = go.

     Marker

     ( color

     =

     '#0343df'

     )

     )

     ,


      go.

     Bar

     ( x

     = x

     , y

     = data

     [

     'labour'

     ]

     , name

     =

     'Labour'

     , marker

     = go.

     Marker

     ( color

     =

     '#e50000'

     )

     )

     ,


      go.

     Bar

     ( x

     = x

     , y

     = data

     [

     'liberal'

     ]

     , name

     =

     'Liberal'

     , marker

     = go.

     Marker

     ( color

     =

     '#ffff14'

     )

     )

     ,


      go.

     Bar

     ( x

     = x

     , y

     = data

     [

     'others'

     ]

     , name

     =

     'Others'

     , marker

     = go.

     Marker

     ( color

     =

     '#929591'

     )

     )

     ,


     ]


     # Specify the layout


    layout

     =

     {


     'title' :

     'Election results'

     ,


     'yaxis' :

     {

     'title' :

     'Seats'

     }

     ,


     'xaxis' :

     {


     'tickmode' :

     'array'

     ,


     'tickvals' :

     list

     (

     range

     (

     27

     )

     )

     ,


     'ticktext' : data

     [

     'year'

     ]

     ,


     }

     ,


     }


     # Make the multi-bar plot


     self .

     plot_1 .

     data

     = bar_plots


     self .

     plot_1 .

     layout

     = layout
绘图逻辑与上面相同,但是它完全在Web浏览器中运行-绘图由用户计算机上的Plotly JavaScript库创建! 与本系列的所有其他Python绘图库相比,这是一个很大的优势。 所有其他Python库都需要在服务器上运行。
这是在Anvil应用中运行的交互式Plotly图:
您可以将此示例复制为Anvil应用(请注意:Anvil需要注册才能使用)。
在前端运行Plotly具有另一个优点:它为自定义交互行为提供了更多选项。
在Plotly中自定义交互
情节图不仅是动态的; 您可以自定义他们的互动行为。 例如,您可以在每个条形图中使用hovertemplate自定义工具提示的格式:
         go.

     Bar

     (


      x

     = x

     ,


      y

     = df

     [

     'others'

     ]

     ,


      name

     =

     'others'

     ,


      marker

     = go.

     bar .

     Marker

     ( color

     =

     '#929591'

     )

     ,


      hovertemplate

     =

     'Seats: <b>%{y}</b>'

     ,


     )

     ,
将其应用于每个条形图时,将得到以下结果:
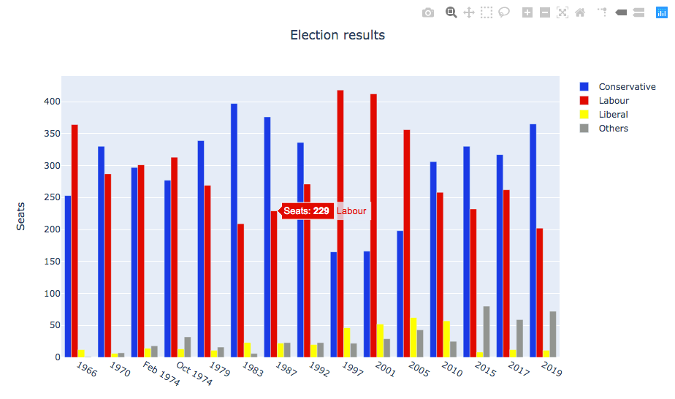
具有自定义工具提示的多栏图(©2019 Anvil )
这很有用,但是如果您在某些事件发生时可以执行所需的任何代码(例如,当用户将鼠标悬停在栏上并且您想要显示有关相关选择的信息框时),则效果会更好。 在Anvil的Plotly库中,您可以将事件处理程序绑定到诸如悬停之类的事件,这使这种复杂的交互成为可能!
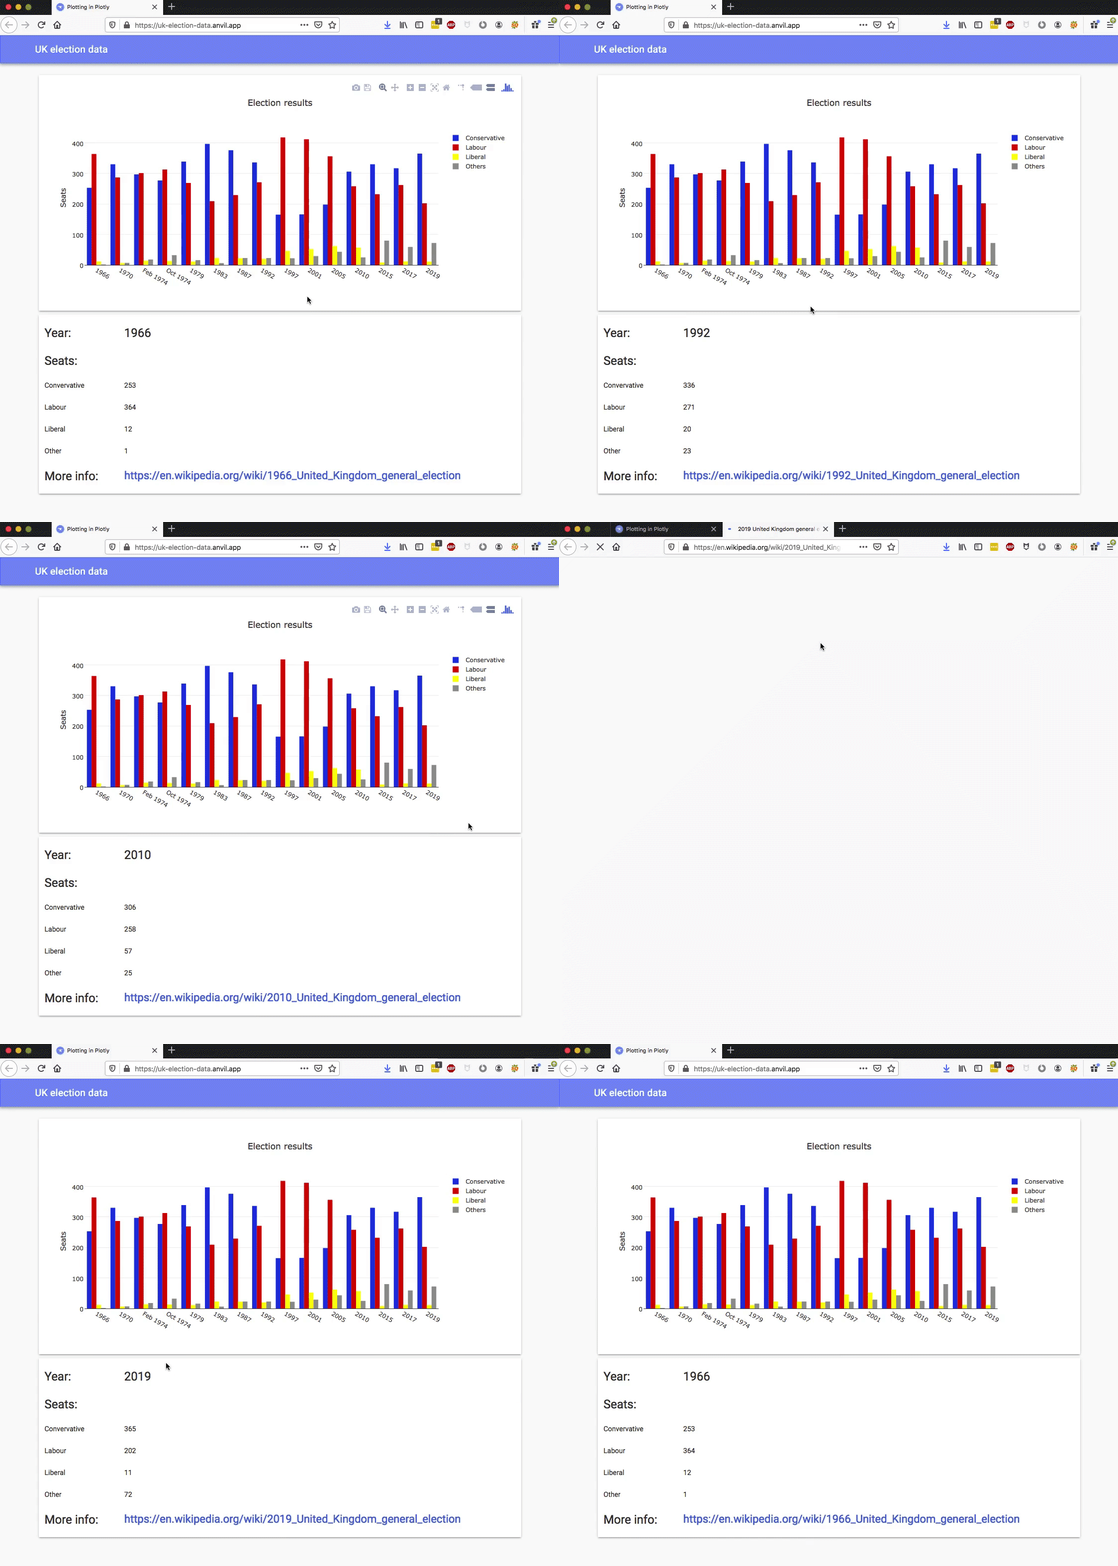
具有悬停事件处理程序的多栏图(©2019 Anvil )
您可以通过将方法绑定到绘图的悬停事件来实现此目的:
     def plot_1_hover

     (

     self

     , points

     , **event_args

     ) :


     """This method is called when a data point is hovered."""


    i

     = points

     [

     0

     ]

     [

     'point_number'

     ]


     self .

     label_year .

     text

     =

     self .

     data

     [

     'year'

     ]

     [ i

     ]


     self .

     label_con .

     text

     =

     self .

     data

     [

     'conservative'

     ]

     [ i

     ]


     self .

     label_lab .

     text

     =

     self .

     data

     [

     'labour'

     ]

     [ i

     ]


     self .

     label_lib .

     text

     =

     self .

     data

     [

     'liberal'

     ]

     [ i

     ]


     self .

     label_oth .

     text

     =

     self .

     data

     [

     'others'

     ]

     [ i

     ]


    url

     = f

     "https://en.wikipedia.org/wiki/{self.data['year'][i]}_United_Kingdom_general_election"


     self .

     link_more_info .

     text

     = url


     self .

     link_more_info .

     url

     = url
这是相当极端的交互性,而从开发人员的角度来看,这是极端的可定制性。 这完全归功于Plotly的体系结构-Plotly具有一个干净的接口,该接口明确设计用于允许您构建自己的API。 到处都可以看到这种出色的设计!
使用Bokeh进行自定义交互
您已经了解了Plotly如何使用JavaScript创建动态图,并且可以使用Anvil的客户端Python代码在浏览器中实时编辑它们。
Bokeh是另一个Python绘图库,它输出可嵌入Web应用程序HTML文档,并获得与Plotly提供的功能类似的动态功能。 (如果您想知道它的发音,那就是“ BOE-kay”。)
享受自定义图表并在下面的评论中分享提示和技巧。
本文基于如何在Anvil的博客上使用Plotly进行绘图,并经许可重复使用。
plotly python


 本文介绍了如何使用Plotly Python库进行数据可视化,包括面向对象的API、使用Python数据结构绘制图、Plotly Express高级绘图功能以及如何自定义交互。文章通过实例展示了在不同API下创建历史英国选举结果的分组条形图,强调了Plotly在交互性和自定义方面的灵活性。


 4665
4665

 被折叠的 条评论
为什么被折叠?


