


 图例在数据可视化中至关重要,Matplotlib提供多种方式自定义图例位置。本文展示了如何使用Python代码将图例放置在图表的不同位置。
python图例位置
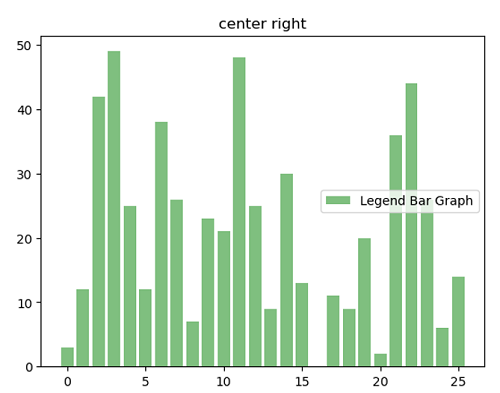
Legends are one of the key components of data visualization and plotting. Matplotlib can automatically define a position for a legend in addition to this, it allows us to locate it in our required positions. Following is the list of locations on which we can locate our plot legend.
图例是数据可视化和绘图的关键组成部分之一。 Matplotlib可以为此自动定义图例的位置,它使我们能够将其定位在所需的位置。 以下是我们可以在其中找到图例的位置的列表。
图例位置的Python代码 (Python code for legend locations)
# Data Visualization using Python
# Adding a Legend Location
import numpy as np
import matplotlib.pyplot as plt
x = np.linspace(0, 2, 100)
# Example 1
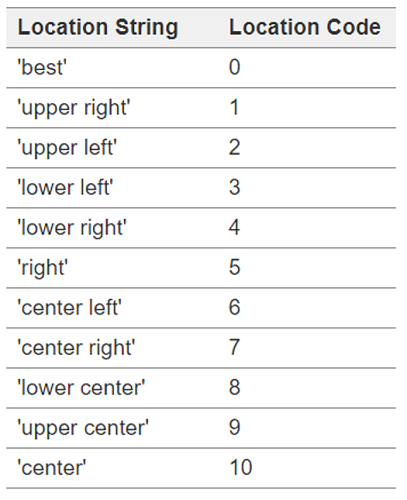
plt.figure()
plt.plot(x, x+2, label='linear')
plt.plot(x, x**2, label='quadratic')
plt.plot(x, x**3, label='cubic')
plt.xlabel('x label')
plt.ylabel('y label')
plt.title("lower right")
plt.legend(loc='lower right')
# Example 2
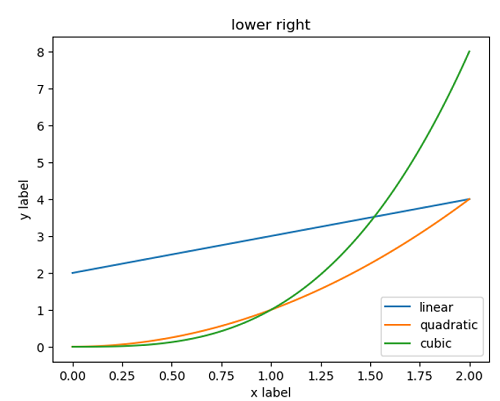
plt.figure()
x = np.linspace(0.0, 5.0)
y = x*x
plt.subplot(2, 1, 2)
plt.plot(x, y, 'g.-',label='quadratic')
plt.plot(x,x, 'r.-', label='linear')
plt.title('uper left')
plt.xlabel('numbers')
plt.ylabel('Square')
plt.legend(loc='uper left')
plt.show()
# Example 3
# Random Bar Graph Example
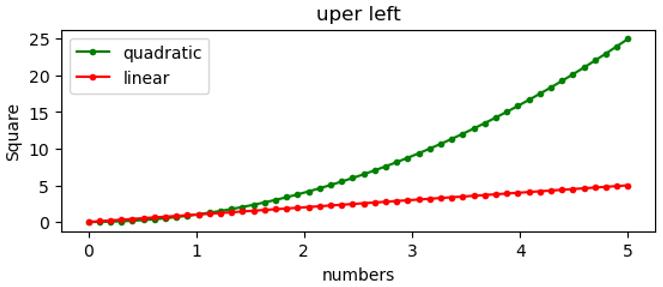
plt.figure()
plt.bar(np.arange(26), np.random.randint(0,50,26), alpha = 0.5, color='g', label='Legend Bar Graph')
plt.title('center right')
plt.legend(loc='center right')
Output:
输出:
Output is as figure
翻译自: https://www.includehelp.com/python/legend-locations.aspx
python图例位置


 529
529

 被折叠的 条评论
为什么被折叠?
被折叠的 条评论
为什么被折叠?
 到【灌水乐园】发言


