


sleepgraph是pm-graph工具中的一个,pm-gragph(https://01.org/zh/pm-graph?langredirect=1)提供了bootgraph和sleepgraph,帮助OS developer分析boot和suspend/resume过程,找到影响系统启动或休眠效率的瓶颈。我们今天来介绍一下sleepgraph工具。
sleepgraph会发起一个suspend/resume操作,获取ftrace和dmesg信息,转换成timeline图形格式,还可以提供callgraph调用关系,帮助开发人员快速了解在system suspend/resume过程中,哪个phase?哪个device?哪个callback耗时最长。测试结果以dmesg.txt、ftrace.txt和.html的形式展现。
1、如何获取sleepgraph工具
一般地,在kernel SRC的tools/power/pm-graph中提供工具代码,通过make & make install即可编译安装。make install之后,会拷贝测试程序和配置文件到/usr/lib/pm-graph/目录中。
你也可以去https://github.com/intel/pm-graph去下载pm-graph源码,按照README去编译安装。
2、内核配置
sleepgraph工具使用时,需要配置以下内核选项
CONFIG_PM_DEBUG=y
CONFIG_PM_SLEEP_DEBUG=y
CONFIG_FTRACE=y
CONFIG_FUNCTION_TRACER=y
CONFIG_FUNCTION_GRAPH_TRACER=y
CONFIG_KPROBES_ON_FTRACE=y
3、sleepgraph的使用
3.1 查看当前系统支持哪些sleep state
# sleepgraph -modes
['freeze', 'mem', 'disk', 'mem-s2idle', 'disk-platform', 'disk-shutdown', 'disk-reboot', 'disk-suspend', 'disk-test_resume']
3.2 使用sleepgraph查看STR和S2Idle流程
#sleepgraph -config suspend-callgraph.cfg -m mem
执行STR suspend/resume,获取过程中的ftrace和dmesg信息,生成.html文件,绘制的timeline和callgraph图形如下


#sleepgraph -config suspend-callgraph.cfg -m mem-s2idle
执行S2I suspend/resume,获取过程中的ftrace和dmesg信息,生成.html文件,绘制的timeline和callgraph图形如下


通过对STR和S2I suspend/resume流程的分析,我们能够得到以下结论:
1)S2Idle的resume latency比STR 小得多
STR的suspend时长为1334ms,firmware resume时长为559ms,kernel resume时长为6137ms;
S2I的suspend时长为1562ms,freeze时长为12783ms,不需要firmware resume,kernel resume时长为3206ms。
从数据上看,S2I resume latency远远小于STR。
2)S2I 没有CPU suspend/resume
从callgraph上可以很清楚地看到,在S2I的过程中,不会执行nonboot CPU offline操作和一些syscore相关的suspend/resume动作。
3)不管是STR还是S2I,耗时最长的都是resume阶段,00:00:00:00(sd) 的resume 操作。
3.3 使用callgraph找到耗时大户
从上图看,STR和S2I 过程中,耗时最长的是resume phase中,00:00:00:00 (sd)的resume操作。
接下来,我们使用callgraph功能找到耗时最长的函数。如下,通过callgraph,我们可以清晰地查看每个设备或子系统的suspend/resume占用的时间;如果发现某个函数占用时间较长,可以逐级展开,找到占用最大的函数,定位问题。

通过这个callgraph,可以看到async_synchronize_full_domain--> async_synchronize_cookie_domain耗时比较长,达到3000多ms。我们去kernel source code中查一下这里在做什么操作。
static int scsi_bus_resume_common(struct device *dev,
    int (*cb)(struct device *, const struct dev_pm_ops *))
{
	async_func_t fn;
        ……
	if (fn) {
		async_schedule_domain(fn, dev, &scsi_sd_pm_domain);
		if (strncmp(scsi_scan_type, "async", 5) != 0)
			async_synchronize_full_domain(&scsi_sd_pm_domain);
	}
        ……
	return 0;
}
scsi_bus_resume时,在这里判断scsi_scan_type;如果不是”async”模式,会执行async_synchronize_full_domain,就对应着我们resume过程中的耗时大户,我们这里把scsi_scan_type改成”async”试试看。
#echo async > /sys/module/scsi_mod/parameters/scan
执行suspend_to_RAM测试: # sleepgraph -config suspend-callgraph.cfg -m mem,结果如下:

执行suspend_to_idle测试: # sleepgraph -config suspend-callgraph.cfg -m mem-s2idle,结果如下:

从上面的测试结果来看,将scsi_scan_type修改成”async”之后,S2I和STR的resume时长都大幅减少。
3.4 使用sleepgraph执行压力测试
将scsi_scan_type从"sync"改成"async",能够提高suspend/resume的效率,但会不会导致其他问题呢?最简单的做法是做一个压力测试,多次执行S2I和STR测试,看看会不会有问题。
sleepgraph提供-multi n d选项,帮助我们完成endurance test,并在所有测试完成后,生成summary文件,帮助我们了解测试结果。这里的n表示循环测试次数,d表示两次测试之间的时间间隔。
# sleepgraph -config suspend-callgraph.cfg -m mem-s2idle -multi 100 20
连续执行100次suspend_to_idle操作,全部pass,summary结果如下:

# sleepgraph -config suspend-callgraph.cfg -m mem -multi 50 20
连续执行50次suspend_to_RAM操作,全部pass,summary结果如下:
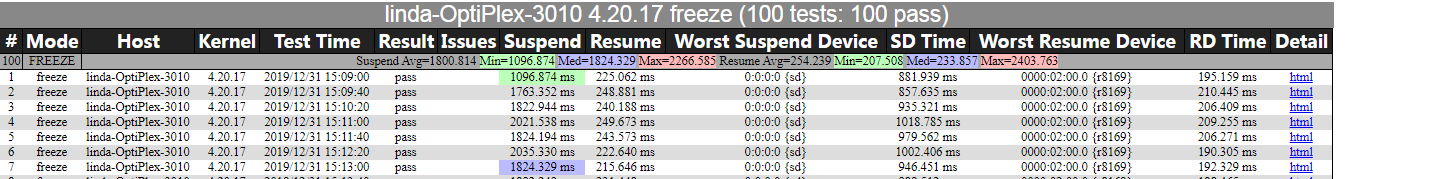
summary会列出所有测试的结果,统计出suspend/resume的average、min、max和med entry,点击最右边的html即可链接到具体的测试项查看详细信息。
从上面的例子可以看到,sleepgraph就是分析和优化suspend/resume的利器,它常用的用法在以上的示例中都有涉及到,更多的用法可以通过man sleepgraph去查看。


 2158
2158


 被折叠的 条评论
为什么被折叠?
被折叠的 条评论
为什么被折叠?
 到【灌水乐园】发言


