


导入包
from sklearn import datasets
from sklearn.model_selection import train_test_split
from sklearn.linear_model import LinearRegression
import pandas as pd
数据准备
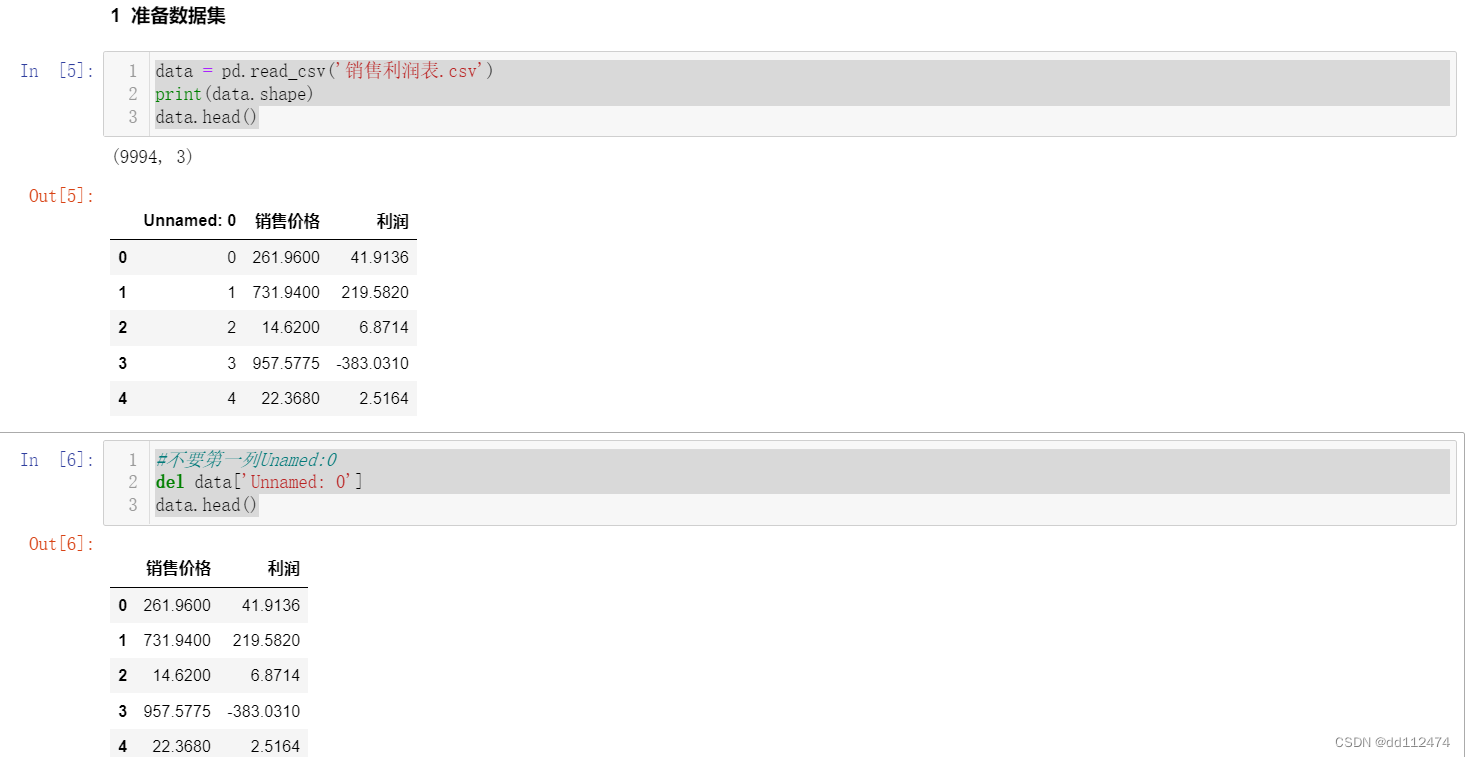
data = pd.read_csv('销售利润表.csv')  #更常用
print(data.shape)
data.head()
这里对比一下,引入dataset系统自带函数的代码
  #波士顿房价数据集
boston = datasets.load_boston() #系统自带数据
#不要第一列Unamed:0
del data['Unnamed: 0']
data.head()
训练集测试集划分
train_test_split? 查看参数,得到x_train, x_test, y_train, y_test = train_test_split( x, y, test_size=0.2, random_state=42)
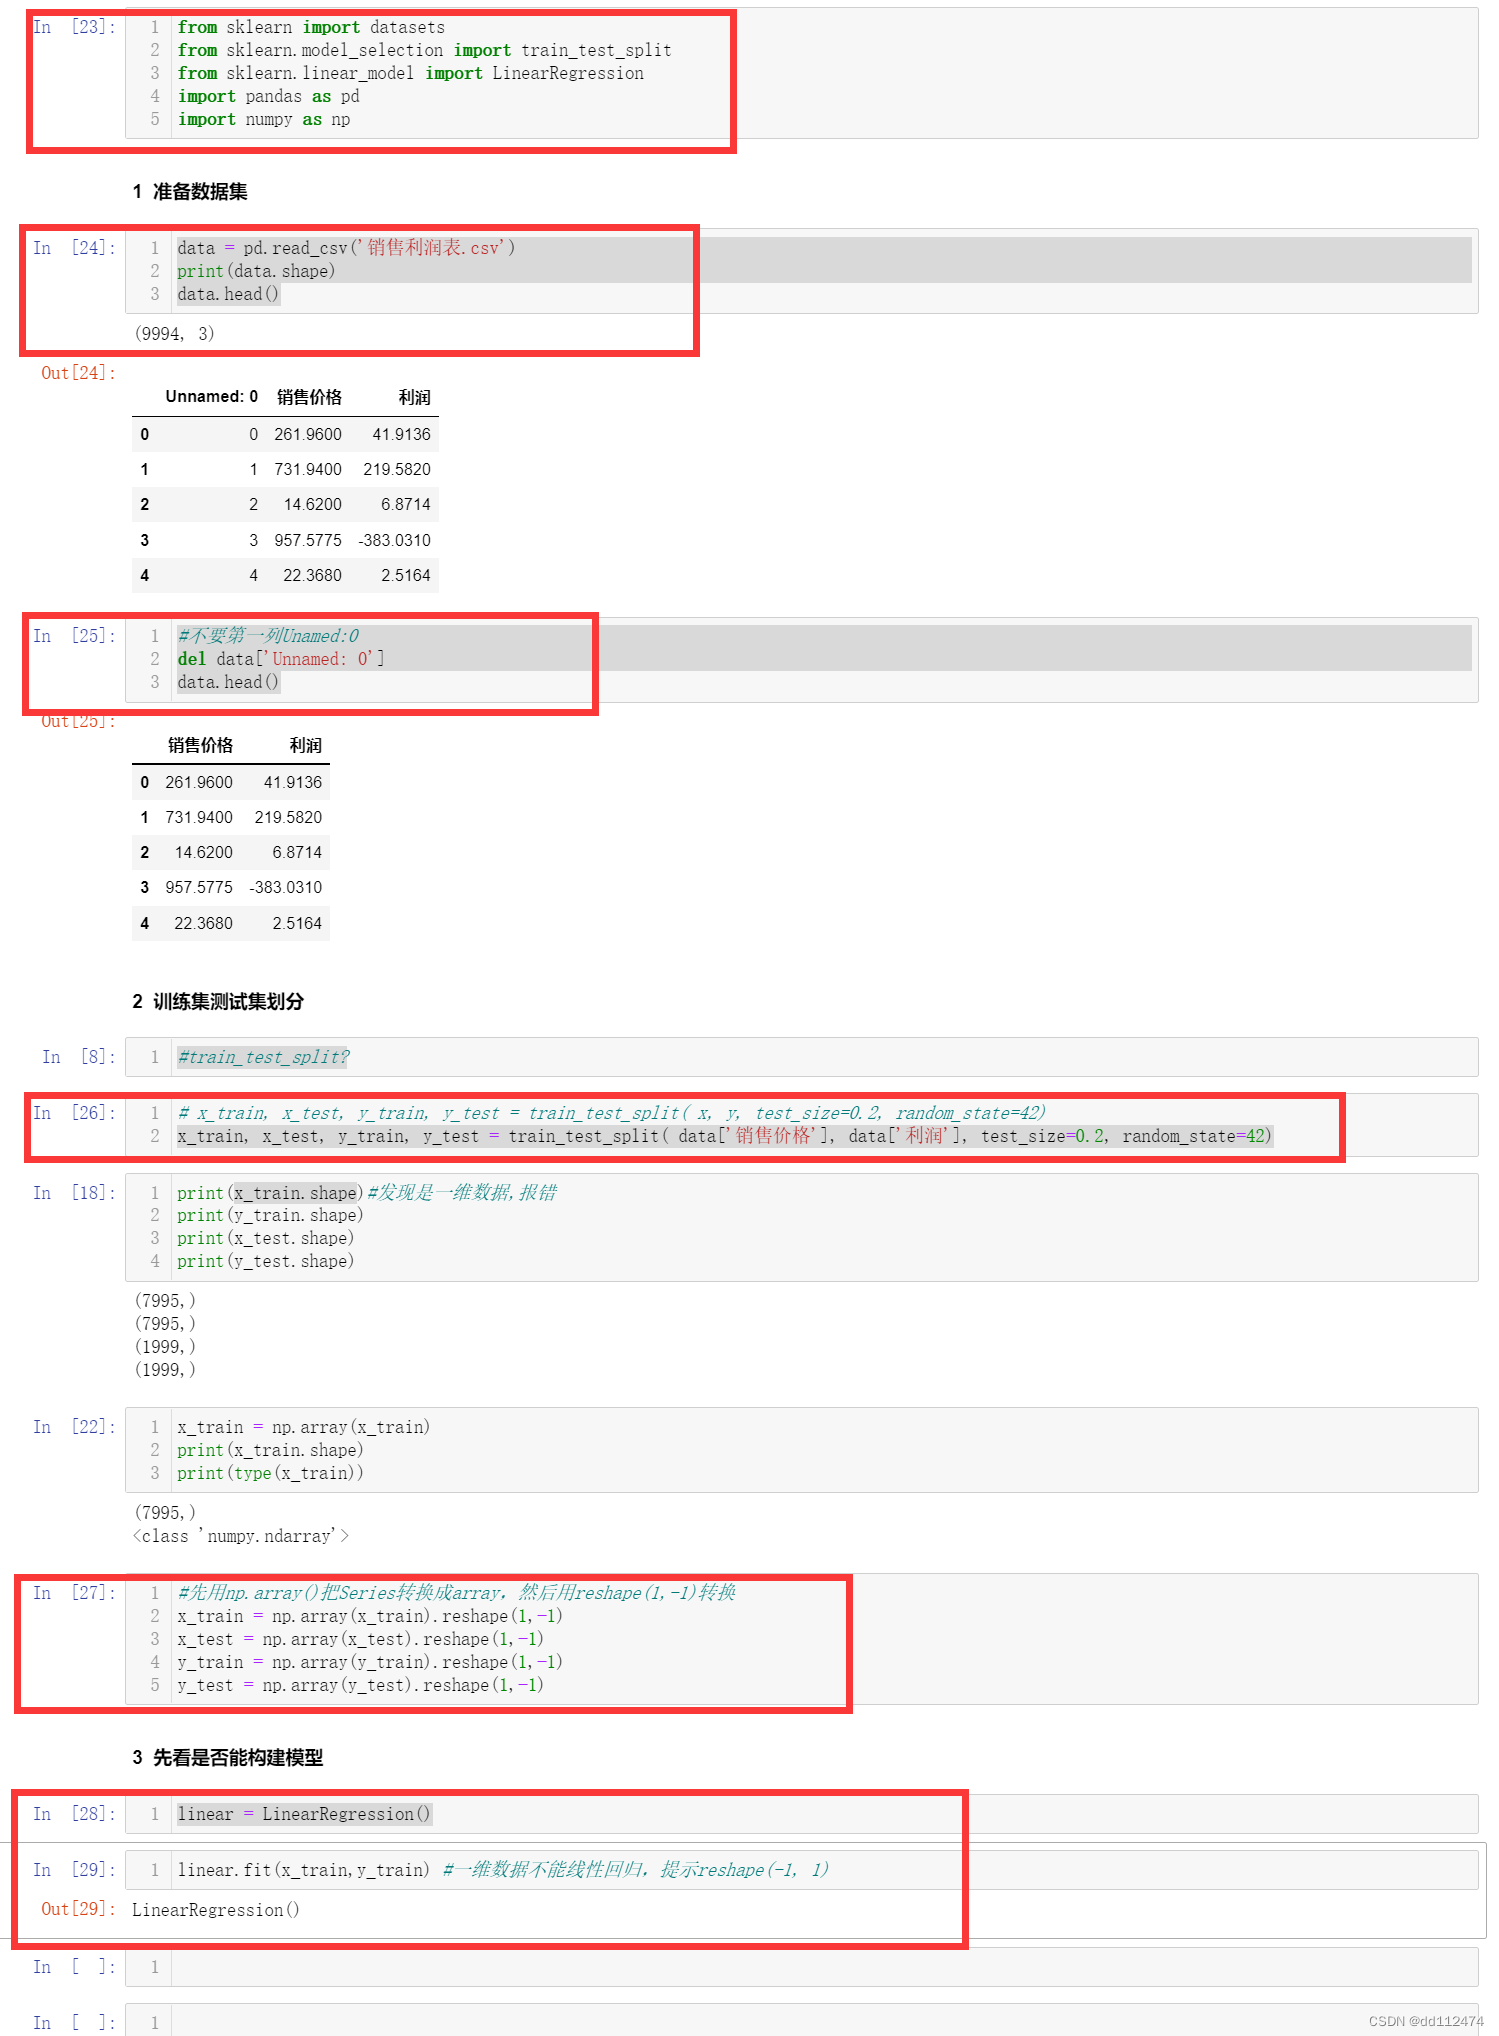
x_train, x_test, y_train, y_test = train_test_split( data['销售价格'], data['利润'], test_size=0.2, random_state=42)
看看是否能建模
linear = LinearRegression()
linear.fit(x_train,y_train) #一维数据不能线性回归,提示reshape(-1, 1)
结果报错了,报错代码是:1D表示1维,arry表示numpy中的数组
ValueError: Expected 2D array, got 1D array instead: array=[ 2.264 248.57 47.992 ... 26.352 7.36 273.666]. Reshape your data either using array.reshape(-1, 1) if your data has a single feature or array.reshape(1, -1) if it contains a single sample.
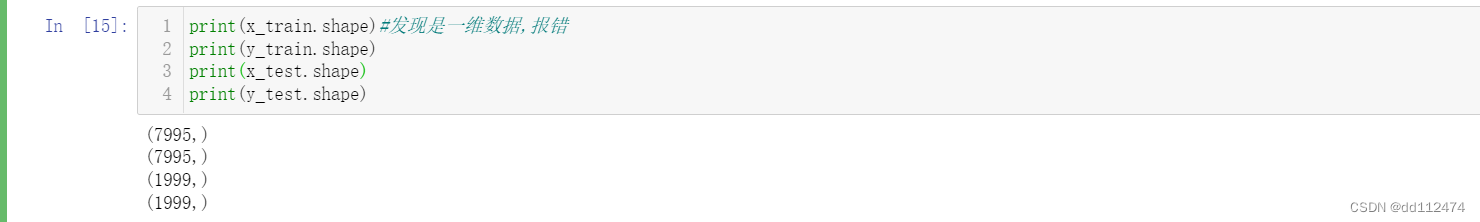
一维数组reshape(1,-1)变成2维
原因是我们这里是一维数组,线性回归必须要二维数组
直接x_train.reshape(1,-1)还是会报错,因为这里一维数组是Series类型,我们要把Series先转变成numpy
首先,在首行导入包 import numpy as np
法一:Series 转换成 array 再用reshape
方法是:np.array() 就可以把Series转换成array数组
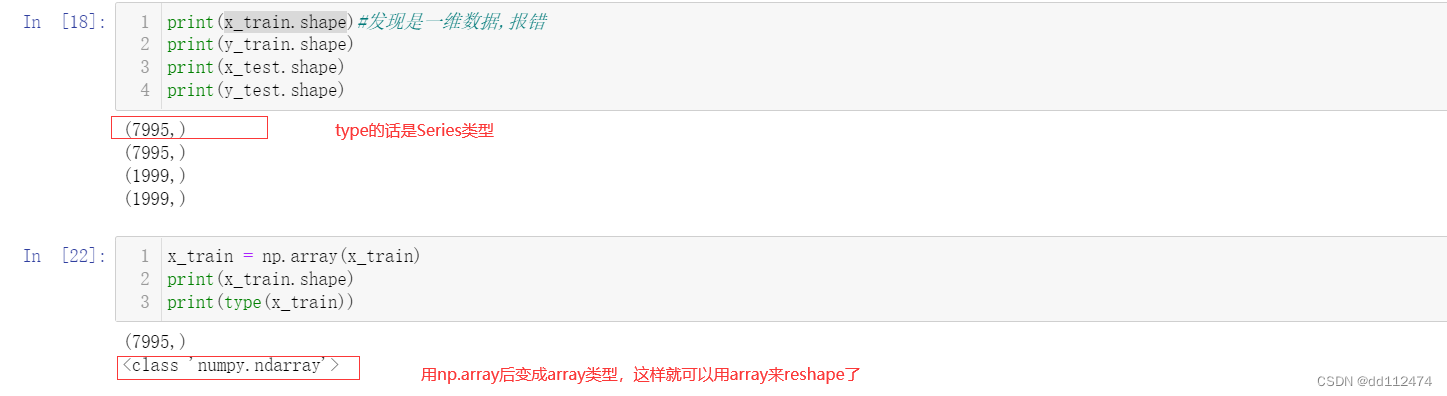
#先用np.array()把Series转换成array,然后用reshape(1,-1)转换
x_train = np.array(x_train).reshape(1,-1)
x_test = np.array(x_test).reshape(1,-1)
y_train = np.array(y_train).reshape(1,-1)
y_test = np.array(y_test).reshape(1,-1)
目前运行就可以建模了,红色部分表示有效代码,其余部分自己打草稿用
调参
代码和boston那里完全一样
result = []
for inercept in [True,False]: #截距
    for norm in [True,False]:  #归一化
        linear = LinearRegression(fit_intercept=inercept,normalize=norm)
        linear.fit(x_train,y_train)


        d = {'fit_intercept':inercept,'normalize':norm,'score':linear.score(x_test,y_test),'coef':linear.coef_ ,
             'intercept':linear.intercept_}
        result.append(d)

result_df = pd.DataFrame(result)
result_df
但是报错了,有两种报错形式,是同一个意思:数组的行列反了,应该把reshape(-1,1)改成reshape(1,-1)


修改
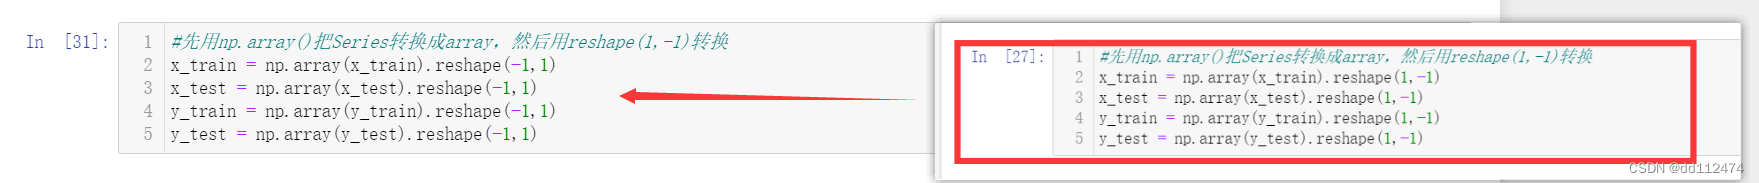
这样就能运行了,结果为:

结果的准确性score全是负数,一是检查模型能不能调整优化,而是看看数据清洗转化是否出错,如果都没有那就不要用这个模型了,score要越接近1才越好
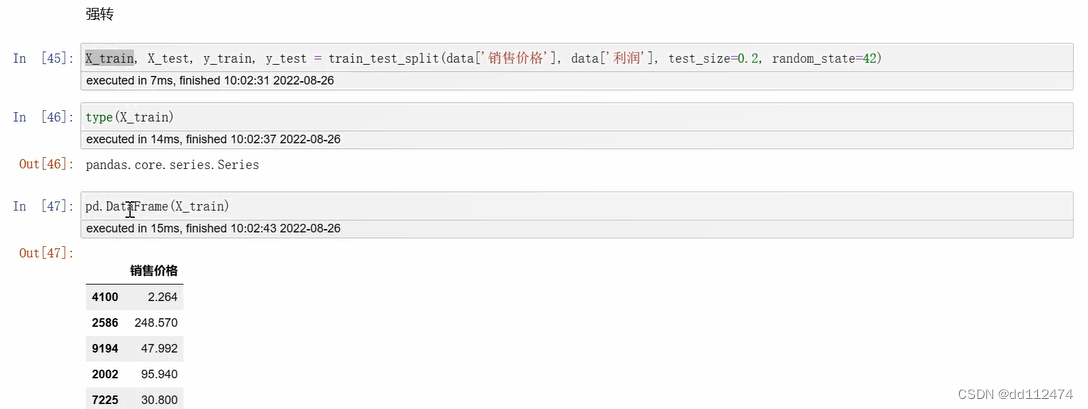
法二:DataFrame
直接把data['x'] 加一对[ ]变成data[['x']],查看type(x_train)就变成了Dataframe类型,后面直接调参就可以
x_train, x_test, y_train, y_test = train_test_split( data[['销售价格']], data[['利润']], test_size=0.2, random_state=42)
或者直接出来以后强制转换一次pd.DataFrame(x_train)也和加[ ]是一样的效果
全文代码:

from sklearn import datasets
from sklearn.model_selection import train_test_split
from sklearn.linear_model import LinearRegression
import pandas as pd
import numpy as np
data = pd.read_csv('销售利润表.csv')
print(data.shape)
data.head()
#不要第一列Unamed:0
del data['Unnamed: 0']
data.head()
x_train, x_test, y_train, y_test = train_test_split( data['销售价格'], data['利润'], test_size=0.2, random_state=42)
series转换成DataFrame方法 二选一
#先用np.array()把Series转换成array,然后用reshape(1,-1)转换
x_train = np.array(x_train).reshape(-1,1)
x_test = np.array(x_test).reshape(-1,1)
y_train = np.array(y_train).reshape(-1,1)
y_test = np.array(y_test).reshape(-1,1)
#DataFrame
x_train, x_test, y_train, y_test = train_test_split( data[['销售价格']], data[['利润']], test_size=0.2, random_state=42)
result = []
for inercept in [True,False]: #截距
    for norm in [True,False]:  #归一化
        linear = LinearRegression(fit_intercept=inercept,normalize=norm)
        linear.fit(x_train,y_train)


        d = {'fit_intercept':inercept,'normalize':norm,'score':linear.score(x_test,y_test),'coef':linear.coef_ ,
             'intercept':linear.intercept_}
        result.append(d)

result_df = pd.DataFrame(result)
result_df


 6642
6642


 被折叠的 条评论
为什么被折叠?
被折叠的 条评论
为什么被折叠?
 到【灌水乐园】发言


