


理解 `matplotlib.pyplot.savefig` 的 `bbox_inches` 和 `pad_inches` 参数
在使用 matplotlib 绘图并保存为图片时,savefig 是一个非常重要的函数。它可以帮助我们将绘制的图保存成文件格式,比如 PNG、JPEG、PDF 等。然而,有时保存的图片可能会出现边距过大或内容被裁剪的情况,这时就需要用到 bbox_inches 和 pad_inches 参数来调整图片的边框。
什么是 bbox_inches?
简单来说,bbox_inches 就是告诉 savefig 保存图像时,要保存多大的一块区域:
- 默认值是
None:这意味着保存整个图,包括所有的边距。 - 设置为
'tight':这会自动计算图像内容的紧凑范围,只保存图表的主要部分,去掉多余的空白边框。
举个例子:
import matplotlib.pyplot as plt

# 绘制一个简单的图
plt.plot([0, 1, 2], [0, 1, 4])
plt.title("Example Plot")

# 保存图片,默认模式(会有较大的空白边距)
plt.savefig("default.png")

# 保存图片,使用 bbox_inches='tight' 去掉多余的空白
plt.savefig("tight.png", bbox_inches='tight')
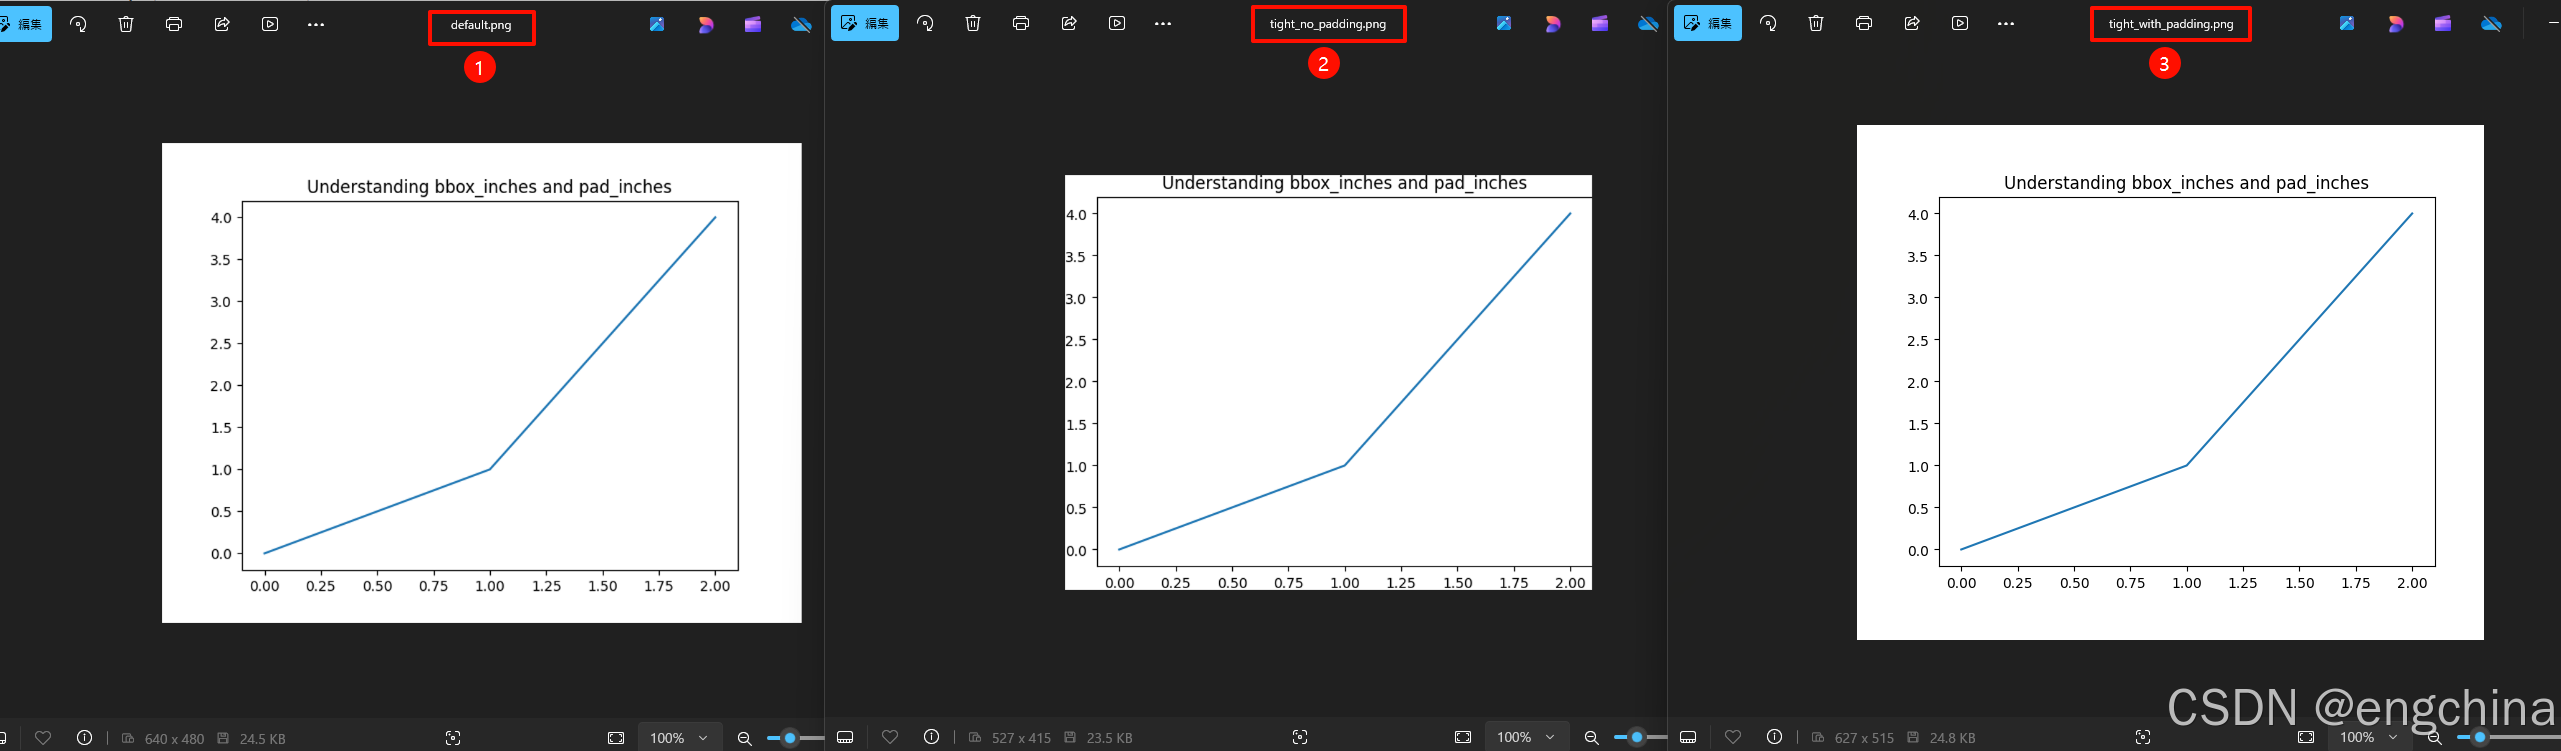
效果对比:
default.png:图片有很多空白边距。tight.png:图片只保留了主要内容,去掉了多余的空白。
什么是 pad_inches?
pad_inches 是配合 bbox_inches='tight' 使用的。它决定了在紧凑模式下(tight)图像内容与边框之间要留多少额外的空间。单位是英寸。
- 默认值是
0.1:这会留出一点点空间,让内容不显得太紧。 - 设置为一个更大的值(如
0.5):可以增加边距,让内容看起来更松散。 - 设置为
0:完全没有额外的边距,内容会紧贴图像边缘。
举个例子:
import matplotlib.pyplot as plt

# 绘制一个简单的图
plt.plot([0, 1, 2], [0, 1, 4])
plt.title("Example Plot with Padding")

# 保存图片,去掉多余边距,但加大 padding
plt.savefig("tight_with_padding.png", bbox_inches='tight', pad_inches=0.5)

# 保存图片,去掉多余边距,但没有 padding
plt.savefig("tight_no_padding.png", bbox_inches='tight', pad_inches=0)
效果对比:
tight_with_padding.png:图片内容周围有一定的空白,显得更松散。tight_no_padding.png:图片内容直接贴着边缘,看起来更紧凑。
总结
bbox_inches决定保存图像时的裁剪范围:'tight'可以去掉多余的空白边框。None会保存整个图(包括空白)。
pad_inches决定裁剪后的图像内容与边框之间的额外间距:- 数值越大,边距越多;
- 数值为
0,则没有边距。
完整代码示例
import matplotlib.pyplot as plt

# 创建图表
plt.plot([0, 1, 2], [0, 1, 4])
plt.title("Understanding bbox_inches and pad_inches")

# 保存图像,默认模式
plt.savefig("default.png")

# 保存图像,去掉多余空白,增加边距
plt.savefig("tight_with_padding.png", bbox_inches='tight', pad_inches=0.5)

# 保存图像,去掉多余空白,没有边距
plt.savefig("tight_no_padding.png", bbox_inches='tight', pad_inches=0)
运行上述代码后,你会得到三张图片,可以通过对比清楚地理解这两个参数的作用。
希望这篇文章能帮助你更好地使用 savefig 参数,让你的图像保存更符合预期!


 4013
4013

 被折叠的 条评论
为什么被折叠?
被折叠的 条评论
为什么被折叠?
 到【灌水乐园】发言


