


用 C++ 和 libgd 来绘图
[TOC]
旧文转贴, 代码很久以前写的, 大约至今有十年了, 最近看到有人问如何用 C++ 来生成图表.
有一个 graphviz 的开源库可以用, 它用了自己的领域特定语言 DSL: dot 来生成图表, 具体应用可见 http://graphviz.org/
当然也可以不用这么重的开源库, 这里介绍了以前写的一个chart 库, 几百行代码, 采用了比较原始的作法, 调用了 libgd 基础API, 如画点, 画线等原子方法来绘制图表, 可以应用于一些比较简单的场合
实例
先看看生成的图表实例
折线图和鱼骨头图
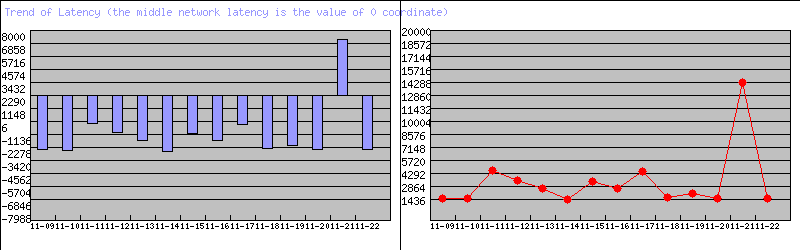
这里写图片描述
圆饼图和直方图
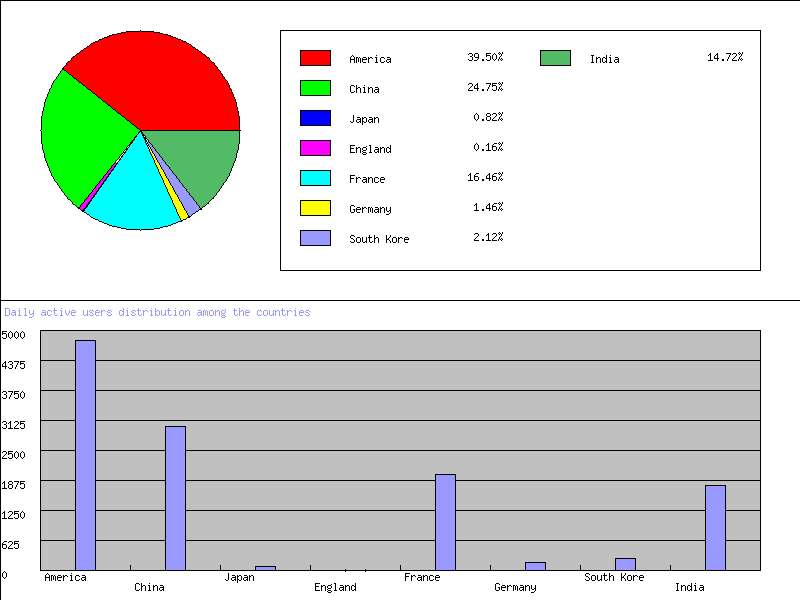
这里写图片描述
示例代码
上面两个图表由以下几十行代码来实现
#include "TinyUtil.h"
#include "TinyChart.h"
#include <stdio.h>
#include <stdlib.h>
#include <string.h>
#include <memory>


int main(int argc, char **argv)
{
    printf("-- write image by gd ---");
    {
        STR_VEC xScales;
        xScales.reserve(10);
        xScales.push_back("11-09");
        xScales.push_back("11-10");
        xScales.push_back("11-11");
        xScales.push_back("11-12");
        xScales.push_back("11-13");
        xScales.push_back("11-14");
        xScales.push_back("11-15");
        xScales.push_back("11-16");
        xScales.push_back("11-17");
        xScales.push_back("11-18");
        xScales.push_back("11-19");
        xScales.push_back("11-20");
        xScales.push_back("11-21");
        xScales.push_back("11-22");

        INT_VEC yScales;
        yScales.reserve(10);
        yScales.push_back(200);
        yScales.push_back(130);
        yScales.push_back(3456);
        yScales.push_back(2345);
        yScales.push_back(1320);
        yScales.push_back(30);
        yScales.push_back(2200);
        yScales.push_back(1330);
        yScales.push_back(3330);
        yScales.push_back(332);
        yScales.push_back(788);
        yScales.push_back(200);
        yScales.push_back(13890);
        yScales.push_back(200);

        TinyTrendlineDiagram* pt = new TinyTrendlineDiagram(
                "latency_trendline.png", 800, 250);
        pt->SetTitle("Trend of Latency (the middle network latency is the value of 0 coordinate)");
        pt->SetLabels(xScales);
        pt->SetValues(yScales);

        pt->Draw();
        pt->WriteImage();
        delete pt;
    }

    {
        STR_VEC xScales;
        xScales.push_back("America");
        xScales.push_back("China");
        xScales.push_back("Japan");
        xScales.push_back("England");
        xScales.push_back("France");
        xScales.push_back("Germany");
        xScales.push_back("South Korean");
        xScales.push_back("India");

        INT_VEC yScales;
        yScales.push_back(4800);
        yScales.push_back(3008);
        yScales.push_back(100);
        yScales.push_back(20);
        yScales.push_back(2000);
        yScales.push_back(178);
        yScales.push_back(258);
        yScales.push_back(1789);

        TinyDistributionDiagram* pd = new TinyDistributionDiagram(
                "users_distribution.png", 800, 600);
        pd->SetTitle("Daily active users distribution among the countries");
        pd->SetLabels(xScales);
        pd->SetValues(yScales);
        pd->Draw();
        pd->WriteImage();
        delete pd;
    }
    return 0;
}
�设计与实现
其实, 也就是封装了libgd 的原子操作, 绘制了基本的图形单元
�1) 首先下载并编译依赖库 libgd
- 下载: Download libgd-2.2.1.tar.gz
- 解压: tar xvfz libgd-2.2.1.tar.gz
- 构建步骤 build steps
    cd libgd-2.2.1
    mkdir bld
    cd bld
    cmake -DENABLE_PNG=1 -DENABLE_JPEG=1 -DENABLE_FREETYPE=1 ..
    make
    make install
- 然后实现上图所示的类, 加上测试, 约有千余行代码, 放在 github 里
https://gist.github.com/walterfan/b7200fd3e5315ec1e16551fca096a67e
附以上类图的源码, 由 http://yuml.me 生成
// Cool Class Diagram
[Sharp]^[Arc]
[Arc]^[Eclipse]
[Arc]^[Circle]
[Sharp]^[Rectangle]
[Sharp]^[Scale]
[Sharp]^[Chart]
[Chart]^[CurveChart]
[Chart]^[ColumnChart]
[Chart]^[PieChart]
[Chart]^[HistogramChart]
[Diagram]-[note:Aggregate chart{bg:wheat}]
[Diagram]^[DistributionDiagram]
[Diagram]^[TrendlineDiagram]
[TrendlineDiagram]<>-0..*>[CurveChart]
[TrendlineDiagram]<>-0..*>[ColumnChart]
[DistributionDiagram]<>-0..*>[PieChart]
[DistributionDiagram]<>-0..*>[HistogramChart]
接口如下, 代码比较老, 欢迎指正
#include <iostream>
#include <vector>
#include <string>
#include <map>

#include <math.h>
#include <stdio.h>
#include <string.h>
#include <stdlib.h>
#include <stdarg.h>
#include <time.h>

#include "gd.h"
#include "gdfonts.h"
#include "gdfontt.h"

using namespace std;

#define TinyPoint gdPoint
#define TinyFont gdFont
#define TinyColor int
#define WHITE 255,255,255
#define BLACK 0,0,0
#define GRAY 192,192,192
#define RED 255,0,0
#define GREEN 0,255,0
#define BLUE 0,0,255
#define MAGENTA 255,0,255
#define CYAN 0,255,255
#define YELLOW 255,255,0
#define AZURY 153,153,255
#define ORANGE_RED  255,36,00

#define PI 3.14159265357989

#ifdef NDEBUG
#define TRACE(msg)
#else
#define TRACE(msg)  cout<<__FILE__<<", "<<__LINE__<<": "<<msg<<endl;
#endif

typedef map<string, int, less<string>, allocator<int> > STR2INT_MAP;
typedef vector<int, allocator<int> > INT_VEC;
typedef vector<string, allocator<string> > STR_VEC;

const int NAMESIZE=256;
const int DAYS=14;

class TinyShape
{
public:
    TinyShape(gdImagePtr im)
    {
        m_pImage=im;
        m_nBorderWidth=1;
        SetBgColor(WHITE);
        SetFrColor(BLACK);
        SetBorderColor(BLACK);
        m_nBorderWidth=1;
    };
    void SetBgColor(int r,int g,int b)
    {
        m_BgColor=gdImageColorAllocate(m_pImage, r, g, b);
    };
    void SetFrColor(int r,int g,int b)
    {
        m_FrColor=gdImageColorAllocate(m_pImage, r, g, b);
    };

    void SetBorderColor(int r,int g,int b)
    {
        m_BorderColor=gdImageColorAllocate(m_pImage, r, g, b);
    };
    void SetBgColor(TinyColor color)
    {
        m_BgColor=color;
    };
    TinyColor GetBgColor()
    {
        return m_BgColor;
    };
    TinyColor GetBorderColor()
    {
        return m_BorderColor;
    };
    void SetFrColor(TinyColor color)
    {
        m_FrColor=color;
    };

    void SetBorderColor(TinyColor color)
    {
        m_BorderColor=color;
    };
    void SetBorderWidth(int w)
    {
        m_nBorderWidth=w;
    };
    virtual ~TinyShape()
    {
        m_pImage=NULL;
    };
    virtual void Draw() = 0;

    virtual void Fill() { };
protected:
    int m_nBorderWidth;
    gdImagePtr m_pImage;
    TinyColor m_BorderColor;
    TinyColor m_BgColor;
    TinyColor m_FrColor;
};

class TinyScale:public TinyShape
{
public:
    TinyScale(gdImagePtr im,TinyColor color):TinyShape(im)
    {
        m_FrColor=color;
        m_pFont=gdFontSmall;//gdFontTiny
        m_TopLeftPoint.x=0;
        m_TopLeftPoint.y=0;
        m_OffsetPoint.x=0;
        m_OffsetPoint.y=0;

    };
    void Draw()
    {
        gdImageString(m_pImage, m_pFont, m_TopLeftPoint.x+m_OffsetPoint.x, m_TopLeftPoint.y+m_OffsetPoint.y, (unsigned char*)m_text, m_FrColor);
    };
    void Draw(char * text)
    {
        TRACE(" TinyScale:Draw(char * text): " <<m_TopLeftPoint.x<<", "<<m_TopLeftPoint.y<<","<<text);
        gdImageString(m_pImage, m_pFont, m_TopLeftPoint.x+m_OffsetPoint.x, m_TopLeftPoint.y+m_OffsetPoint.y, (unsigned char*)text, m_FrColor);
    };
    void SetPosition(int x,int y)
    {
        m_TopLeftPoint.x=x;
        m_TopLeftPoint.y=y;
    };
    void SetOffset(int x,int y)
    {
        m_OffsetPoint.x=x;
        m_OffsetPoint.y=y;
    };
    void SetText(const char * text)
    {
        strncpy(m_text,text,10);
    };
    void SetFont(gdFontPtr font)
    {
        m_pFont=font;
    };
    TinyScale(gdImagePtr im,int x,int y):TinyShape(im)
    {
        m_TopLeftPoint.x=x;
        m_TopLeftPoint.y=y;
        SetFrColor(BLACK);
        m_pFont=gdFontSmall;
        m_OffsetPoint.x=0;
        m_OffsetPoint.y=0;
    };
    virtual ~TinyScale()
    {};
public:
    TinyPoint m_TopLeftPoint;
    TinyPoint m_OffsetPoint;
    char m_text[10];
private:
    gdFontPtr m_pFont;
};

class TinyRectangle:public TinyShape
{
public:
    TinyRectangle(gdImagePtr im,int x1,int y1,int x2,int y2):TinyShape(im)
    {
        SetSize(x1,y1,x2,y2);
    };
    TinyRectangle(gdImagePtr im):TinyShape(im)
    {

    };
    virtual ~TinyRectangle(){};

    TinyPoint m_TopLeftPoint;
    TinyPoint m_BottomRightPoint;

    void SetSize(int x1,int y1,int x2,int y2)
    {
        m_TopLeftPoint.x=x1;
        m_TopLeftPoint.y=y1;
        m_BottomRightPoint.x=x2;
        m_BottomRightPoint.y=y2;
    };
    void Draw()
    {
        gdImageRectangle(m_pImage,m_TopLeftPoint.x,m_TopLeftPoint.y,\
                        m_BottomRightPoint.x,m_BottomRightPoint.y,m_BorderColor);
    };
    void Fill()
    {
        //gdImageFilledRectangle(m_pImage,m_TopLeftPoint.x,m_TopLeftPoint.y,\
        //              m_BottomRightPoint.x,m_BottomRightPoint.y,m_BgColor);
        int x=(m_TopLeftPoint.x+m_BottomRightPoint.x)/2;
        int y=(m_TopLeftPoint.y+m_BottomRightPoint.y)/2;
        gdImageFillToBorder(m_pImage,x,y,m_BorderColor,m_BgColor);
    };
};
class TinyArc:public TinyShape
{
public:
    TinyArc(gdImagePtr im,int x,int y):TinyShape(im)
    {
        SetCentre(x,y);
        SetAngel(0,0);
        SetSize(0,0);
    };
    TinyArc(gdImagePtr im):TinyShape(im)
    {
    };
    virtual ~TinyArc()
    {};

    TinyPoint GetCentre() {
        return m_Centre;
    }

    void SetCentre(int x,int y)
    {
        m_Centre.x=x;
        m_Centre.y=y;
    };

    void SetAngel(float start,float end)
    {
        m_nStartAngle=start;
        m_nEndAngle=end;
    };

    void SetSize(int w,int h)
    {
        m_nWidth=w;
        m_nHeight=h;
    };
    void Draw()
    {
        gdImageArc(m_pImage,m_Centre.x,m_Centre.y,m_nWidth,m_nHeight,(int)ceil(m_nStartAngle),(int)ceil(m_nEndAngle),m_BorderColor);
    };
    void Fill()
    {
        gdImageFillToBorder(m_pImage,m_Centre.x,m_Centre.y,m_BorderColor,m_BgColor);
    };
    void Fill(TinyColor bordercolor,TinyColor bgcolor)
    {
        gdImageFillToBorder(m_pImage,m_Centre.x,m_Centre.y,bordercolor,bgcolor);
    };
protected:
    TinyPoint m_Centre;
    int m_nWidth;
    int m_nHeight;
    float m_nStartAngle;
    float m_nEndAngle;
};


class TinyCircle:public TinyArc
{
public:
    TinyCircle(gdImagePtr im,int x,int y,int r):TinyArc(im,x,y)
    {
        SetRadius(r);
        m_nStartAngle=0;
        m_nEndAngle=360;
    };
    TinyCircle(gdImagePtr im):TinyArc(im)
    {
    };
    void SetRadius(int r)
    {
        m_Radius=r;
        m_nWidth=2*r;
        m_nHeight=2*r;
    };
    virtual ~TinyCircle()
    {};
private:
    int m_Radius;
};

class TinyEclipse:public TinyArc
{
public:
    TinyEclipse(gdImagePtr im,int x,int y,int r):TinyArc(im,x,y)
    {
        SetRadius(r);
        m_nStartAngle=0;
        m_nEndAngle=0;
    };
    TinyEclipse(gdImagePtr im):TinyArc(im)
    {
    };
    void SetRadius(int r)
    {
        m_Radius=r;
        m_nWidth=2*r;
        m_nHeight=2*r;
    };

    void Draw()
    {
        float fAngle=m_nEndAngle-m_nStartAngle;
        if(fAngle<1)
            return;
        m_Points[0].x=m_Centre.x;
        m_Points[0].y=m_Centre.y;
        m_Points[1].x=m_Centre.x+(int)ceil(m_Radius*cos(m_nStartAngle*PI/180));
        m_Points[1].y=m_Centre.y-(int)ceil(m_Radius*sin(m_nStartAngle*PI/180));
        m_Points[2].x=m_Centre.x+(int)ceil(m_Radius*cos(m_nEndAngle*PI/180));
        m_Points[2].y=m_Centre.y-(int)ceil(m_Radius*sin(m_nEndAngle*PI/180));

        gdImageLine(m_pImage,m_Points[0].x,m_Points[0].y,m_Points[1].x,m_Points[1].y,m_BorderColor);
        gdImageLine(m_pImage,m_Points[0].x,m_Points[0].y,m_Points[2].x,m_Points[2].y,m_BorderColor);
    };
    void Fill()
    {
        int nAngle=(int)ceil(m_nEndAngle-m_nStartAngle);
        int x,y;
        TRACE("Angle: "<<m_nStartAngle<<"-"<<m_nEndAngle<<"="<<nAngle);
        if(nAngle<1)
            return;
        else if(nAngle<=10)
        {
            x=(m_Points[0].x+(m_Points[1].x+m_Points[2].x)/2)/2;
            y=(m_Points[0].y+(m_Points[1].y+m_Points[2].y)/2)/2;
        }
        else if(nAngle<=180)
        {
            x=(m_Points[1].x+m_Points[2].x)/2;
            y=(m_Points[1].y+m_Points[2].y)/2;
        }
        else
        {
            x=2*m_Centre.x-(m_Points[1].x+m_Points[2].x)/2;
            y=2*m_Centre.y-(m_Points[1].y+m_Points[2].y)/2;
        }
        TRACE("see "<<x<<","<<y);

        //gdImageFillToBorder(m_pImage,x,y,m_BgColor,m_BorderColor);
        gdImageFill(m_pImage,x,y,m_BgColor);
        //gdImageFilledPolygon(m_pImage, m_Points, 3, m_BgColor);

    };
    virtual ~TinyEclipse()
    {};
private:
    int m_Radius;
    TinyPoint m_Points[3];
};

class TinyChart:public TinyShape
{
protected:
    TinyColor m_FrameColor;
    TinyColor m_GridColor;
    TinyColor m_TitleColor;
    char m_szTitle[NAMESIZE];
    int m_nGridWidth;
    int m_nShapeWidth;

    TinyPoint m_TopLeftPoint;
    TinyPoint m_BottomRightPoint;
    TinyPoint m_FrameTopLeftPoint;
    TinyPoint m_FrameBottomRightPoint;

    int m_nLeftMargin;
    int m_nRightMargin;
    int m_nTopMargin;
    int m_nBottomMargin;

    int GetBigerScale(int nScale);

public:
    TinyChart(gdImagePtr im):TinyShape(im)
    {
        SetGridColor(BLACK);
        SetFrameColor(GRAY);
        SetTitleColor(AZURY);
        m_nGridWidth=1;
        m_nShapeWidth=10;
        m_nLeftMargin=0;
        m_nRightMargin=0;
        m_nTopMargin=0;
        m_nBottomMargin=0;
        strncpy(m_szTitle,"",NAMESIZE);

    };
    virtual ~TinyChart()
    {
        for(int i = 0;i<m_Shapes.size();i++)
            delete m_Shapes[i];
        m_Shapes.clear();

        for(int j = 0;j<m_xScale.size();j++)
            delete m_xScale[j];
        m_xScale.clear();

        for(int k = 0;k<m_yScale.size();k++)
            delete m_yScale[k];
        m_yScale.clear();
    };


    void SetPosition(int x1,int y1,int x2,int y2)
    {
        m_TopLeftPoint.x=x1;
        m_TopLeftPoint.y=y1;
        m_BottomRightPoint.x=x2;
        m_BottomRightPoint.y=y2;
    }

    void SetMargin(int top,int bottom,int left,int right)
    {
        m_nLeftMargin=left;
        m_nRightMargin=right;
        m_nTopMargin=top;
        m_nBottomMargin=bottom;
    }
    void SetShapeWidth(int width)
    {
        m_nShapeWidth=width;
    };
    void SetGridColor(int r,int g,int b)
    {
        m_GridColor=gdImageColorAllocate(m_pImage, r, g, b);
    };
    void SetTitleColor(int r,int g,int b)
    {
        m_TitleColor=gdImageColorAllocate(m_pImage, r, g, b);
    };
    void SetFrameColor(int r,int g,int b)
    {
        m_FrameColor=gdImageColorAllocate(m_pImage, r, g, b);
    };

    virtual void SetVerticalScale(INT_VEC& vecYScale){};
    virtual void SetHorziontalScale(STR_VEC& vecXScale);
    //virtual void SetData(){};
    virtual void SetTitle(char* title);

    virtual void Plot(){};
    virtual void DrawTitle();
    virtual void DrawGrid();

    void DrawFrame();
    void DrawBorder();

    void Draw();
protected:
    INT_VEC m_nData;
    vector<TinyShape*> m_Shapes;
    vector<TinyScale*> m_xScale;
    vector<TinyScale*> m_yScale;
    int m_nVerticalScale;
    int m_nHorziontalScale;
};

class TinyCurveChart:public TinyChart
{
public:
    void Plot();
    //void SetData();
    void SetVerticalScale(INT_VEC& vecYScale);
    //void SetHorziontalScale(STR_VEC& vecXScale,int nXScale){};
    TinyCurveChart(gdImagePtr im):TinyChart(im)
    {
        SetFrColor(RED);
    };
    virtual ~TinyCurveChart()
    {};
    void DrawTitle(){};
};

class TinyColumnChart:public TinyChart
{
public:
    void Plot();
    void SetVerticalScale(INT_VEC& vecYScale);
    //void SetHorziontalScale(STR_VEC& vecXScale,int nXScale){};
    TinyColumnChart(gdImagePtr im):TinyChart(im)
    {};
    virtual ~TinyColumnChart()
    {};
};
class TinyHistogram:public TinyChart
{
public:
    void Plot();
    void SetHorziontalScale(STR_VEC& vecXScale);
    void SetVerticalScale(INT_VEC& vecYScale);
    //void SetHorziontalScale(STR_VEC& vecXScale,int nXScale){};
    TinyHistogram(gdImagePtr im):TinyChart(im)
    {};
    virtual ~TinyHistogram()
    {};
};

class TinyPieChart:public TinyChart
{
public:
    void Draw();
    void DrawLegend();
    void DrawFrame();
    void Plot();
    void SetHorziontalScale(STR_VEC& vecXScale);
    void SetVerticalScale(INT_VEC& vecYScale);
    TinyColor GetRandColor(int index=-1);
    TinyPieChart(gdImagePtr im):TinyChart(im), m_nSum(0)
    {

    };
    virtual ~TinyPieChart()
    {};
private:
    int m_nSum;
};
class TinyDiagram
{

public:

    TinyDiagram(const char* filename,int width,int height);
    virtual ~TinyDiagram();

    int SetFileName(const char* szFilename);

    int SetTitle(const char* szTitle);

    virtual void Draw() {};

    void DrawBorder();

    void SetLabels(STR_VEC& xScales);

    void SetValues(INT_VEC& yScales);

    gdImagePtr GetImage()
    {
        return m_pImage;
    };
    void WriteImage();
protected:
    gdImagePtr m_pImage;

    int m_nWidth;
    int m_nHeight;

    char m_szFileName[NAMESIZE];
    char m_szTitle[NAMESIZE];

    INT_VEC m_vecData;
    STR_VEC m_vecName;
};

class TinyTrendlineDiagram:public TinyDiagram
{
public:
    TinyCurveChart* m_pCurveChart;
    TinyColumnChart* m_pColumnChart;

    TinyTrendlineDiagram(const char* filename,int width,int height);
    virtual ~TinyTrendlineDiagram();
    void Draw();
};

class TinyDistributionDiagram:public TinyDiagram
{
public:
    TinyPieChart* m_pPieChart;
    TinyHistogram* m_pHistogram;
    void Draw();
    TinyDistributionDiagram(const char* filename,int width,int height);
    virtual ~TinyDistributionDiagram();

};


#endif /* UTIL_TINYCHART_H_ */


 1383
1383

 被折叠的 条评论
为什么被折叠?
被折叠的 条评论
为什么被折叠?
 到【灌水乐园】发言


