


import numpy as np
import importlib as mpl
import pandas as pd
import seaborn as sns
import matplotlib.pyplot as plt
%matplotlib inline

#数据的准备
df =pd.read_csv('mtcars.csv')
x=df.loc[:,['mpg']]#提取想要的数据
df['mpg_z']=(x-x.mean())/x.std() #标准化的处理
df['color']=['red' if x<0 else 'green' for x in df['mpg_z']] #生成颜色的标签列
df.sort_values('mpg_z',inplace=True)
df.reset_index(inplace=True,drop=True)
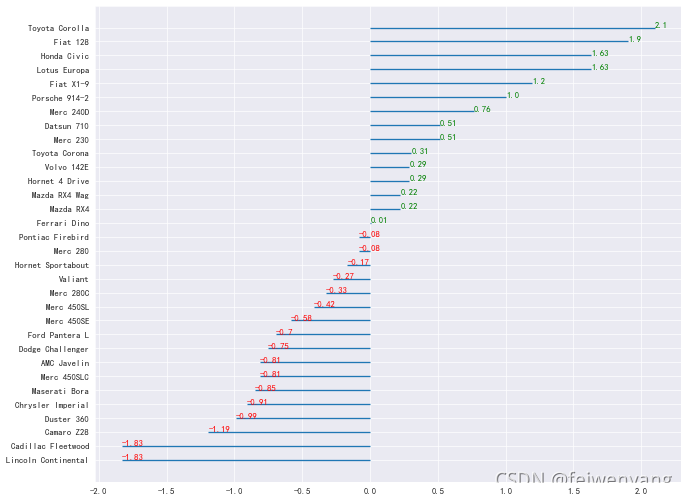
#简单的绘制
plt.figure(figsize=(12,10),dpi=63)
#绘制基本的图像
plt.hlines(y=df.cars,xmin=0,xmax=df.mpg_z)
#添加文本
for i in range(df.shape[0]): #对每一个数据进行循坏
x=df.mpg_z[i] #获取每一个 x的值
y=df.index[i] #获取每一的y的值
s=str(round(df.mpg_z[i],2)) #四舍五入保留2位小数
plt.text(x,y,s,color=df.color[i])#绘制简单的文本图

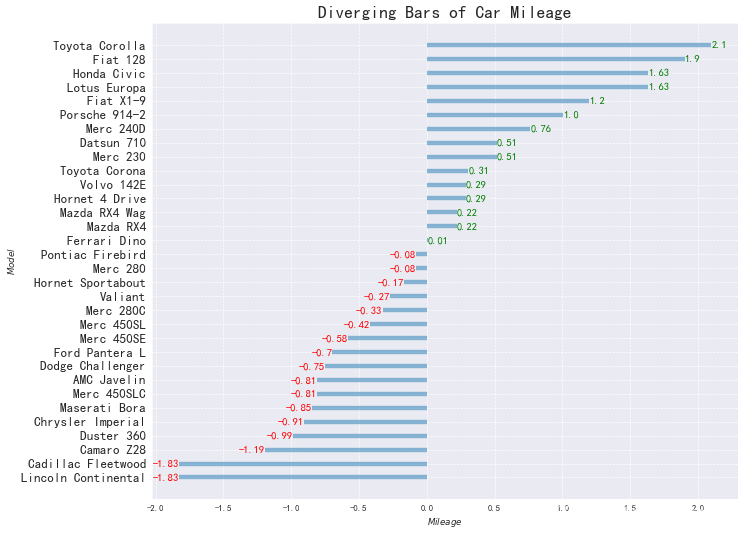
#简单的绘制
plt.figure(figsize=(12,10),dpi=63)
#绘制基本的图像
plt.hlines(y=df.cars,xmin=0, xmax=df.mpg_z,alpha=0.5,linewidth=5)
#添加文本
for i in range(df.shape[0]): #对每一个数据进行循坏
    x=df.mpg_z[i]           #获取每一个 x的值
    y=df.index[i]          #获取每一的y的值
    s=str(round(df.mpg_z[i],2)) #四舍五入保留2位小数
    plt.text(x,y,s,
            fontdict={'color':df.color[i],'size':12} #此处添加颜色与尺寸,以字典的形式打包
            ,horizontalalignment='right'if x<0 else 'left'#水平对齐参数,有left,right ,center三种选择,文本的那一边与位置的对齐
            ,verticalalignment ='center'                        #垂直对齐参数,常用的有bottom,top,center
            )#绘制简单的文本图

#添加装饰

plt.gca().set(ylabel='$Model$', xlabel='$Mileage$')
plt.yticks(df.index, df.cars, fontsize=15)
plt.title('Diverging Bars of Car Mileage', fontdict={'size':20})
plt.grid(linestyle='--', alpha=1)
plt.show()


 1万+
1万+


 被折叠的 条评论
为什么被折叠?
被折叠的 条评论
为什么被折叠?
 到【灌水乐园】发言


