


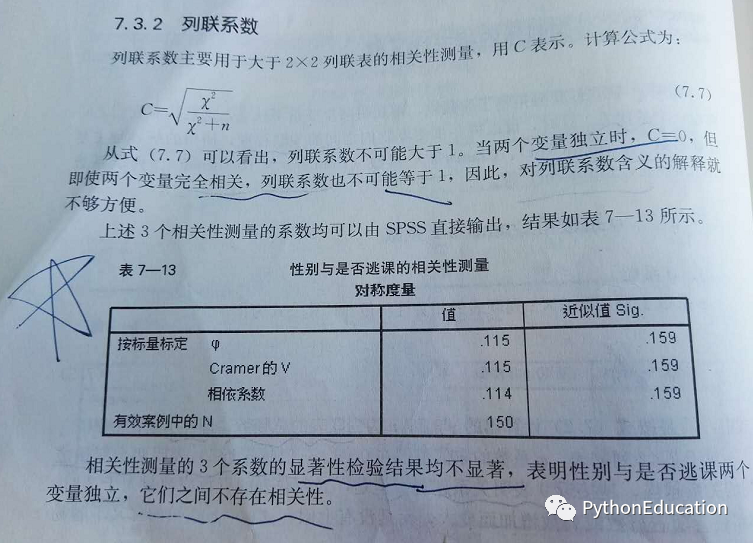
统计学,风控建模经常遇到卡方分箱算法ChiMerge。卡方分箱在金融信贷风控领域是逻辑回归评分卡的核心,让分箱具有统计学意义(单调性)。卡方分箱在生物医药领域可以比较两种药物或两组病人是否具有显著区别。但很多建模人员搞不清楚卡方分箱原理。先给大家介绍一下经常被提到的卡方分布和卡方检验是什么。欢迎各位同学学习更多相关知识python金融风控评分卡模型和数据分析:https://edu.csdn.net/combo/detail/1927
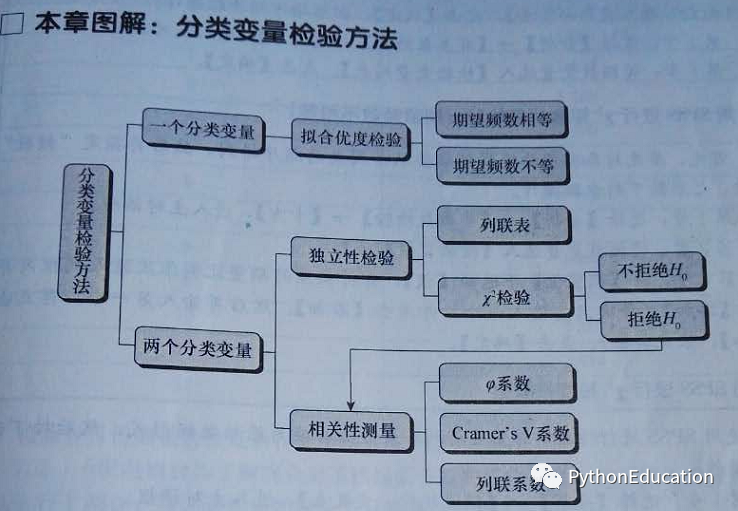
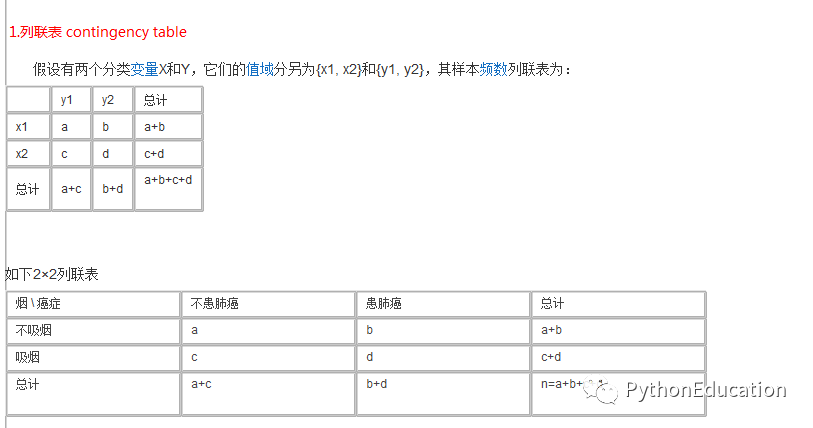
分类变量检验方法

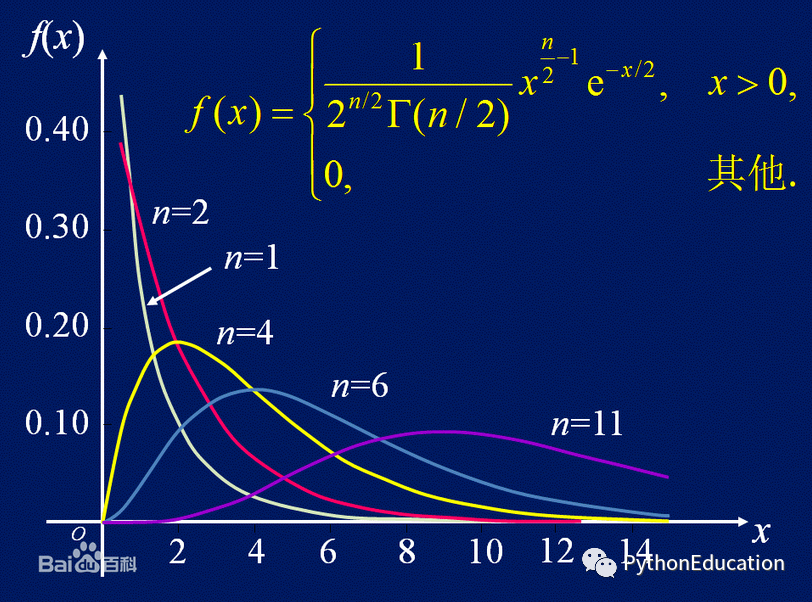
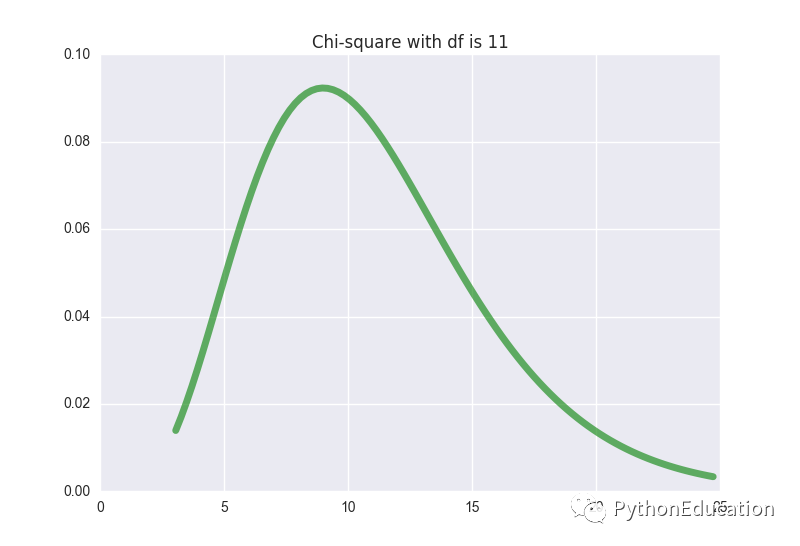
卡方分布绘图
如果多个符合正态分布的独立随机变量z1,z2,z3.....zk,
z1+z2+z3+....z_k呈现卡方分布,自由度k.
有几个正态分布相加,就有几个自由度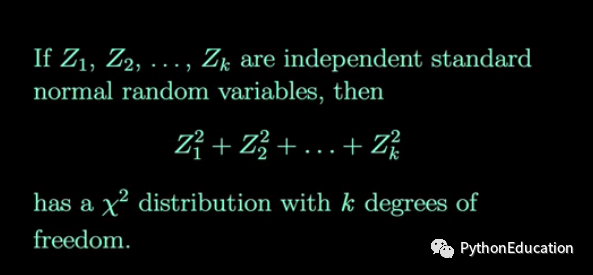
# -*- coding: utf-8 -*-
'''
python金融风控评分卡模型和数据分析:https://edu.csdn.net/combo/detail/1927
讲师csdn学院教学主页:https://edu.csdn.net/lecturer/5602
'''
import numpy as np
import matplotlib.pyplot as plt
import scipy.stats as stats
import seaborn as sns
import math,pylab,matplotlib,numpy
from matplotlib.font_manager import FontProperties
#设置中文字体
font=FontProperties(fname=r"c:\windows\fonts\simsun.ttc",size=15)
n=10
#绘制自由度为n的卡方分布图,n表示生成卡方数组的个数
def Get_chisquareDatas(n):
#标准正太分布
normalDistribution=stats.norm(0,1)
list_data=[]
for i in range(n):
normal_data=normalDistribution.rvs(30)
chisquare_data=normal_data**2
list_data.append(chisquare_data)
return list_data
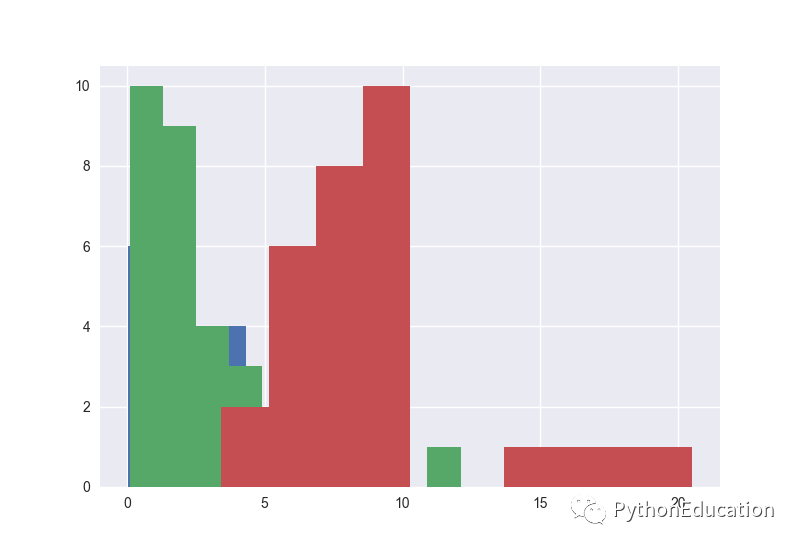
def Plot_chisquare(n):
list_data=Get_chisquareDatas(n)
sum_data=sum(list_data)
plt.hist(sum_data)
Plot_chisquare(2)
Plot_chisquare(3)
Plot_chisquare(10)官方绘图代码
# -*- coding: utf-8 -*-
 '''
python金融风控评分卡模型和数据分析:https://edu.csdn.net/combo/detail/1927
讲师csdn学院教学主页:https://edu.csdn.net/lecturer/5602
'''
from scipy.stats import chi2
import matplotlib.pyplot as plt
import numpy as np
fig, ax = plt.subplots(1, 1)

df = 20
mean, var, skew, kurt = chi2.stats(df, moments='mvsk')

#绘制函数的起始点和终止点
#pdf为概率密度函数
#百分比函数(PPF) :the inverse of the CDF. PPF  函数和连续分布函数CDF相逆,
#比如输入哪一个点,可以得到低于等于20的概率?
#ppf(0.01, df)表示输入哪个点,得到概率低于0.01
initial=chi2.ppf(0.01, df)
end=chi2.ppf(0.99, df)
x = np.linspace(initial,end, 100)

#概率密度函数用于绘图
ax.plot(x, chi2.pdf(x, df), 'r-', lw=5, alpha=0.6, label='chi2 pdf')
plt.title("df is %d"%df)
plt.show()
卡方检验代码
可汗学院的问题
# -*- coding: utf-8 -*-
'''
python金融风控评分卡模型和数据分析:https://edu.csdn.net/combo/detail/1927
讲师csdn学院教学主页:https://edu.csdn.net/lecturer/5602
'''
'''
卡方公式(o-e)^2 / e
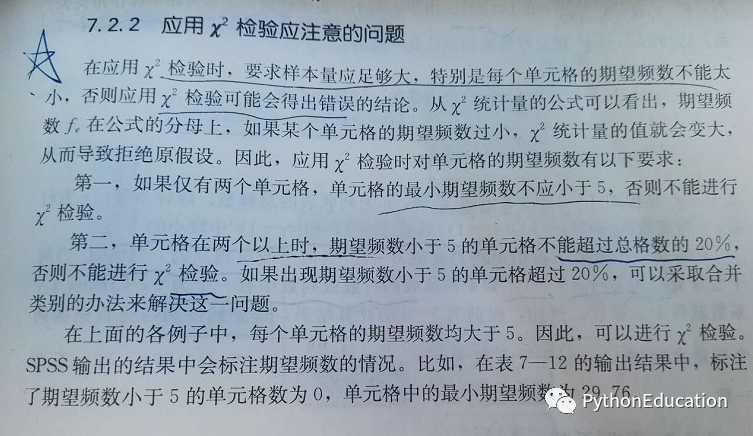
期望值和收集到数据不能低于5,o(observed)观察到的数据,e(expected)表示期望的数据
(o-e)平方,最后除以期望的数据e
'''
import numpy as np
from scipy import stats
from scipy.stats import chisquare
list_observe=[30,14,34,45,57,20]
list_expect=[20,20,30,40,60,30]
std=np.std(data,ddof=1)
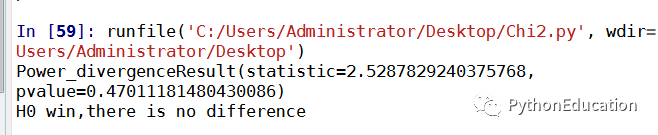
print(chisquare(f_obs=list_observe, f_exp=list_expect))
p=chisquare(f_obs=list_observe, f_exp=list_expect)[1]
'''
返回NAN,无穷小
'''
if p>0.05 or p=="nan":
print"H0 win,there is no difference"
else:
print"H1 win,there is difference"contigency table联立表
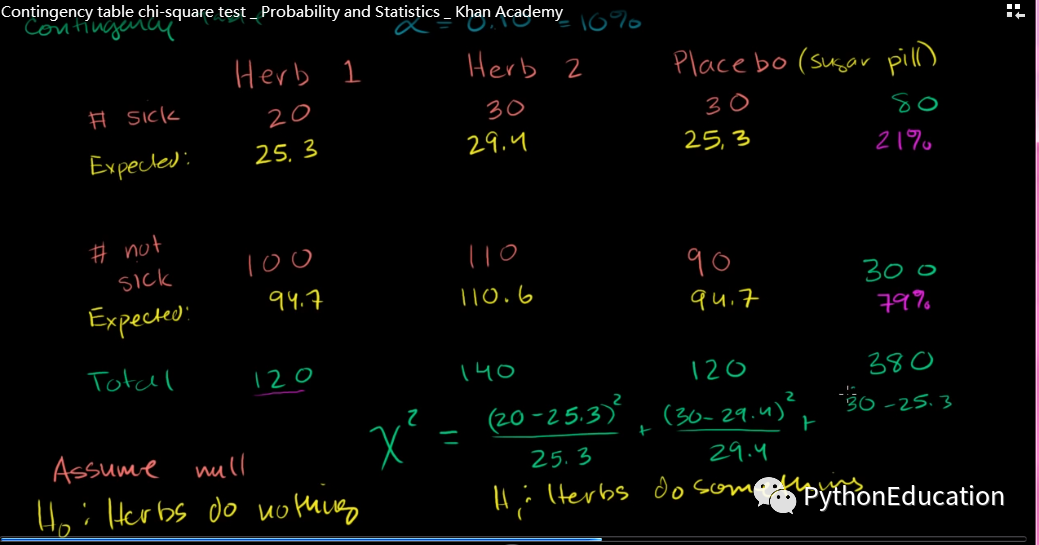
测试数据
第一行:草本药1,草本药2,安慰剂
第二行:生病和非生病
H0:草本药和疾病无关系
H1:草本药和疾病有关系
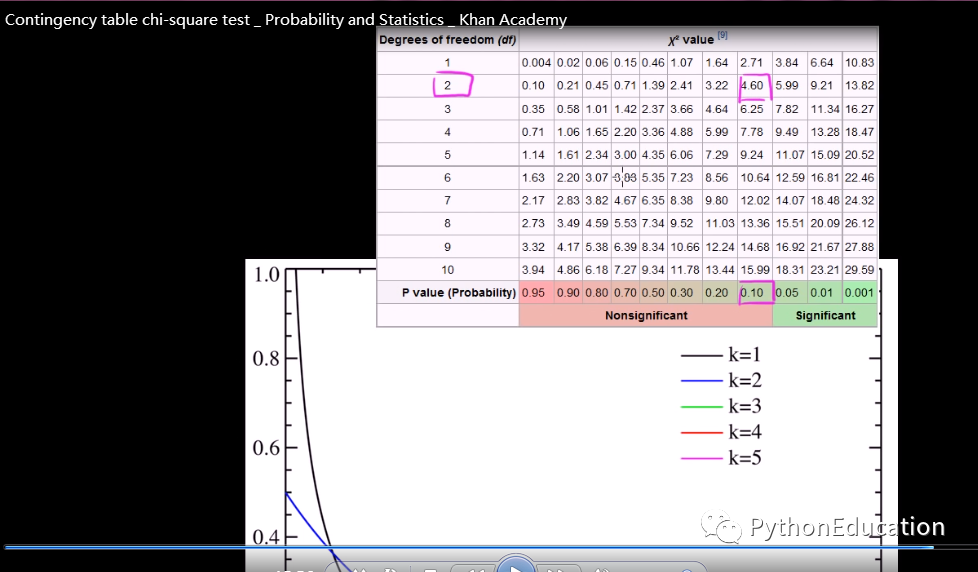
可汗学院计算出来的卡方值2.53;自由度2,显著性0.1,的关键值4.6
卡方值2.53<关键值4.6, H0成立,两者无关系
python代码与可汗学院算出结果一致,此版本体现算法推导过程。缺点就是要自己计算出期望值列表
-*- coding: utf-8 -*-
'''
python金融风控评分卡模型和数据分析:https://edu.csdn.net/combo/detail/1927
讲师csdn学院教学主页:https://edu.csdn.net/lecturer/5602
卡方公式(o-e)^2 / e期望值和收集到数据不能低于5,o(observed)观察到的数据,e(expected)表示期望的数据(o-e)平方,最后除以期望的数据e<br>联立表contigency table计算'''

from scipy.stats import chisquare
list_observe=[34,38,28,50]<br>list_expect=[29.76,42.2,32.24,45.77]
row=2
colume=2
def Contigency_table(row,colume,list_observe,list_expect):
    degreeFreedom=(row-1)*(colume-1)
    print(chisquare(f_obs=list_observe, f_exp=list_expect,ddof=degreeFreedom)) p=chisquare(f_obs=list_observe, f_exp=list_expect)[1]
 if p>0.05 or p=="nan":
      print"H0 win,there is no difference"<br>
 else:
  print"H1 win,there is difference"
Contigency_table(row,colume,list_observe,list_expect)
此版本不用算出期望值,更加方便,参考的是2*2联立表,自由度=1,critical value=2.7
# -*- coding: utf-8 -*-
'''
python金融风控评分卡模型和数据分析:https://edu.csdn.net/combo/detail/1927
讲师csdn学院教学主页:https://edu.csdn.net/lecturer/5602
'''
#独立性检验test for independence,也是卡方检验chi_square
#前提条件:a,b,c,d 必须大于5
#2.706是判断标准(90概率),值越大,越有关,值越小,越无关
def value_independence(a,b,c,d):
if a>=5 and b>=5 and c>=5 and d>=5:
return ((a+b+c+d)*(a*d-b*c)**2)/float((a+b)*(c+d)*(a+c)*(b+d))
#返回True表示有关
#返回False表示无关
def judge_independence(num_independence):
if num_independence>2.706:
print ("there is relationship")
return True
else:
print("there is no relationship")
return False
a=34
b=38
c=28
d=50
chi_square=value_independence(a,b,c,d)
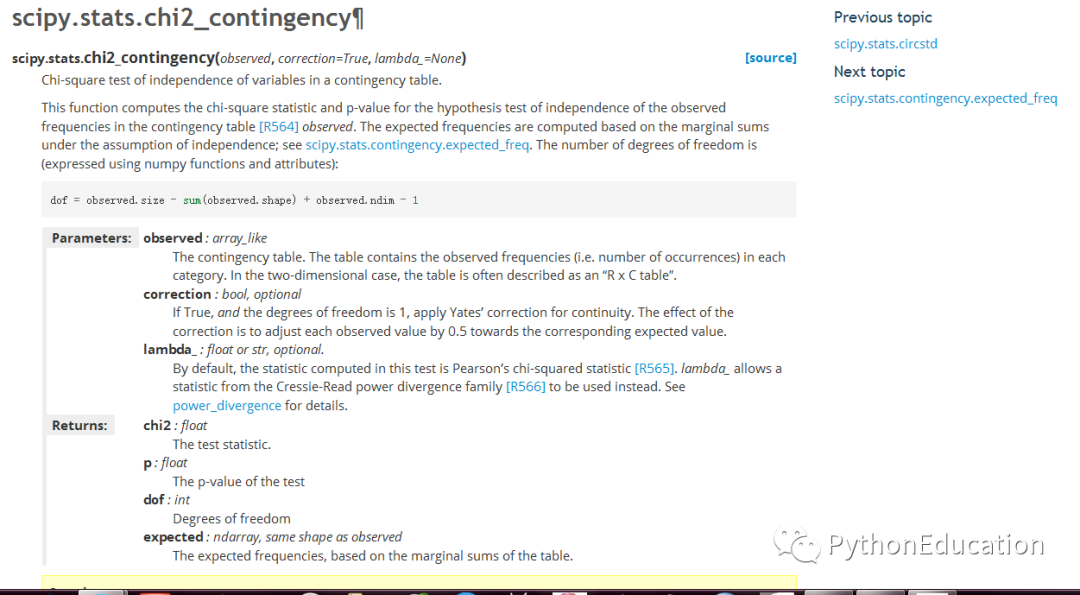
relation=judge_independence(chi_square)python官网版本,更加方便和科学
https://docs.scipy.org/doc/scipy/reference/generated/scipy.stats.chi2_contingency.html
import scipy.stats as stats

data = np.array([[43,9],
[44,4]])
V, p, dof, expected = stats.chi2_contingency(data)
print(p)
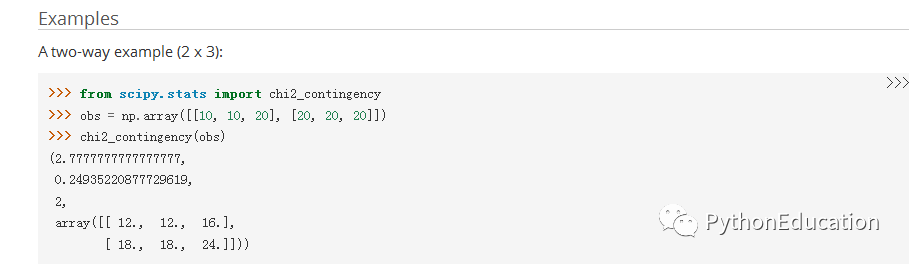
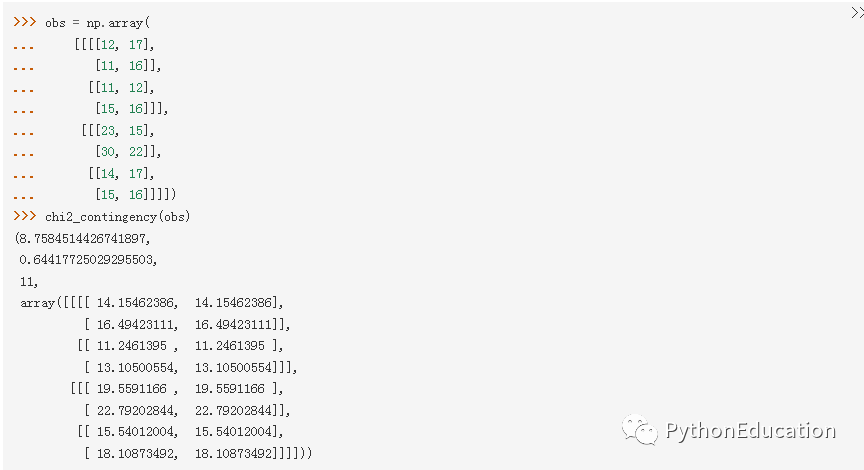
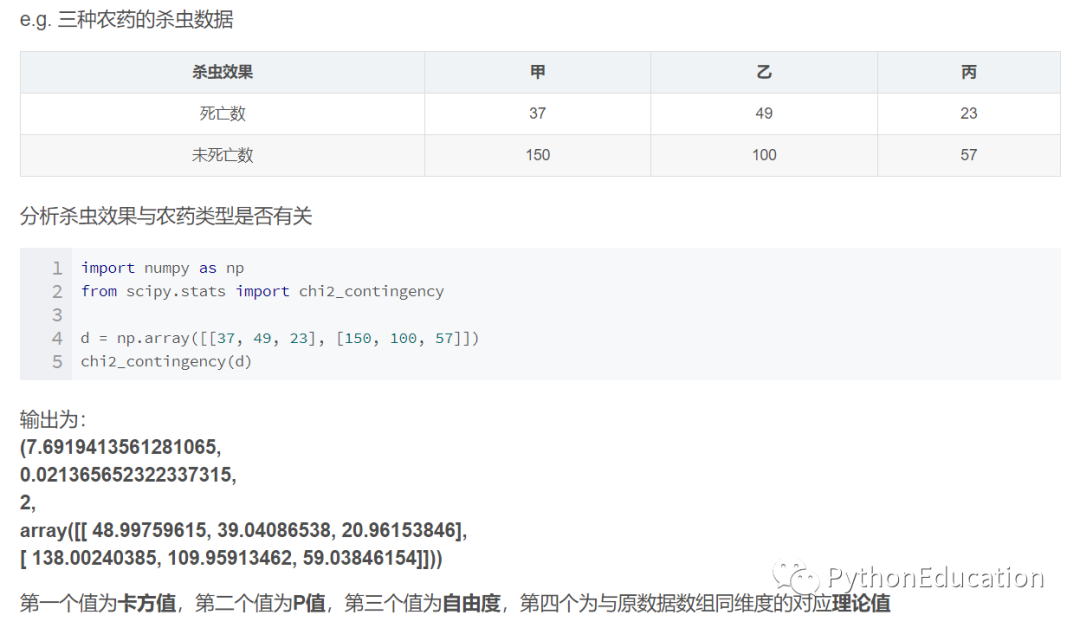
例子:
欢迎访问讲师csdn学院教学主页:https://edu.csdn.net/lecturer/5602,学习更多python金融模型实战。


 被折叠的 条评论
为什么被折叠?
被折叠的 条评论
为什么被折叠?
 到【灌水乐园】发言


