import pandas
from datetime import date, time, datetime, timedelta
import numpy
import matplotlib.pyplot as pp
import mpl_finance as mpl
import pandas_datareader.data as web
import tushare as ts
import tool
x=pp.figure(figsize = (12,8))
ax=x.add_subplot(1,1,1)
begin_time='20190101'
end_time='20190201'
index = pandas.date_range(begin_time, end_time, freq='D')
columns = ['open', 'close', 'high', 'low']
#从股市获取数据
token=tool.get_stock_stoken()
d=ts.pro_api(token)
x=d.daily(ts_code='002557.SZ',start_date=begin_time,end_date=end_time,fields='open,high,low,trade_date,close,change,pct_change')
#x=web.DataReader('000001.SS','google',begin_time,end_time)
print(x)
open=x['open']
close=x['close']
high=x['high']
low=x['low']
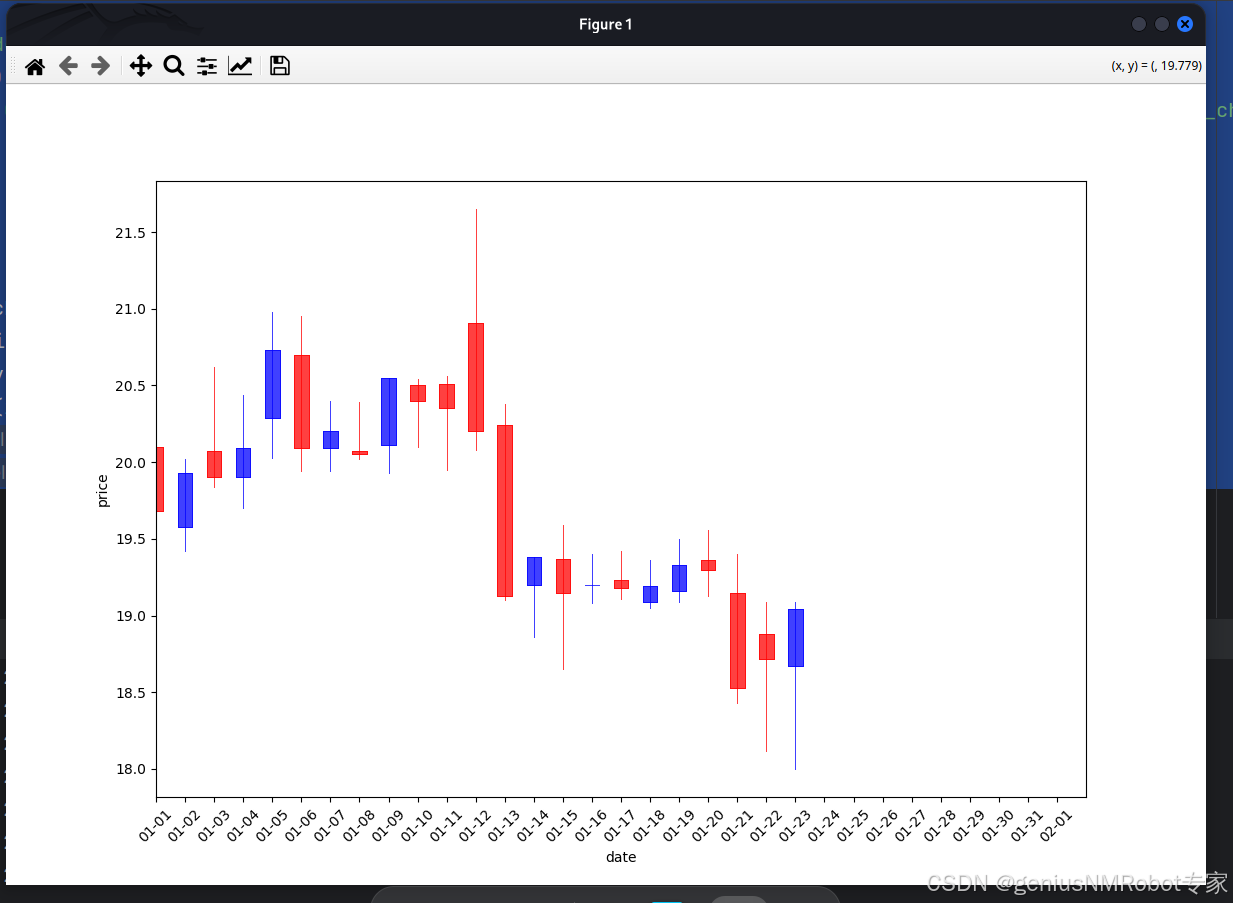
mpl.candlestick2_ochl(ax,open,close,high,low,width=0.5,colorup='r',colordown='b')
ax.set_xlim(1,index.__len__())
ax.set_xticks(numpy.arange(0,index.__len__(),1))
ax.set_xticklabels(index.strftime('%m-%d'),rotation=45)
ax.set_xlabel('date',fontsize=10)
ax.set_ylabel('price',fontsize=10)
pp.show()


 被折叠的 条评论
为什么被折叠?
被折叠的 条评论
为什么被折叠?
 到【灌水乐园】发言


