


在用cyclictest测试实时性的时候通过输出的结果能清晰的看到最大值、最小值平均值,但具体的分布情况无法直接得到。
本文记录根据网上的博客实际测试结果。
1、先在开发板上运行测试程序
./cyclictest -l 1000000 -m -Sp99 --policy=fifo -h 25000 -q >output
得到统计结果output文件,把文件考到ubuntu下
#!/bin/bash
# 1. Run cyclictest
# 2. Get maximum latency
max=`grep "Max Latencies" output | tr " " "\n" | sort -n | tail -1 | sed s/^0*//`
# 3. Grep data lines, remove empty lines and create a common field separator
grep -v -e "^#" -e "^$" output | tr " " "\t" >histogram
# 4. Set the number of cores, for example
cores=2
# 5. Create two-column data sets with latency classes and frequency values for each core, for example
for i in `seq 1 $cores`
do
column=`expr $i + 1`
cut -f1,$column histogram >histogram$i
done
# 6. Create plot command header
echo -n -e "set title \"Latency plot\"\n\
set terminal png\n\
set xlabel \"Latency (us), max $max us\"\n\
set logscale y\n\
set xrange [0:400]\n\
set yrange [0.8:*]\n\
set ylabel \"Number of latency samples\"\n\
set output \"plot.png\"\n\
plot " >plotcmd
# 7. Append plot command data references
for i in `seq 1 $cores`
do
if test $i != 1
then
echo -n ", " >>plotcmd
fi
cpuno=`expr $i - 1`
if test $cpuno -lt 10
then
title=" CPU$cpuno"
else
title="CPU$cpuno"
fi
echo -n "\"histogram$i\" using 1:2 title \"$title\" with histeps" >>plotcmd
done
# 8. Execute plot command
gnuplot -persist <plotcmd
运行脚本,得到统计结果
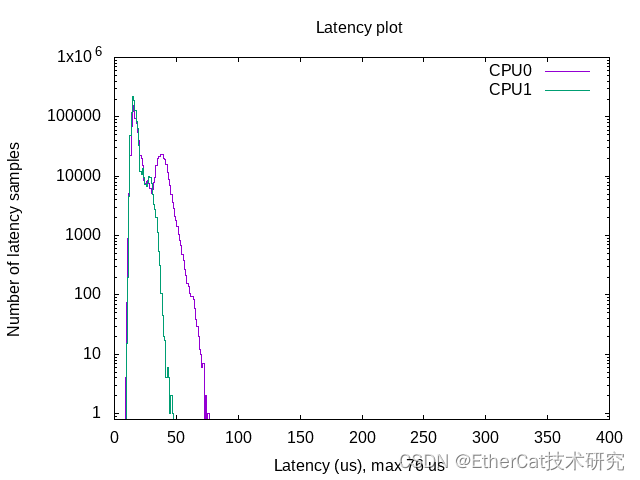
看到1核比0核实时性好,是因为外设中断在0核上。


 被折叠的 条评论
为什么被折叠?
被折叠的 条评论
为什么被折叠?
 到【灌水乐园】发言


