


 文章介绍了在MATLAB中如何设置图像的大小和位置,通过例子展示了使用Position属性调整Axes的尺寸。同时,讲解了如何在一个窗口内画多张子图,利用subplot函数实现布局。最后,阐述了运用print函数保存图像的不同格式,如dpng、djpeg等,并给出批量保存的示例。
目录
图像的大小和位置
MATLAB 中设置 Figure 和 Axes 的位置和尺寸 - 知乎 (zhihu.com) https://zhuanlan.zhihu.com/p/446968474示例:
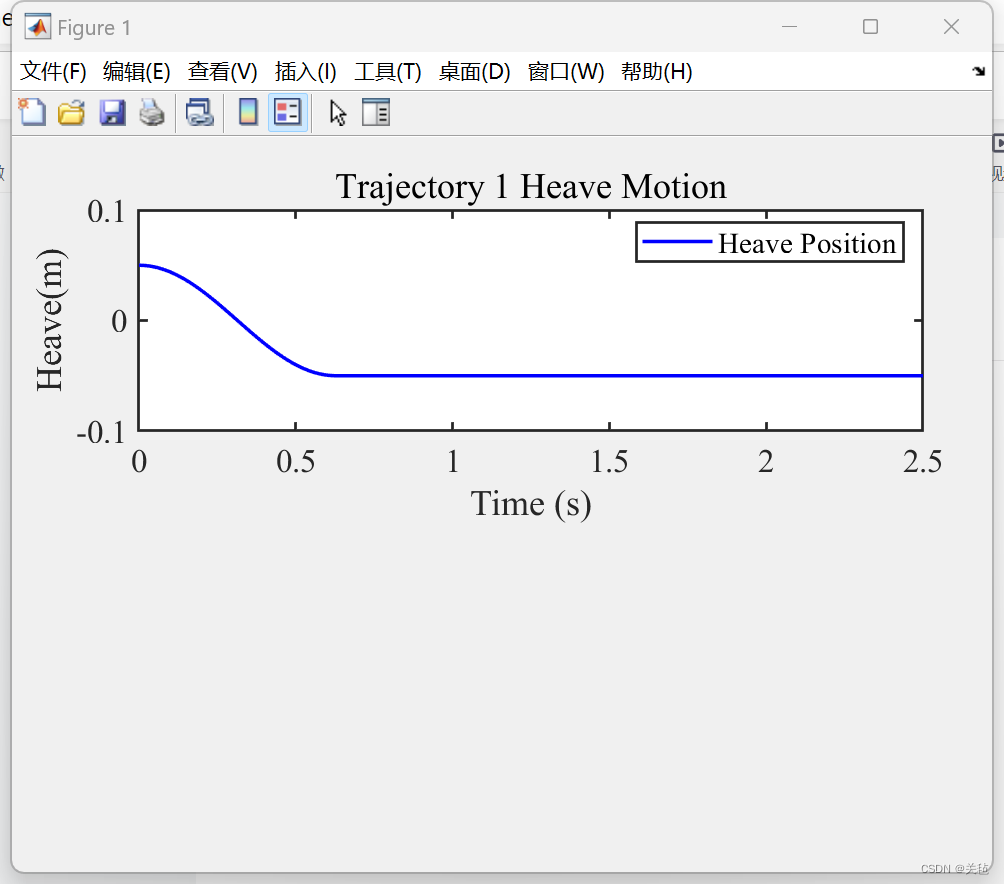
plot(t,y, 'Color', [0,0,1],'Linewidth',1.5);
set(gca,'Position', [.13 .60 .80 .30]);
set(gca,'linewidth',1.2,'fontsize',14,'fontname','Times');
xlim([0 2.5]);
ylim([-0.1 0.1]);
legend({'Heave Position'});
title('Trajectory 1 Heave Motion');
xlabel('Time (s)');
ylabel('Heave(m)');
一个窗口画多张子图片
(25条消息) Matlab如何在一个窗口绘制多张子图_matlab一个窗口画多个图_沉沙丶的博客-CSDN博客https://blog.csdn.net/sy243772901/article/details/115541794(26条消息) Matlab调整子图位置及大小_matlab设置画布大小_Lu_gl的博客-CSDN博客https://blog.csdn.net/Lu_gl/article/details/125875757
示例:
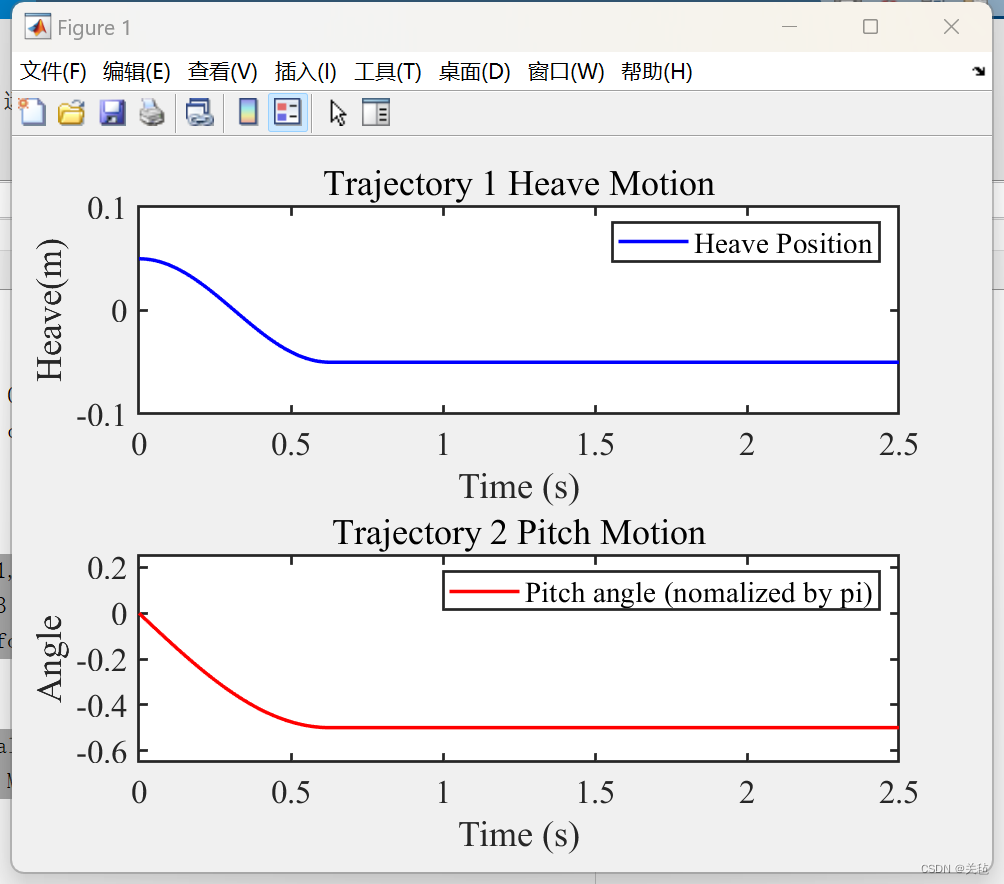
%上图
subplot(2,1,1)
plot(t,y, 'Color', [0,0,1],'Linewidth',1.5);
set(gca,'linewidth',1.2,'fontsize',14,'fontname','Times');
xlim([0 2.5]);
ylim([-0.1 0.1]);
legend({'Heave Position'});
title('Trajectory 1 Heave Motion');
xlabel('Time (s)');
ylabel('Heave(m)');%下图
subplot(2,1,2)
plot(t,y2 /pi, 'Color', [1,0,0],'Linewidth',1.5);
set(gca,'linewidth',1.2,'fontsize',14,'fontname','Times');
xlim([0 2.5]);
ylim([-0.65 0.25]);
legend({'Pitch angle (nomalized by pi)'});
title('Trajectory 2 Pitch Motion');
xlabel('Time (s)');
ylabel('Angle');
保存图片
print函数
使用plot函数后紧接着用print函数来保存图像。print的格式为: print(figure_handle,fileformat,filename),其中的三个参数:
(1)figure_handle:图形句柄,如果图形窗口标题栏是“Figure 3”,则句柄就是3;也可以直接用gcf获取当前窗口句柄
(2)fileformat:单引号字符串,指定存储格式:
png格式: ‘-dpng’
jpeg格式: ‘-djpeg’,
tiff格式: ‘-dtiff’
bmp格式: ‘-dbitmap’
gif格式:’-dgif’
emf无损格式:’-dmeta’
(3)filename:'文件名'
批量保存图片示例:
name=['轨迹1_',num2str(k)];
print(gcf,'-dpng',name);


 24万+
24万+

 被折叠的 条评论
为什么被折叠?
被折叠的 条评论
为什么被折叠?
 到【灌水乐园】发言


