


echarts-taro3-react 是基于Taro3.x-React框架构建的微信小程序版本echarts组件,可直接下载使用,也可通过npm安装使用。
下载地址:https://github.com/Cecilxx/echarts-taro3-react
快速安装
npm i echarts-taro3-react
使用
引入EChart组件后,拿到EChart组件实例,并调用实例 refresh(option) 方法设置图表数据,option格式参照echarts官网
示例
// 饼图
import { Component } from 'react'
import { View } from '@tarojs/components'
import './index.scss'
import { EChart } from "echarts-taro3-react";
export default class Index extends Component {
componentDidMount() {
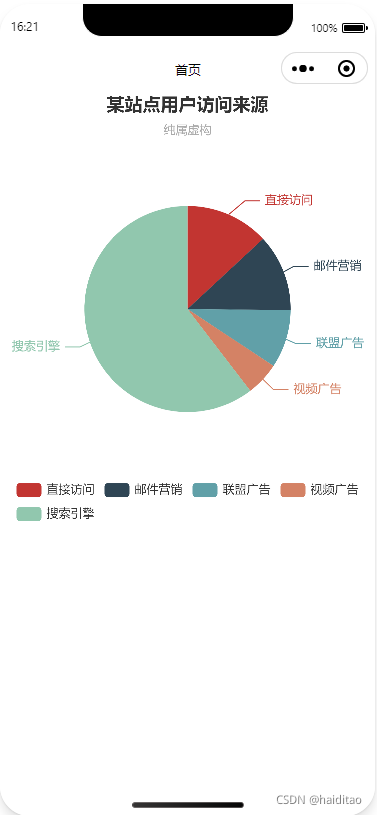
const option = {
title: {
text: "某站点用户访问来源",
subtext: "纯属虚构",
left: "center",
},
tooltip: {
trigger: "item",
formatter: "{a} <br/>{b} : {c} ({d}%)",
},
legend: {
orient: "horizontal",
bottom: "bottom",
data: ["直接访问", "邮件营销", "联盟广告", "视频广告", "搜索引擎"],
},
series: [
{
name: "访问来源",
type: "pie",
radius: "55%",
center: ["50%", "50%"],
data: [
{ value: 335, name: "直接访问" },
{ value: 310, name: "邮件营销" },
{ value: 234, name: "联盟广告" },
{ value: 135, name: "视频广告" },
{ value: 1548, name: "搜索引擎" },
],
emphasis: {
itemStyle: {
shadowBlur: 10,
shadowOffsetX: 0,
shadowColor: "rgba(0, 0, 0, 0.5)",
},
},
},
],
};
this.pieChart.refresh(option);
}
pieChart: any;
refPieChart = (node) => (this.pieChart = node);
render () {
return (
<View className='pie-chart'>
<EChart ref={this.refPieChart} canvasId='pie-chart' />
</View>
)
}
}
显示效果如下:
运行
#开发环境
npm run dev:weapp
#生产环境
npm run build:weapp
报错处理
运行时如报以下错误:
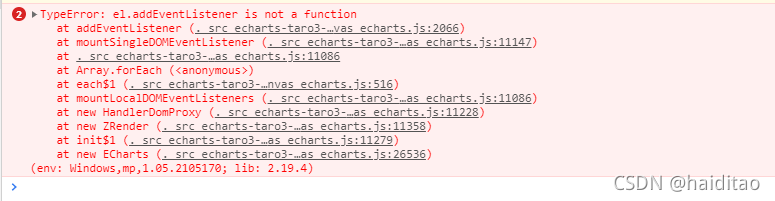
解决方式如下:
-
将 echarts-taro3-react 下载至本地,放置在src目录下
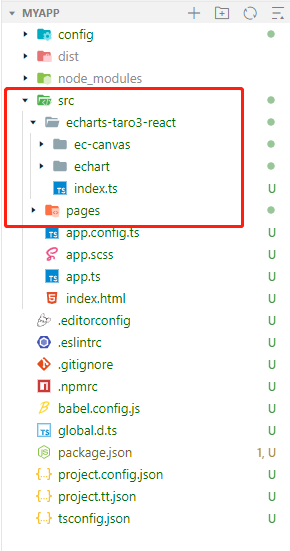
-
打开 echarts-taro3-react/ec-canvas/echarts.js,将2066行代码注释

-
重新启动项目即可
Tips
个人认为比较坑的一点,Echarts在模拟器上可以正常显示,但用真机进行调试的时候不能显示图表,并且报错如下:
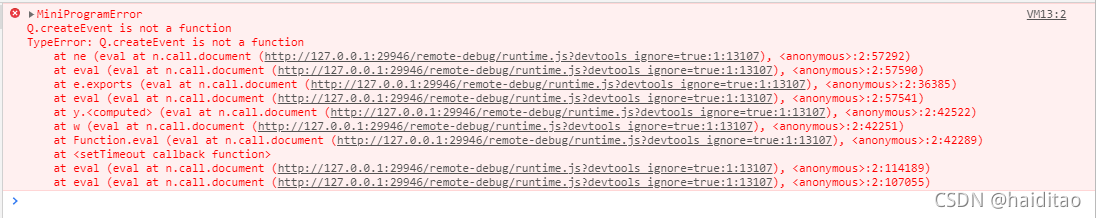
这种情况不需要解决,只需要将代码上传至微信公众平台,使用体验版即可查看


 533
533

 被折叠的 条评论
为什么被折叠?
被折叠的 条评论
为什么被折叠?
 到【灌水乐园】发言


