


指数平滑异同移动平均线MACD
MACD是股票交易中常见的一个技术分析工具,同时也是一个我认为分析可执行度高并且效果优秀的一种手段。其是于1970年代由Gerald Appel提出,它主要是利用了双指数移动平均线,即是求得一条快速的指数移动平均线EMA12和一条慢的指数移动平均线EMA26,再进行相减得到差离值DIF。进而将得到的DIF取9日加权移动平均DEA,最后得到MACD。MACD指标由一组曲线和柱形图构成,它反映的是股票价格变化额趋势周期等特征,通过这些特征便可以很好的挖掘出股票买卖交易的最佳时机。
实现
分析过程可以参考前面的博文,量化交易——传统技术分析相对强弱指数RSI的原理及实现,这里不细讲。
相关代码:
import numpy as np
import math
import random
import json
import matplotlib.pyplot as plt
import sys
sys.setrecursionlimit(10000)

#date|open|high|low|close|volume|adjsuted

def get_stock_hist(num):
    s_his=np.genfromtxt('C:/Users/Haipeng/Desktop/python/Korea/Korea_{:03d}.csv'.format(num), delimiter=',')
    s_hi=s_his[1:][:]
    days=s_hi.shape[0]
    this_stock = []
    for i in range(1,days,1):
        this_day = [i]
        for k in range(1,7):
            this_day.append(s_hi[i][k])
        this_stock.append(this_day)
    print 'Maximum date is ',len(this_stock)
    return this_stock

def get_price(D, p_tpe):
    if p_tpe=='close':
        pos=4;
    elif p_tpe=='open':
        pos=1;
    elif p_tpe=='high':
        pos=2;
    elif p_tpe=='low':
        pos=3;
    else:
        pos=5
    price=stock_hist[D-1][pos];
    return price

def get_ma(D, N):
    p_used=np.zeros(N);
    for i in range(1,N+1,1):
        p_used[i-1]=stock_hist[(D-1)-(i-1)][4];
    ma=np.mean(p_used);
    return ma

def get_mar(fro,to,N):
    ma = []
    for i in range(fro,to+1):
        ma.append(get_ma(i,N))
    return ma
#Date\Open\High\Low\Close
def get_tuples(fro,to):
    res =[]
    for d in range(fro,to+1):
        tmp = []
        tmp.append(d)
        tmp.append(get_price(d,'open'))
        tmp.append(get_price(d,'high'))
        tmp.append(get_price(d,'low'))
        tmp.append(get_price(d,'close'))
        res.append(tmp)
    return res

def get_volume(fro,to):
    res = []
    for d in range(fro,to+1):
        num = 1
        try:
            if get_price(d,'close')<get_price(d-1,'close'):
                num = -1
        except:
            pass
        res.append(num*get_price(d,'volume'))
    return res

# MACD
def get_MACD(D):
    EMA12 = 0
    EMA26 = 0
    DEM = 0
    DIF = 0
    for i in range(1,D):
        if i==1:
            EMA12 = get_price(i+1,'close')*2.0/13+(1-2.0/13)*get_price(i,'close')
            EMA26 = get_price(i+1,'close')*2.0/27+(1-2.0/27)*get_price(i,'close')
            DIF = EMA12 - EMA26
            DEM = DIF*2.0/10
        else:
            EMA12 = get_price(i+1,'close')*2.0/13+(1-2.0/13)*EMA12
            EMA26 = get_price(i+1,'close')*2.0/27+(1-2.0/27)*EMA26
            DIF = EMA12 - EMA26
            DEM = DIF*2.0/10+DEM*(1-2.0/10)

    OSC = DIF-DEM
    return [DIF,DEM,OSC]
def get_DIF_DEM_OSC(fro,to):
    res = [[],[],[]]
    for d in range(fro,to+1):
        tmp = get_MACD(d)
        res[0].append(tmp[0])
        res[1].append(tmp[1])
        res[2].append(tmp[2])
    return res
绘制k线图及MACD指标
画图代码:
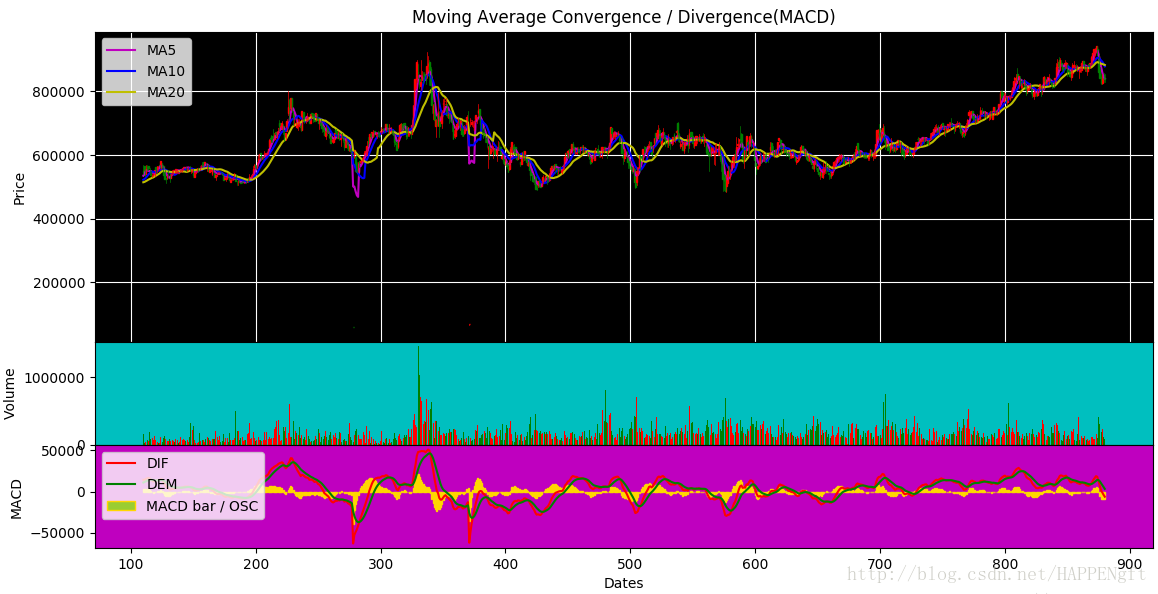
def plot_MACD(fro,to):
    volume = get_volume(fro,to)
    tmp = get_DIF_DEM_OSC(fro,to)
    DIF = tmp[0]
    DEM = tmp[1]
    OSC = tmp[2]
    ma5 = get_mar(fro,to,5)
    ma10 = get_mar(fro,to,10)
    ma20 = get_mar(fro,to,20)
    tuples = get_tuples(fro,to)
    date = [d for d in range(fro,to+1)]

    fig = plt.figure(figsize=(8,5))
    p1 = plt.subplot2grid((5,4),(0,0),rowspan=3,colspan=4,axisbg='k')
    p1.set_title("Moving Average Convergence / Divergence(MACD)")
    p1.set_ylabel("Price")
    p1.plot(date,ma5,'m')
    p1.plot(date,ma10,'b')
    p1.plot(date,ma20,'y')
    p1.legend(('MA5','MA10','MA20'))
    p1.grid(True,color='w')
    candlestick_ohlc(p1, tuples, width=0.7,colorup='r',colordown="g")

    p2 = plt.subplot2grid((5,4),(3,0),colspan=4,axisbg='c')
    p2.set_ylabel("Volume")
    colors = []
    for i in range(len(volume)):
        if volume[i]<0:
            colors.append('green')
            volume[i] = -volume[i]
        else:
            colors.append('red')
    p2.bar(date,volume,color=colors)

    p3 = plt.subplot2grid((5,4),(4,0),colspan=4,axisbg='m')
    p3.set_ylabel("MACD")
    p3.set_xlabel("Dates")
    p3.plot(date,DIF, 'r-')
    p3.plot(date,DEM, 'g-')

    p3.bar(date,OSC,facecolor = 'yellowgreen',edgecolor = 'gold')
    p3.legend(('DIF','DEM','MACD bar / OSC'),loc='upper left')
    plt.subplots_adjust(hspace=0)
    plt.show()# show the plot on the screen

#select stock 18
stock_hist = get_stock_hist(18)
#Date from 110 to 880
plot_MACD(110,880)
图像1:
图像2:
#Date from 400 to 520
plot_MACD(400,520)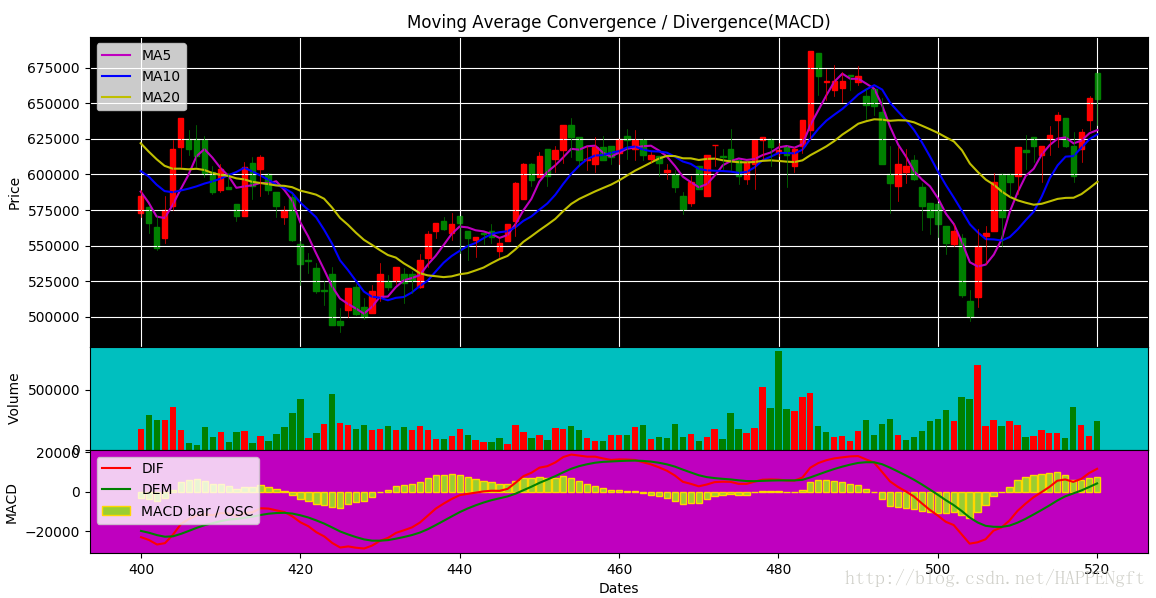
欢迎交流~


 1万+
1万+

 被折叠的 条评论
为什么被折叠?
被折叠的 条评论
为什么被折叠?
 到【灌水乐园】发言


