


我只是想静静的画个图
使用 Matlab 画个普通的函数曲线
转自 http://forum.vibunion.com/thread-70921-1-1.html
Code
新建一个 m 文件
function  new_fig_handle = shift_axis_to_origin( fig_handle )

% 本函数目的是把 matlab 做的图坐标轴移到图形的中间部分去(与数学的做图习惯一致)
% 2008.10.10 in pku
%%%%%%%%%%%%%%%%%%%%%%%%%%%%%%%%%%
figure('Name','shift_axis_to_origin','NumberTitle','off')                         % Create a new figure
% 拷贝图形到一个新的窗口
new_fig_handle = copyobj( fig_handle , gcf );

xL=xlim ;
yL=ylim ;

    xt=get(gca,'xtick') ;
    yt=get(gca,'ytick') ;
    set(gca,'XTick',[],'XColor','w') ;
    set(gca,'YTick',[],'YColor','w') ;

     % 把 x 和 y 坐标轴的两个方向各延长 10% (为了视觉上好看)
    extend_x = ( xL(2)-xL(1) ) * 0.1 ;
    extend_y = ( yL(2)-yL(1) ) * 0.1 ;
    xxL = xL + [ -extend_x extend_x] ;
    yyL = yL + [ -extend_y extend_y] ;
    set(gca,'xlim', xxL) ;
    set(gca,'ylim', yyL) ;

    pos = get(gca,'Position') ;
    box off;

    x_shift = abs( yyL(1)/(yyL(2)-yyL(1)) ) ;
    y_shift = abs( xxL(1)/(xxL(2)-xxL(1)) ) ;

    temp_1 = axes( 'Position', pos + [ 0 , pos(4) * x_shift , 0 , - pos(4)* x_shift*0.99999 ] ) ;
    xlim(xxL) ;
    box off ;
    set(temp_1,'XTick',xt,'Color','None','YTick',[]) ;
    set(temp_1,'YColor','w') ;


    temp_2 = axes( 'Position', pos + [ pos(3) * y_shift , 0 , -pos(3)* y_shift*0.99999 , 0 ] ) ;
    ylim(yyL) ;
    box off ;
    set(temp_2,'YTick',yt,'Color','None','XTick',[]) ;
    set(temp_2,'XColor','w') ;

    Base_pos = get(new_fig_handle,'Position') ;
    arrow_pos_in_x_dircetion = Base_pos(2) - Base_pos(4) * yyL(1)/(yyL(2)-yyL(1)) ;
    arrow_pos_in_y_dircetion = Base_pos(1) - Base_pos(3) * xxL(1)/(xxL(2)-xxL(1)) ;

    annotation('arrow',[Base_pos(1) , Base_pos(1)+Base_pos(3)] , [arrow_pos_in_x_dircetion , arrow_pos_in_x_dircetion ] , 'Color','k');
    annotation('arrow',[arrow_pos_in_y_dircetion , arrow_pos_in_y_dircetion ] , [Base_pos(2) , Base_pos(2)+Base_pos(4)] , 'Color','k');


%%%%%%%%%%%%%%%%%%%%%%%%%%%%%%%%%%
再新建一个写函数
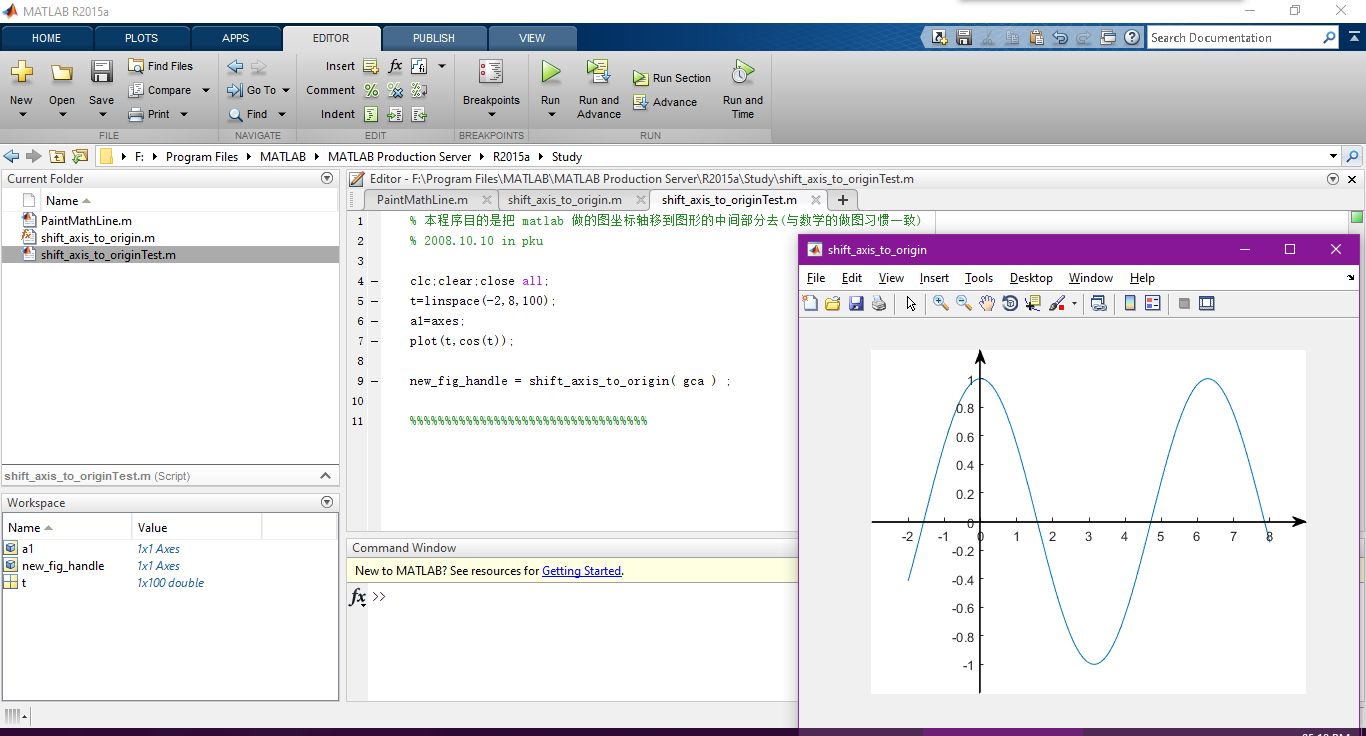
% 本程序目的是把 matlab 做的图坐标轴移到图形的中间部分去(与数学的做图习惯一致)
% 2008.10.10 in pku

clc;clear;close all;
t=linspace(-2,8,100);
a1=axes;
plot(t,cos(t));

new_fig_handle = shift_axis_to_origin( gca ) ;

%%%%%%%%%%%%%%%%%%%%%%%%%%%%%%%%%%


 1954
1954

 被折叠的 条评论
为什么被折叠?
被折叠的 条评论
为什么被折叠?
 到【灌水乐园】发言


