


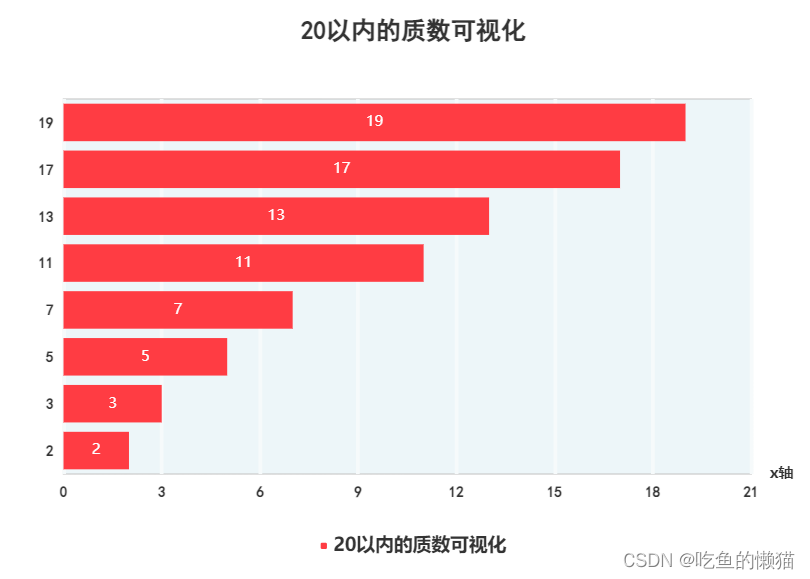
 这篇博客展示了如何使用JavaScript实现20以内的质数检测,并利用ECharts库将这些质数进行条形图可视化展示。代码中定义了一个`isPrime`函数用于找出质数,并使用ECharts在页面上创建了一个图表来呈现结果。
<body>
<div id="main" style="width: 700px;height: 500px"></div>


<script>
    const array = [];


    function isPrime() {
        let count = 0;
        for (let i = 1; i < 20; i++) {
            for (let j = 1; j <= i; j++) {
                if (i % j === 0) {
                    count++;
                }
                if (j === i && count === 2) {
                    array.push(i)
                    // document.write(i + "  ");
                }
            }

            count = 0;
        }

        // document.write(array)
    }
    isPrime()
    var ECharts = echarts.init(document.getElementById('main'))

            var option = {
                color:'#ff3c43',
                title: {
                    left: 'center',
                    top: '10',
                    text: '20以内的质数可视化',
                    textStyle: {
                        fontSize: 20,
                        fontFamily: '黑体',
                        fontWeight: 'bolder',
                        lineHeight: 20 // 设置行高
                    },

                },
                grid: {
                    width: 550, // grid 组件的宽度
                    height: 300, // grid 组件的高度
                    top: 80,
                    show: true,
                    backgroundColor: '#edf6f9',

                },
                legend: { //
                    orient: 'vertical',
                    data:['20以内的质数可视化'],
                    bottom: 50,
                    center:0,
                    itemWidth: 5,
                    itemHeight: 5,
                    textStyle: {
                        fontSize: 15,
                        fontWeight: 'bold'
                    }

                },
                xAxis: [ // x轴数值
                    {
                        name: 'x轴',
                        nameTextStyle: {
                            fontWeight: 'bold'
                        },
                        type: 'value',
                        splitLine: { // y轴的分割线
                            show: true,
                            lineStyle: {
                                color: '#f6fafb', // 改为案例给出的白色
                                width: 3 // 增加宽度,使他看起来被分隔
                            },
                        },
                        axisLine: {show: false}, // 不显示轴线
                        axisTick: {show: false}, // 不显示轴刻度线
                        axisLabel: { // 修改轴数据标签样式
                            fontFamily: '黑体',
                            fontWeight: 'bold'
                        }
                    }
                ],
                yAxis: [ //y轴类目轴
                    {
                        type: 'category',
                        data: array,
                        axisLine: {show: false}, // 不显示轴线
                        axisTick: {show: false}, // 不显示轴刻度线
                        axisLabel: { // 修改轴数据标签样式
                            fontFamily: '黑体',
                            fontWeight: 'bold'
                        }
                    }
                ],
                tooltip: {
                    trigger: 'axis',
                    axisPointer: { //坐标轴指示器,坐标轴触发有效
                        type: 'shadow' //默认为直线。可选为: 'line' 'shadow'
                    }
                },
                series: {

                    name: ['20以内的质数可视化'],
                    type: 'bar',
                    data: array,
                    label: {
                        show: true,
                        position: 'inside'
                    }
                }
            };
            ECharts.setOption(option)

</script>

</body>


 2484
2484

 被折叠的 条评论
为什么被折叠?
被折叠的 条评论
为什么被折叠?
 到【灌水乐园】发言


