


 本文介绍了UML类图和Graphviz。UML类图用于表示类的构成及类间关系,是面向对象设计常用方法。Graphviz是开源图形可视化软件,可通过文本语言描述图并生成图片。还介绍了Graphviz的安装、测试,以及UML类图中实现、泛化等多种关系的表示和代码实现。

《早秋》杨小羊
才感秋意凉,
又觉夏气返。
夏秋两交织,
亦如思绪缠。
晚霞追落日,
彩云寻新月,
日月两交替,
也似归心样。
来时观荷碧,
归家闻桂香。
夏秋已交替,
岁月蹉跎惘。
夜深不得寐,
薄帐披月光。
虫鸣伴我思,
徘徊入梦乡。
文章目录
1、简介
UML(unified modeling language,统一建模语言)是一种常用的面向对象设计的方法。其中最常用的是类图(class diagram),用于表示类的构成以及类之间的关系。
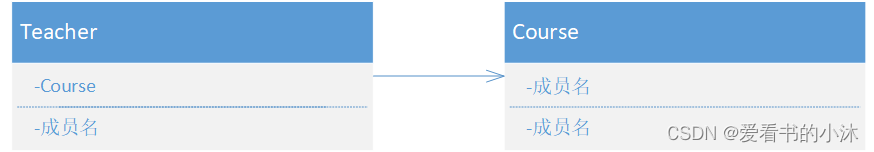
1.1 类图
在系统的逻辑视图中,类图用于描述系统中的类(对象)本身的组成和类(对象)之间的各种静态关系。
UML 类图(class diagram)是最常见的图,用于表示系统的静态结构。
每个类成员的可见性以一个前置符号表示:
+ 公有(public)
- 私有(private)
# 保护(protected)
~ 包(package)
通常UML图分为三类:
- 用例图(use case)
- 静态结构图:类图、对象图、包图、组件图、部署图
- 动态行为图:交互图(时序图与协作图)、状态图、活动图
1.2 Graphviz
Graphviz 是 AT&T 实验室开发的一个开源软件,它以一种文本语言去描述图(graph),然后自动排布节点和边去生成图片。它已有近 30 年历史。
Graphviz 是开源的图形可视化软件。图可视化是一种将结构信息表示为抽象图和网络图的方法。它在网络、生物信息学、软件工程、数据库和网页设计、机器学习以及其他技术领域的可视化界面中具有重要的应用。
2、Graphviz
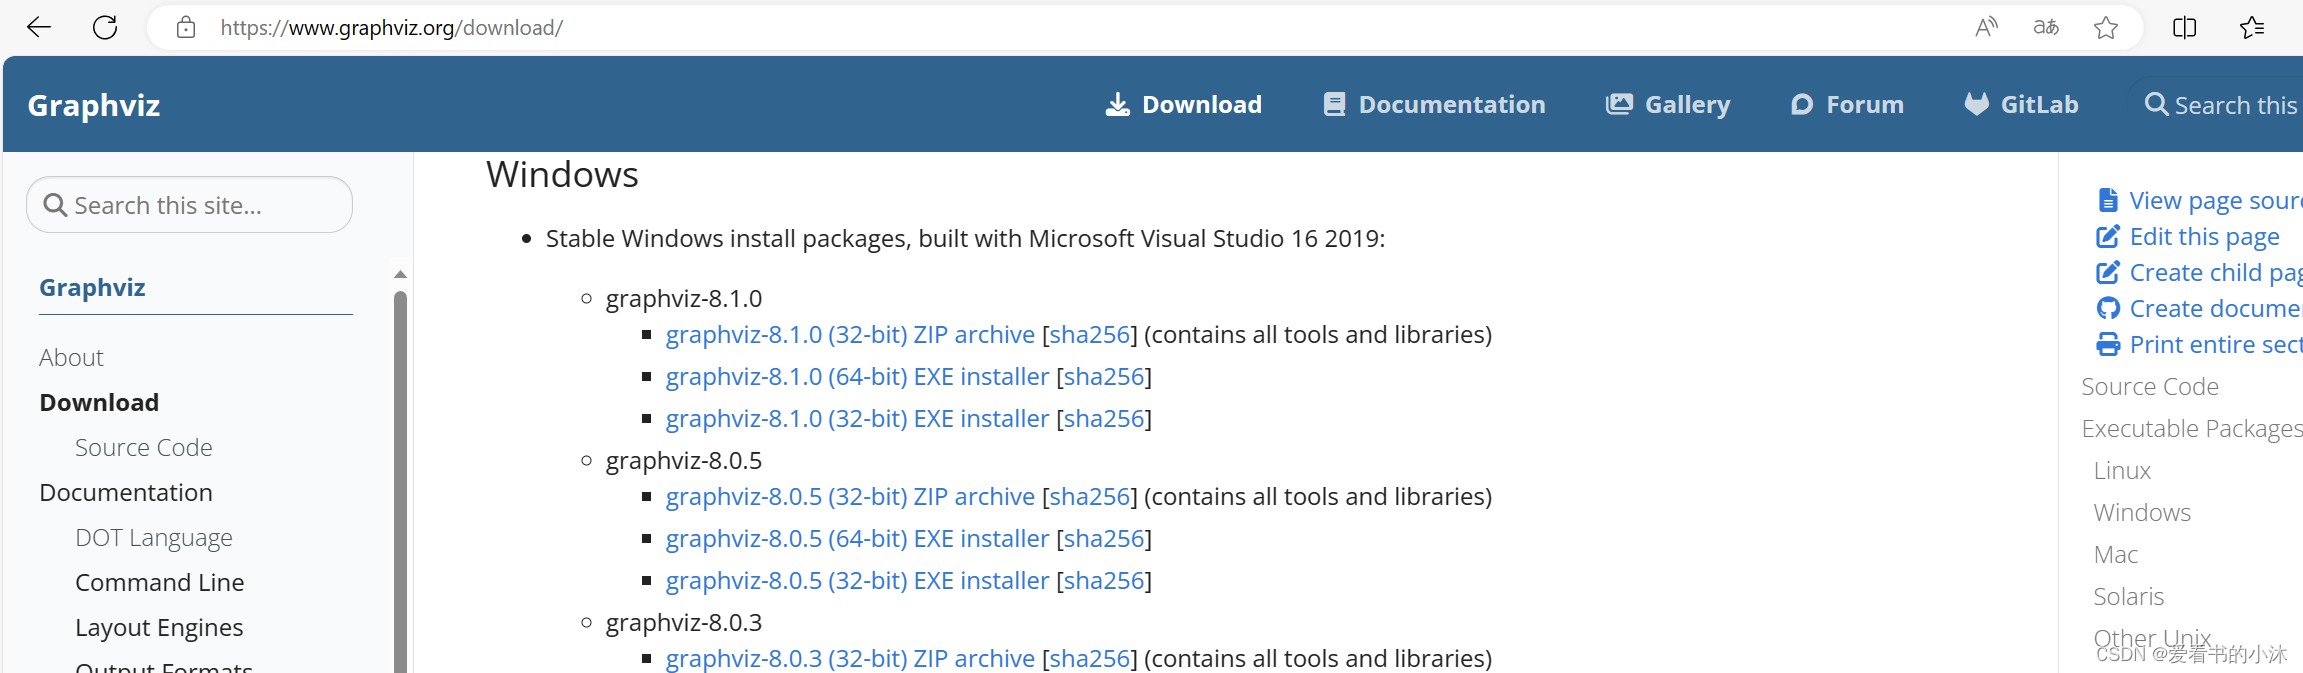
2.1 安装
下载 Graphviz 安装包。
下载地址:https://www.graphviz.org/download/
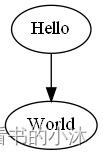
2.2 命令行测试
建立一个测试源文件 hello.dot(DOT语言为 Graphviz 的图形描述语言):
digraph {
    Hello -> World
}
在命令行执行:
dot -Tpng hello.dot -o hello.png
生成结果文件:
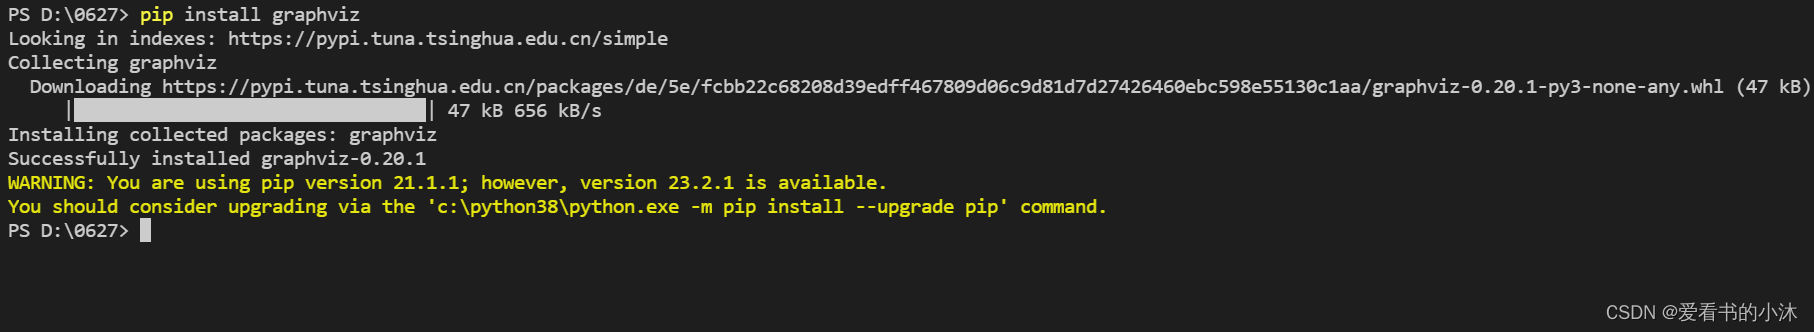
2.3 python测试
安装相关库:
pip install graphviz
该graphviz模块提供了两个类:Graph和 Digraph。它们分别以DOT语言为无向图和有向图创建图描述。它们具有相同的 API。通过实例化一个new Graph或 Digraphobject 创建一个图形:
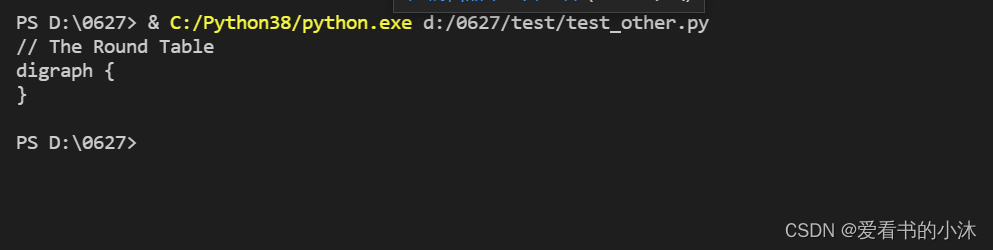
from graphviz import Digraph

dot = Digraph(comment='The Round Table')

print(dot)
然后可以添加点和边,通过node()和edge()或edges()来实现。
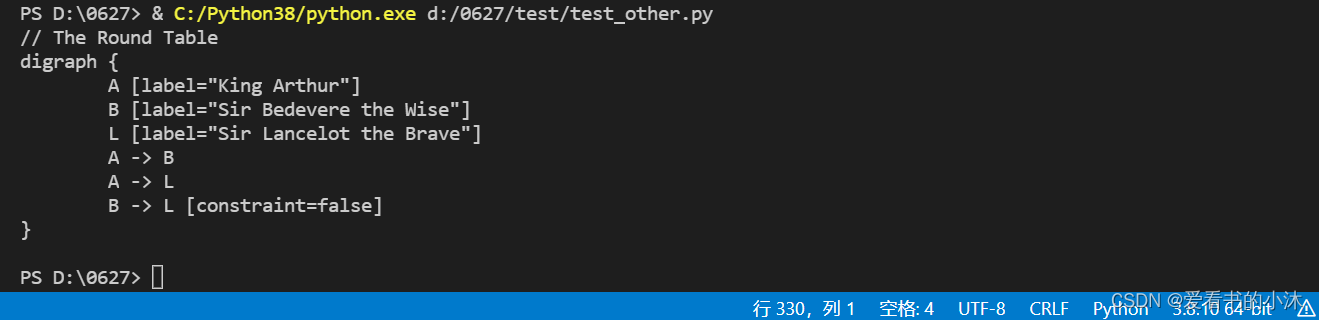
from graphviz import Digraph

dot = Digraph(comment='The Round Table')
dot.node('A', 'King Arthur')
dot.node('B', 'Sir Bedevere the Wise')
dot.node('L', 'Sir Lancelot the Brave')

dot.edges(['AB', 'AL'])
dot.edge('B', 'L', constraint='false')
print(dot.source)
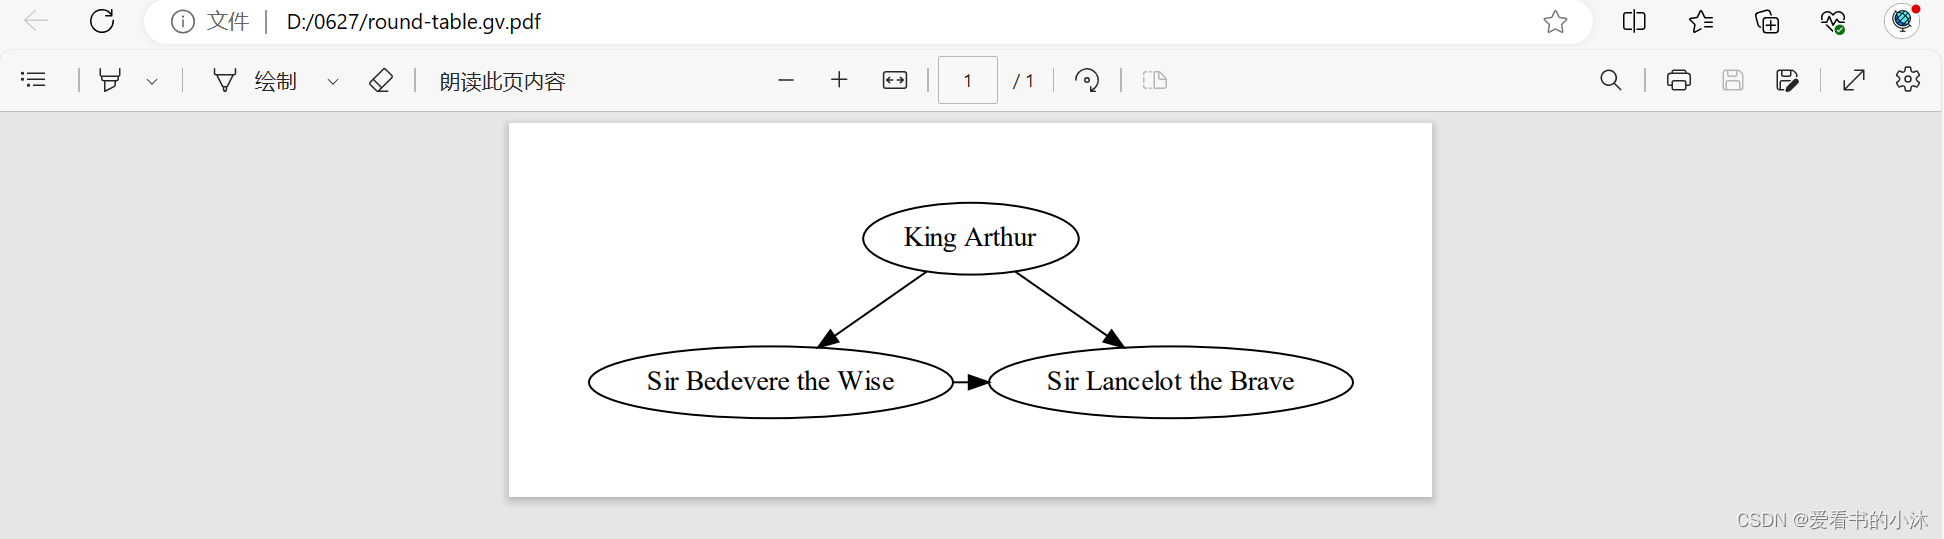
最后可以通过如下代码保存图像pdf文件,并显示。通过设置view=True将自动使用系统默认的文件类型的查看器应用程序打开生成的文件(PDF,PNG,SVG等)。
dot.render('round-table.gv',format='jpg', view=True)
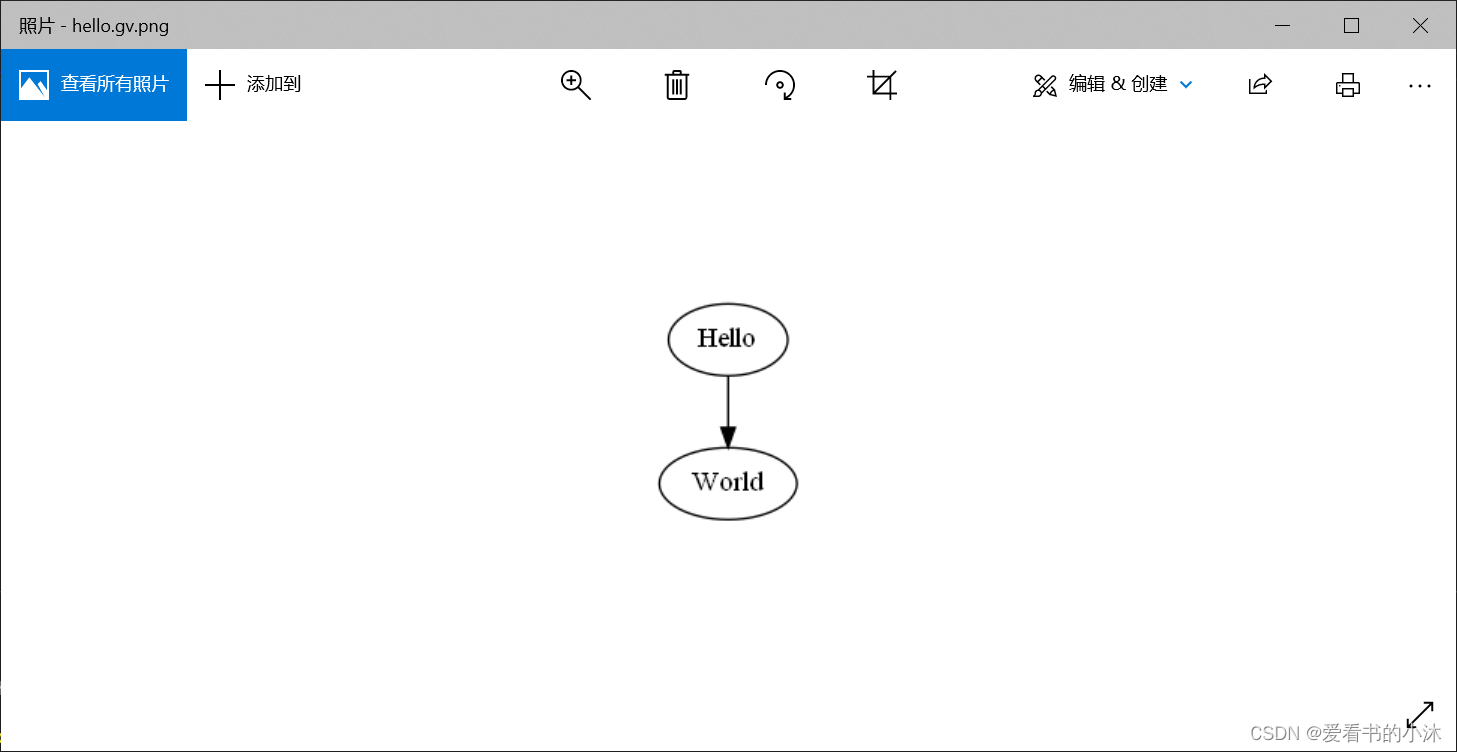
from graphviz import Digraph

g = Digraph('G', filename='hello.gv',format='png')
g.edge('Hello', 'World')
g.view()
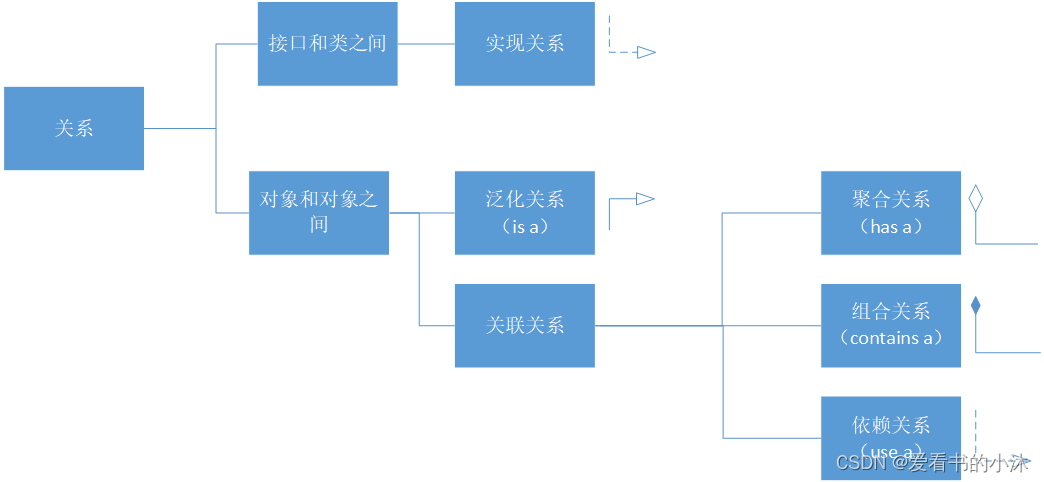
3、关系
3.1 实现
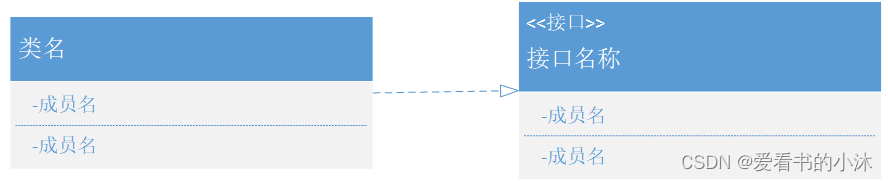
实现关系是指接口及其实现类之间的关系。
在UML类图中,实现关系用空心三角和虚线组成的箭头来表示,从实现类指向接口。在Java代码中,用implements关键字表示。
- graphviz代码:
digraph {
    node [shape=box, fontname="Inconsolata, Consolas", fontsize=10, penwidth=0.5]
    edge [fontname="Inconsolata, Consolas", fontsize=10, penwidth=0.5]

    Bird, Fly

    /* Dependency */
    {
        edge [arrowhead=onormal, style=dashed]
        Bird -> Fly
    }
}
- graphviz生成图:
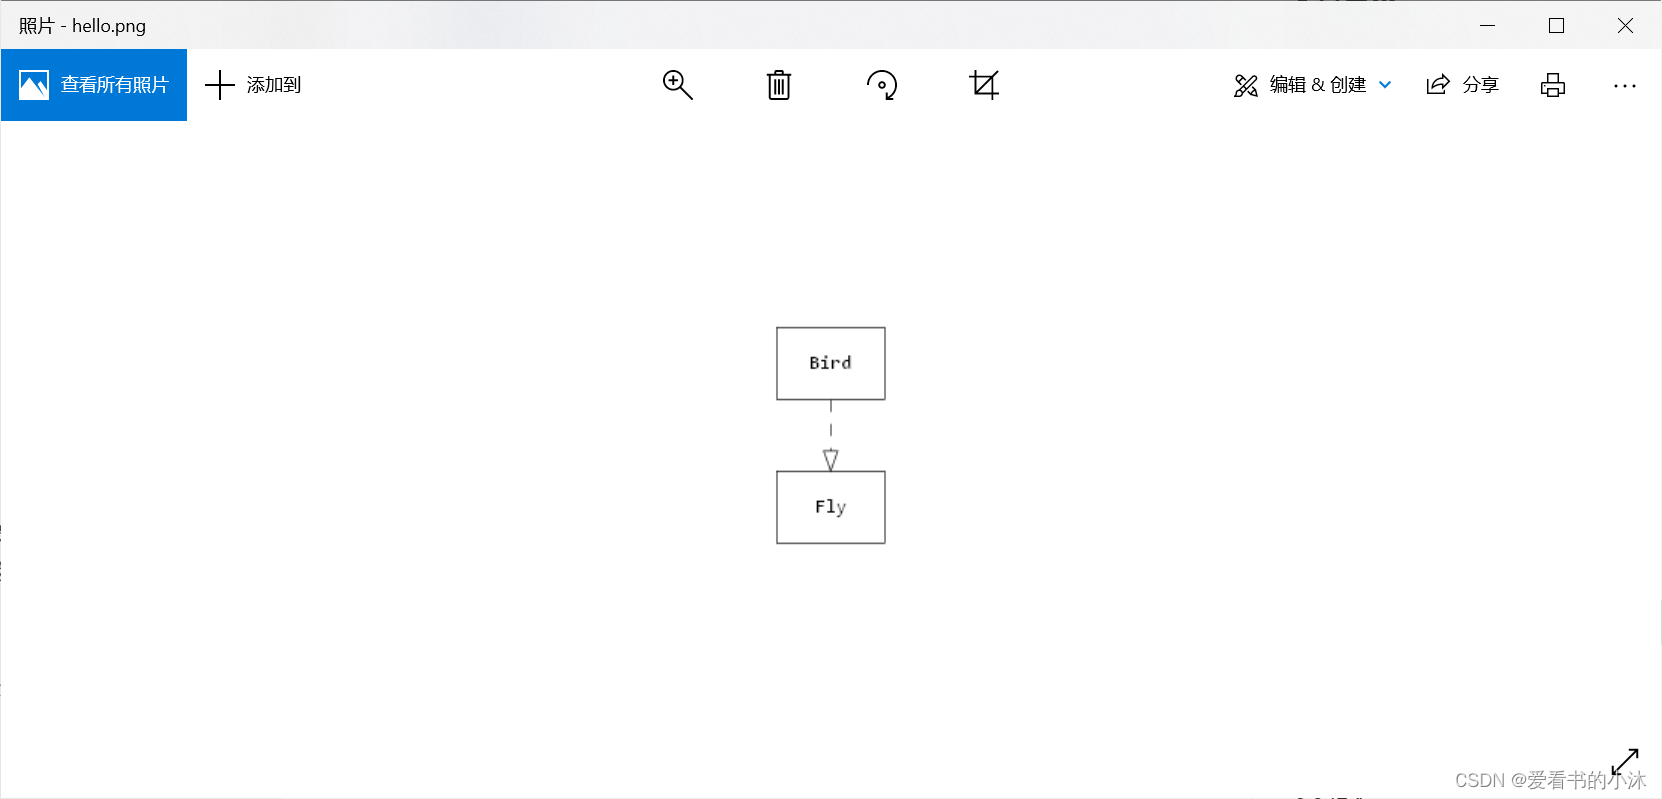
- python代码:
from graphviz import Digraph

dot = Digraph(comment='The Implements Graph of YXY')
dot.node('A', 'Bird', shape='box')
dot.node('B', 'Fly', shape='box')

dot.edge('A', 'B', arrowhead='onormal', style='dashed')
print(dot.source)
dot.view()
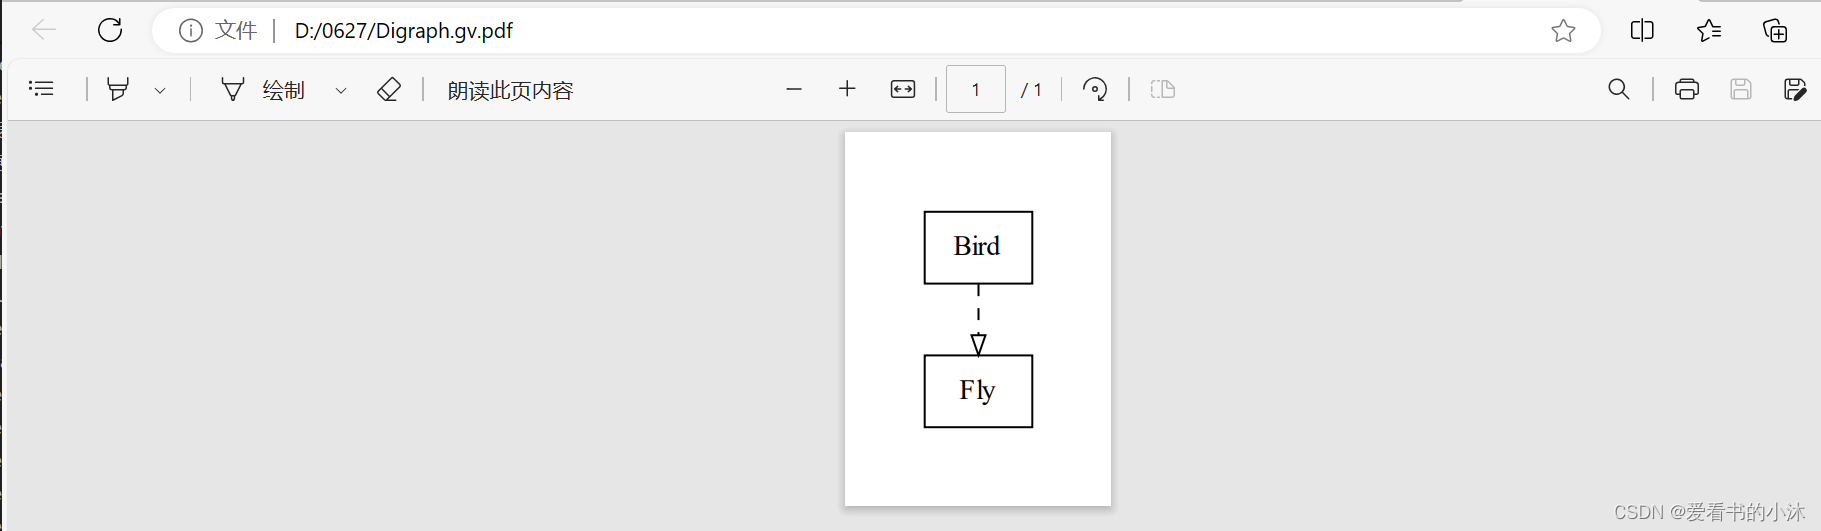
- python生成图:
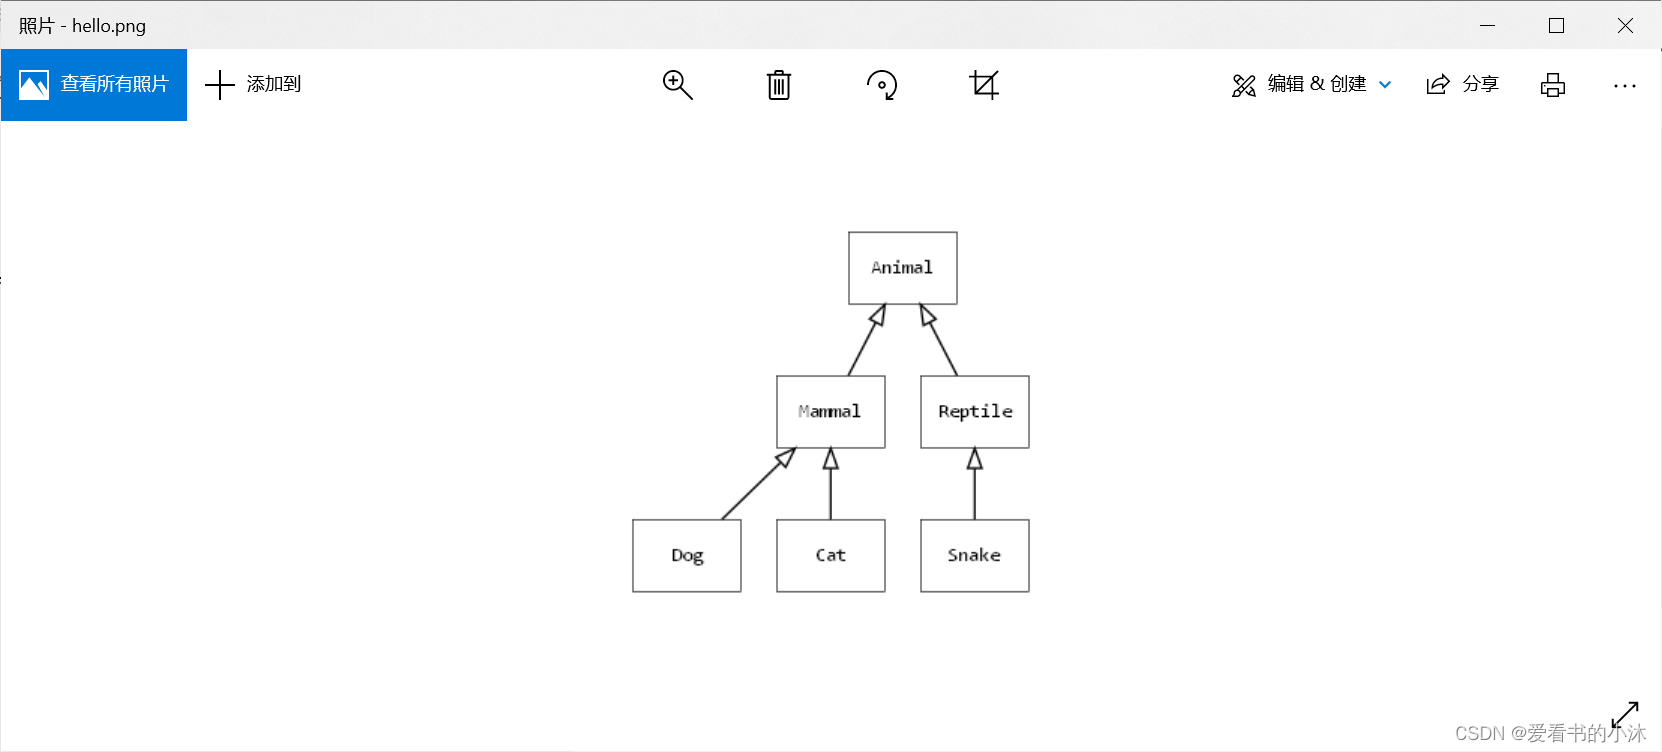
3.2 泛化
泛化关系(Generalization)是指对象与对象之间的继承关系。如果对象A和对象B之间的“is a”关系成立,那么二者之间就存在继承关系,对象B是父对象,对象A是子对象。
在UML类图中,泛化关系用空心三角和实线组成的箭头表示,从子类指向父类。在Java代码中,用关键字 extends表示。
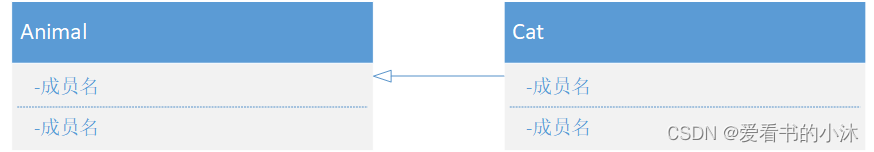
继承(inheritance)是类之间很重要的关系,在 UML 中又称其为泛化(generalization)关系,以空心箭头表示派生类指向基类。
- graphviz代码:
digraph {
    node [shape=box, fontname="Inconsolata, Consolas", fontsize=10, penwidth=0.5]

    Animal, Mammal, Reptile, Dog, Cat, Snake

    /* inheritance */
    {
        edge [arrowtail=onormal, dir=back]

        Animal -> { Mammal, Reptile }
        Mammal -> { Dog, Cat}
        Reptile -> Snake
    }
}
- graphviz生成图:
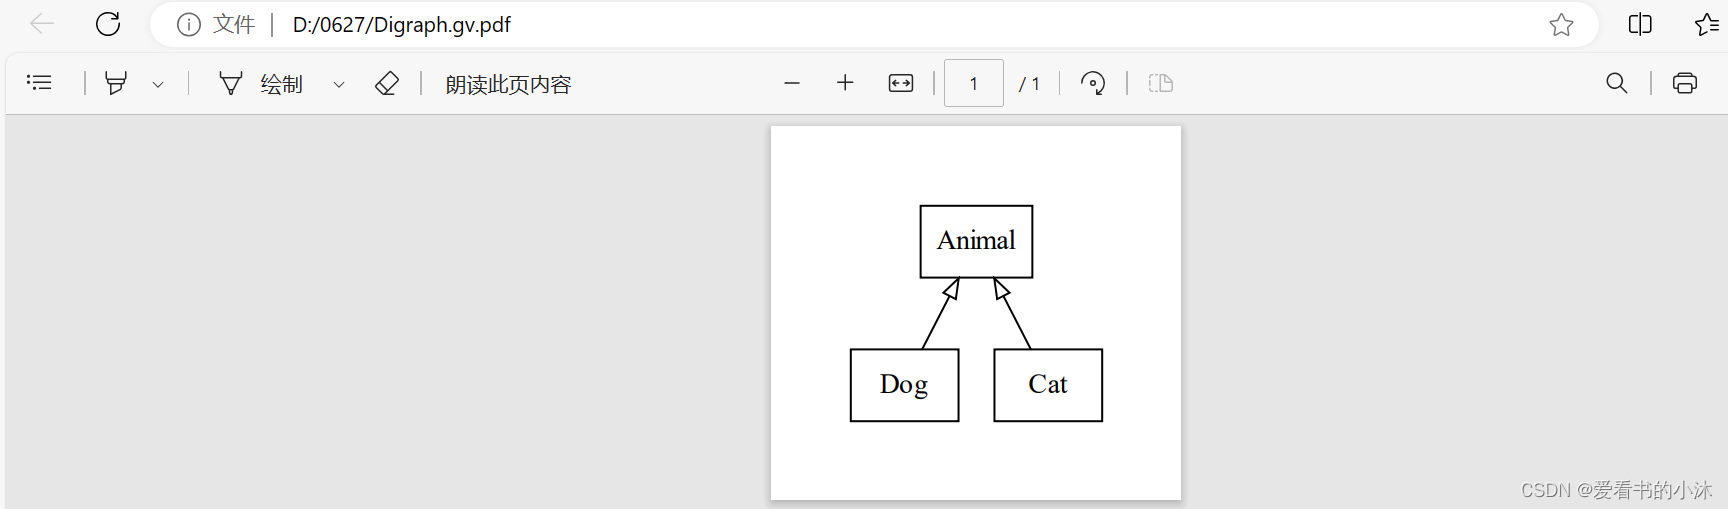
- python代码:
from graphviz import Digraph

dot = Digraph(comment='The Generalization Graph of YXY')
dot.node('A', 'Animal', shape='box')
dot.node('B', 'Dog', shape='box')
dot.node('C', 'Cat', shape='box')

dot.edge('A', 'B', arrowtail='onormal', style='solid', dir='back')
dot.edge('A', 'C', arrowtail='onormal', style='solid', dir='back')
print(dot.source)
dot.view()
- python生成图:
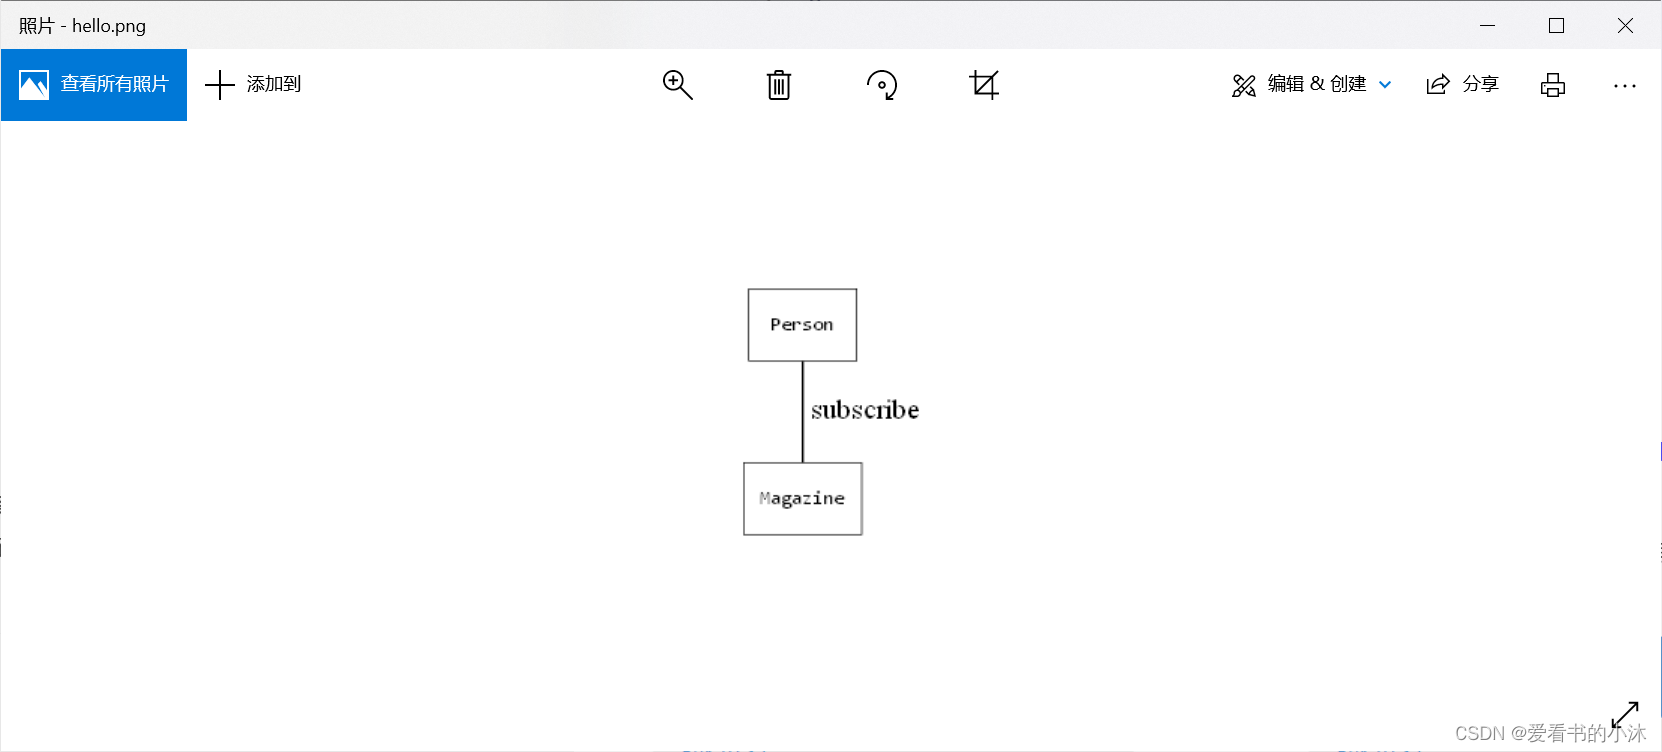
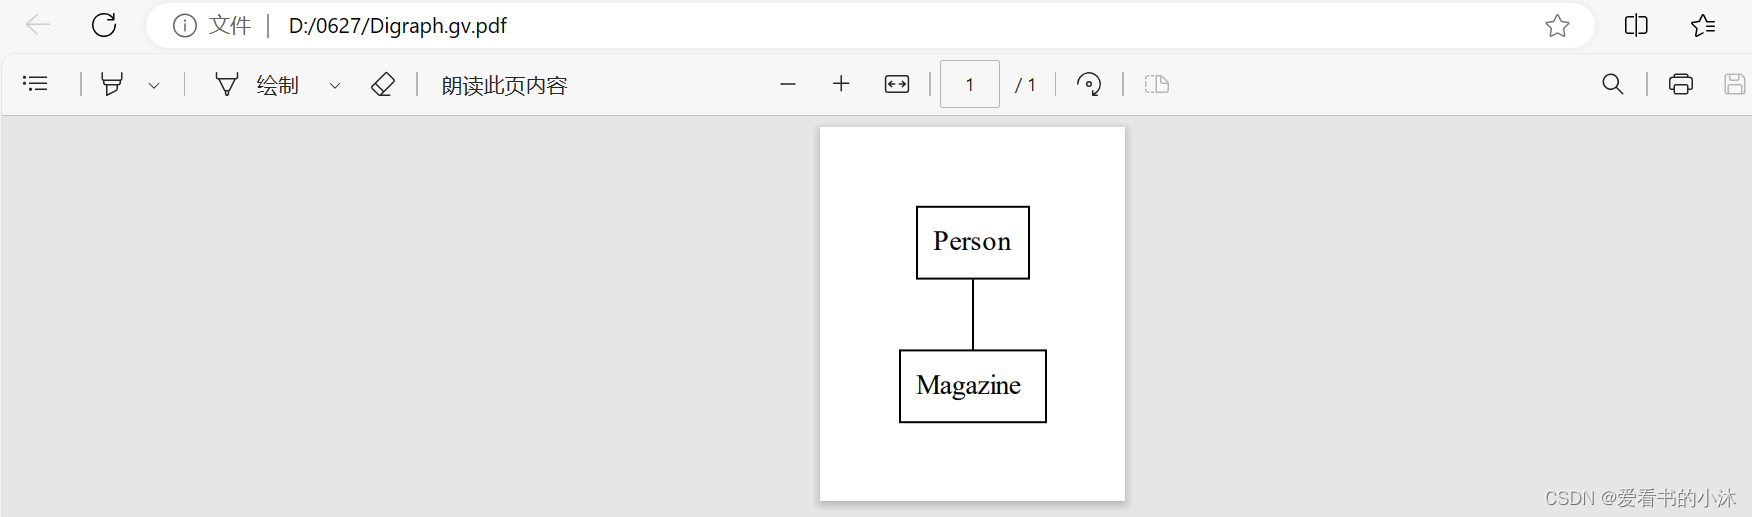
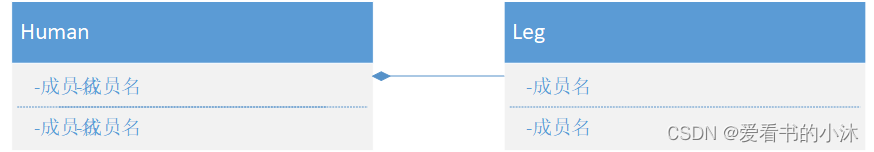
3.3 关联
关联关系(Association)是指对象和对象之间的连接,它使一个对象知道另一个对象的属性和方法。关联关系有单向关联和双向关联。关联关系又分为依赖关联、聚合关联和组合关联三种类型。
在UML图中,双向关联关系用带双箭头的实线或者无箭头的实线双线表示。单向关联用一个带箭头的实线表示,箭头指向被关联的对象。在Java中,关联关系的代码表现形式为一个对象含有另一个对象的引用。
- graphviz代码:
digraph {
    node [shape=box, fontname="Inconsolata, Consolas", fontsize=10, penwidth=0.5]

    Person, Magazine

    /* Association */
    {
        edge [dir=none]
        Person -> Magazine [label=" subscribe"]
    }
}
- graphviz生成图:
- python代码:
from graphviz import Digraph

dot = Digraph(comment='The Association Graph of YXY')
dot.node('A', 'Person', shape='box')
dot.node('B', 'Magazine ', shape='box')

dot.edge('A', 'B', arrowhead='none', arrowtail='none')
print(dot.source)
dot.view()
- python生成图:
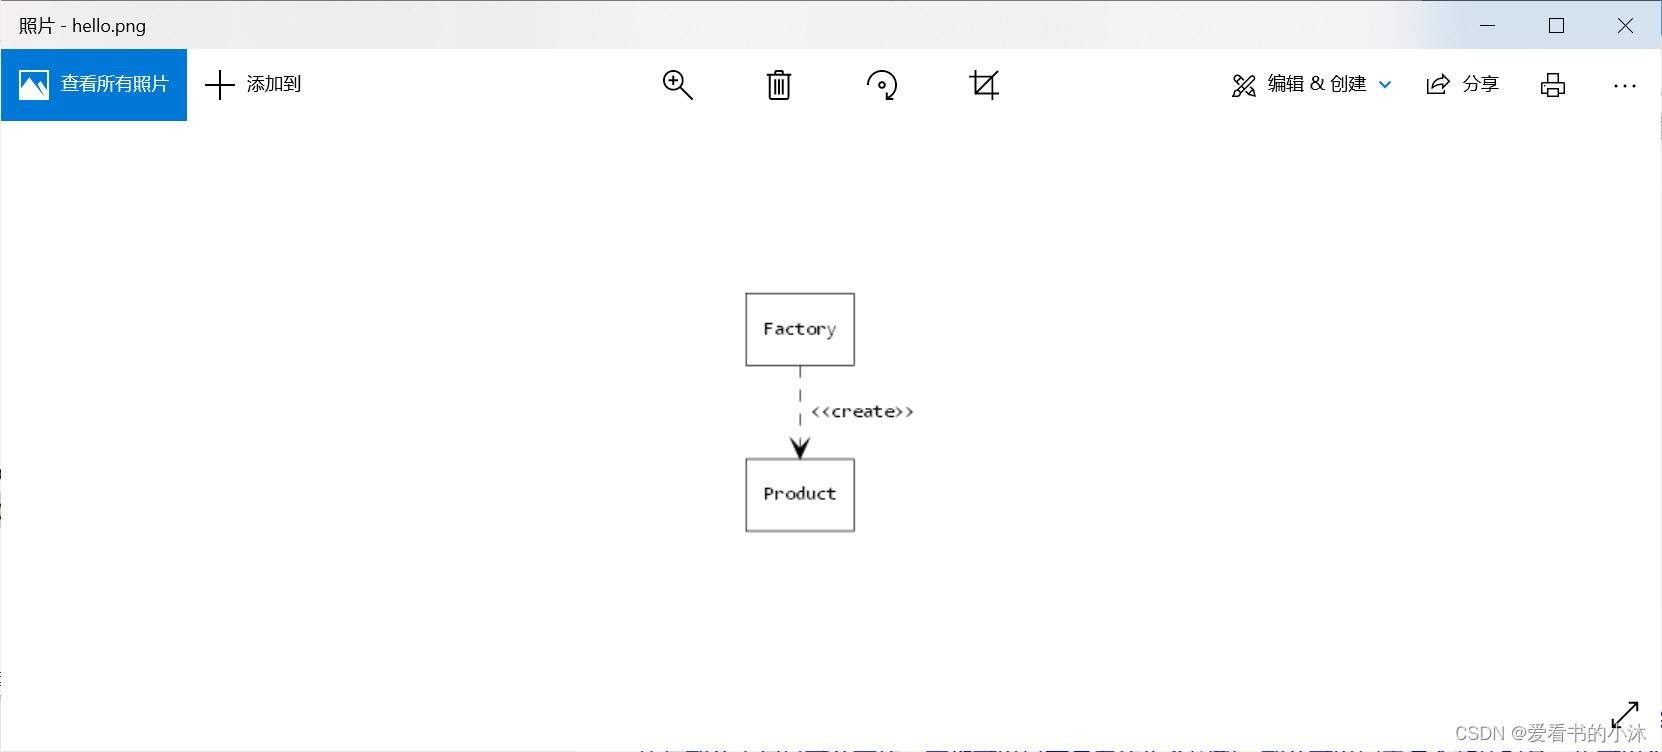
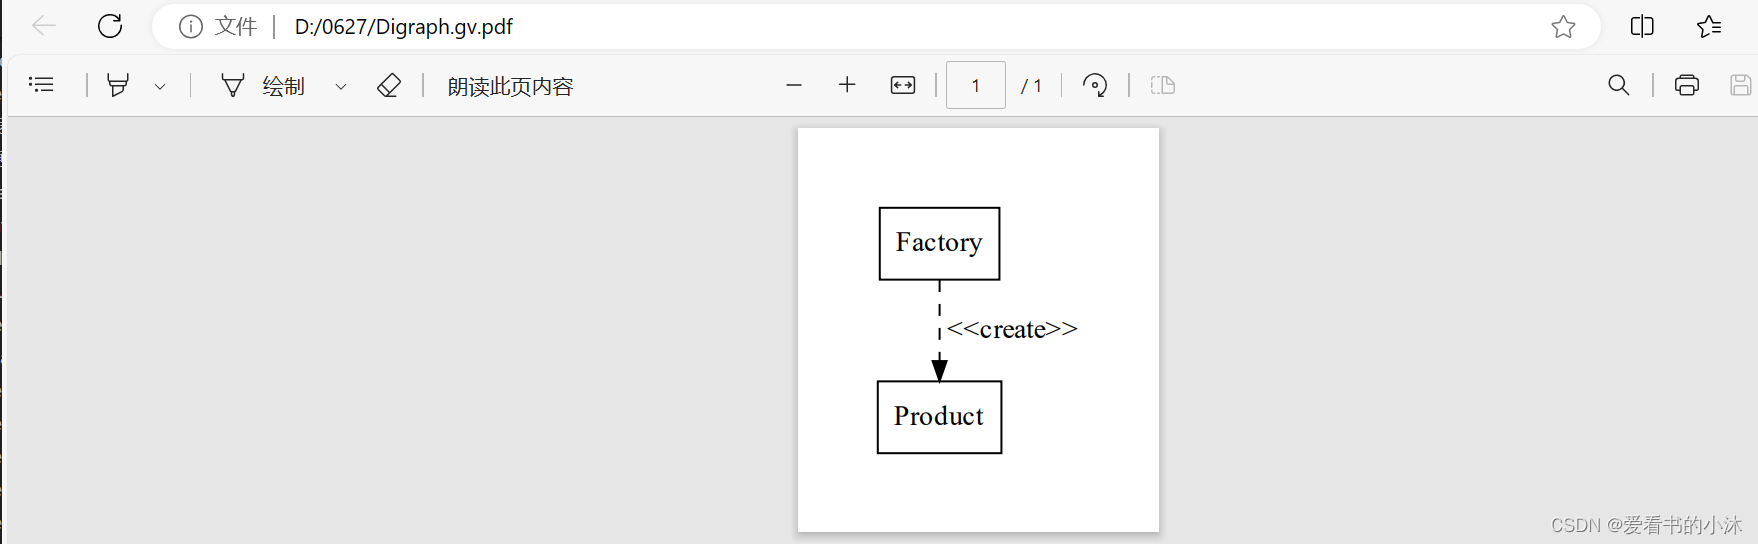
3.4 依赖
依赖(Dependency)关系是一种弱关联关系。如果对象A用到对象B,但是和B的关系不是太明显的时候,就可以把这种关系看作是依赖关系。如果对象A依赖于对象B,则 A “use a” B。
在UML类图中,依赖关系用一个带虚线的箭头表示,由使用方指向被使用方,表示使用方对象持有被使用方对象的引用。

- graphviz代码:
digraph {
    node [shape=box, fontname="Inconsolata, Consolas", fontsize=10, penwidth=0.5]
    edge [fontname="Inconsolata, Consolas", fontsize=10, penwidth=0.5]

    Factory, Product

    /* Dependency */
    {
        edge [arrowhead=vee, style=dashed]
        Factory -> Product [label=" <<create>>"]
    }
}
- graphviz生成图:
- python代码:
from graphviz import Digraph

dot = Digraph(comment='The Dependency Graph of YXY')
dot.node('A', 'Factory', shape='box')
dot.node('B', 'Product', shape='box')

dot.edge('A', 'B', style='dashed', label=" <<create>>")
print(dot.source)
dot.view()
- python生成图:
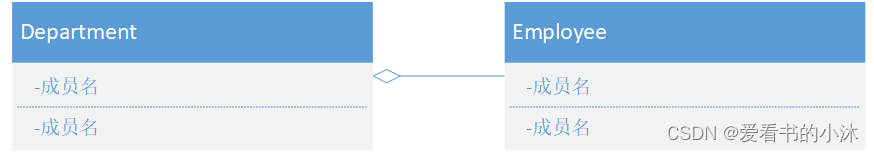
3.5 聚合
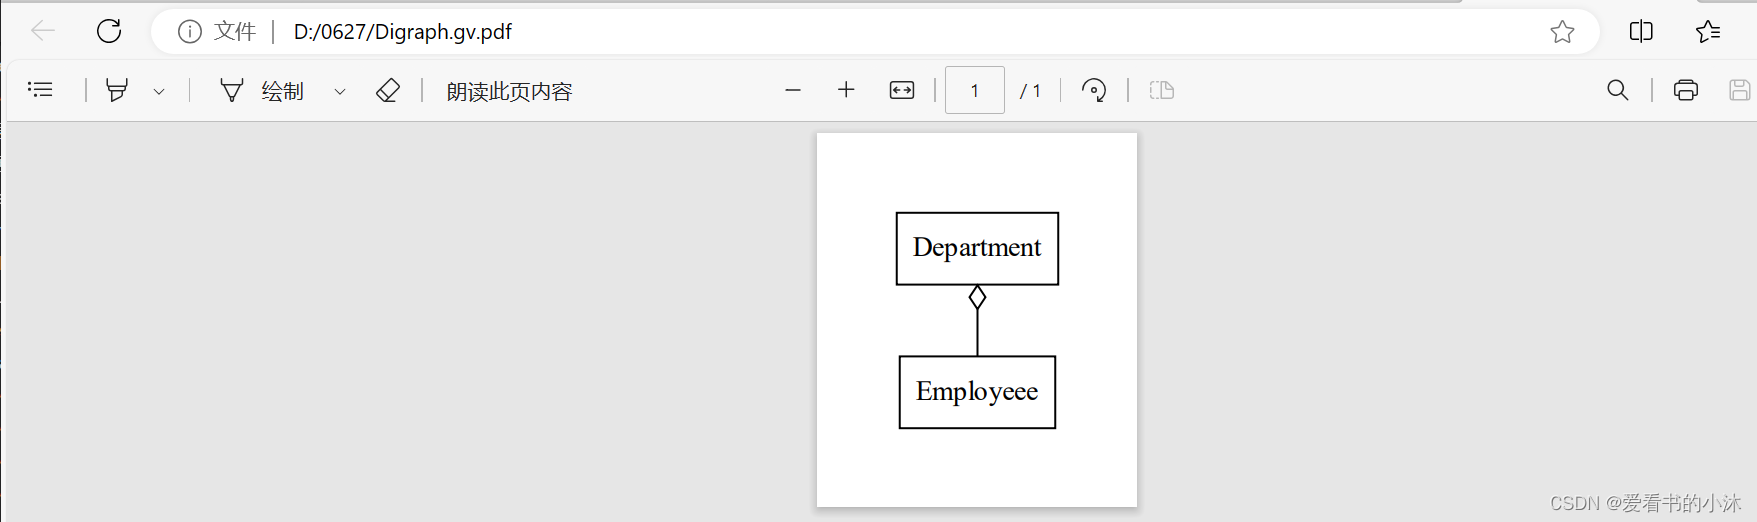
聚合(Aggregation)是关联关系的一种特例,它体现的是整体与部分的拥有关系,即 “has a” 的关系。此时整体与部分之间是可分离的,它们可以具有各自的生命周期,部分可以属于多个整体对象,也可以为多个整体对象共享,所以聚合关系也常称为共享关系。
在UML图中,聚合关系用空心菱形加实线箭头表示,空心菱形在整体一方,箭头指向部分一方。其中箭头可以省略。
- graphviz代码:
digraph {
    node [shape=box, fontname="Inconsolata, Consolas", fontsize=10, penwidth=0.5]
    edge [fontname="Inconsolata, Consolas", fontsize=10, penwidth=0.5]

    Department, Employeee

    /* Aggregation */
    {
        edge [dir=back, arrowtail=odiamond, headlabel="* "]
        Department -> Employeee
    }
}
- graphviz生成图:

- python代码:
from graphviz import Digraph

dot = Digraph(comment='The Aggregation Graph of YXY')
dot.node('A', 'Department', shape='box')
dot.node('B', 'Employeee', shape='box')

dot.edge('A', 'B', arrowtail='odiamond', dir='back')
print(dot.source)
dot.view()
- python生成图:
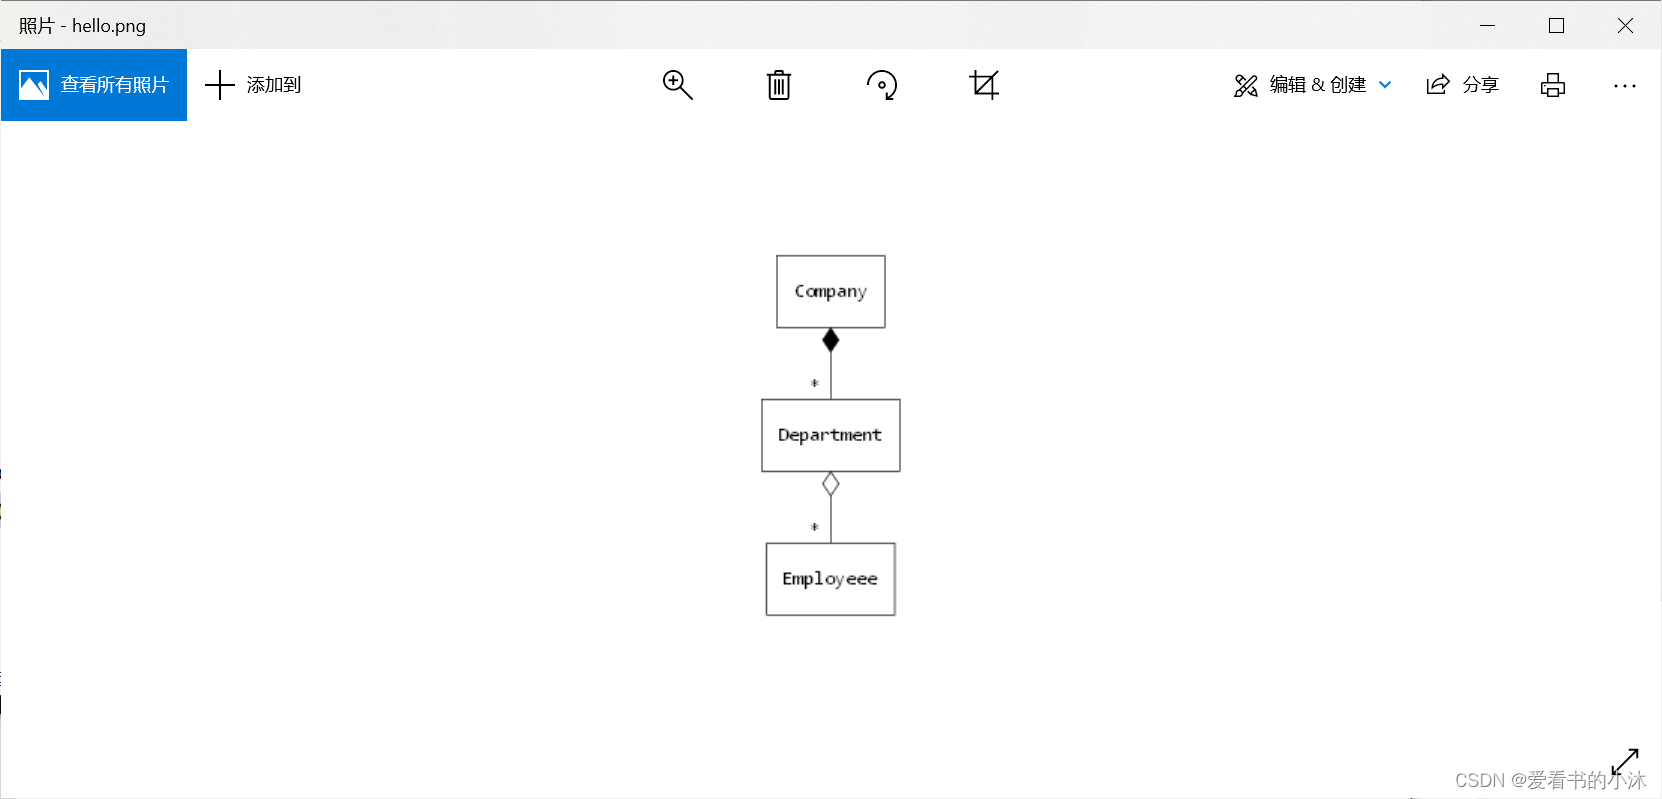
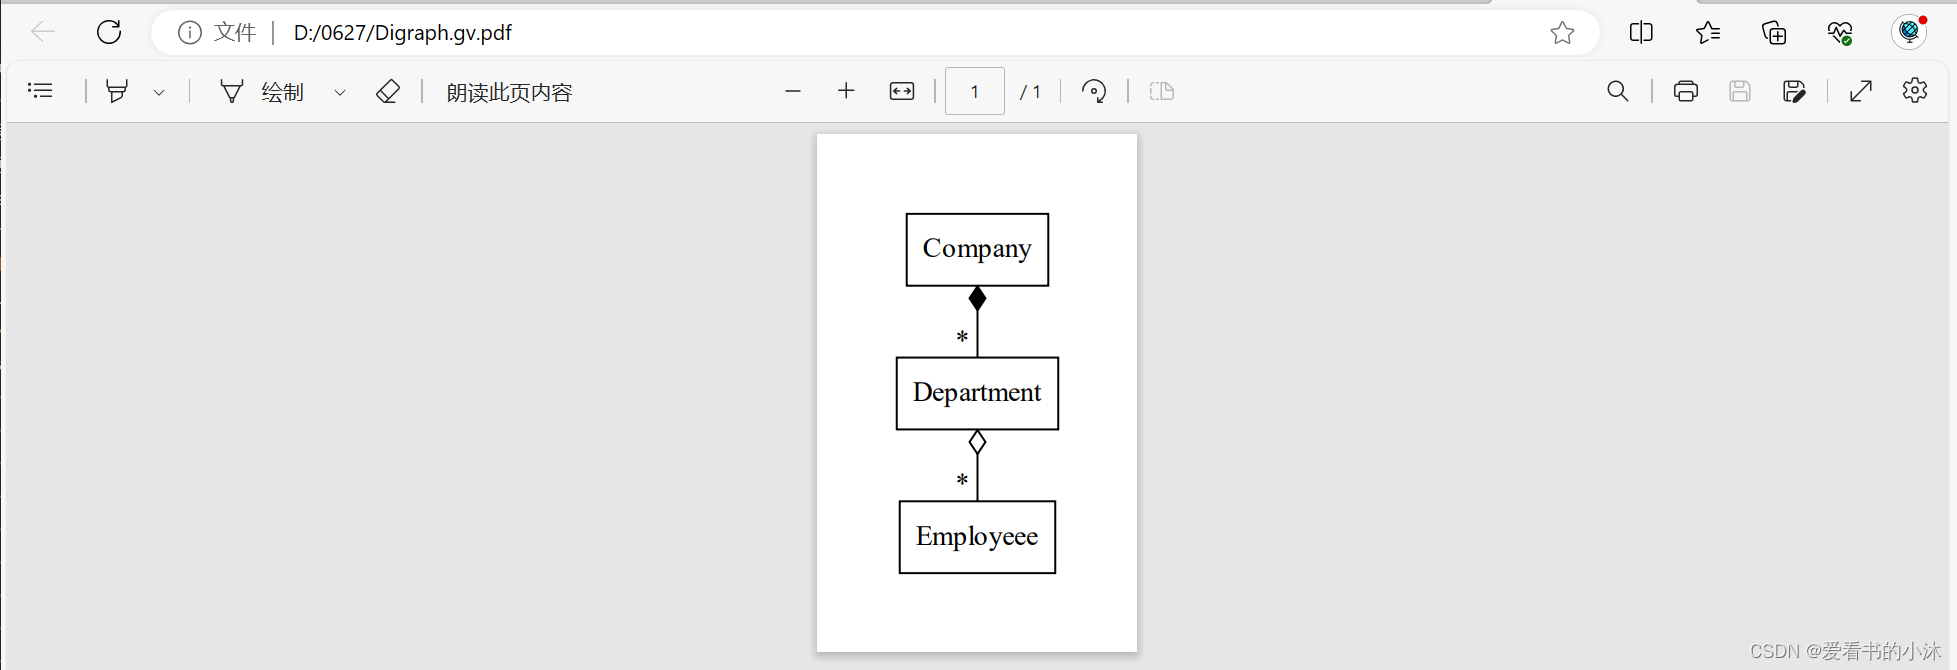
3.6 组合
组合(Composition)也是关联关系的一种特例,它同样体现整体与部分间的包含关系,即 “contains a” 的关系。但此时整体与部分是不可分的,部分也不能给其它整体共享,作为整体的对象负责部分的对象的生命周期。
在UML图中,组合关系用实心菱形加实线箭头表示,实心菱形在整体一方,箭头指向部分一方。其中箭头可以省略。
- graphviz代码:
digraph {
    node [shape=box, fontname="Inconsolata, Consolas", fontsize=10, penwidth=0.5]
    edge [fontname="Inconsolata, Consolas", fontsize=10, penwidth=0.5]

    Company, Department, Employeee

    /* Composition */
    {
        edge [dir=back, arrowtail=diamond, headlabel="* "]
        Company -> Department
    }

    /* Aggregation */
    {
        edge [dir=back, arrowtail=odiamond, headlabel="* "]
        Department -> Employeee
    }
}
- graphviz生成图:
- python代码:
from graphviz import Digraph

dot = Digraph(comment='The Composition Graph of YXY')
dot.node('Z', 'Company', shape='box')
dot.node('A', 'Department', shape='box')
dot.node('B', 'Employeee', shape='box')

dot.edge('Z', 'A', arrowtail='diamond', dir='back', headlabel="* ")
dot.edge('A', 'B', arrowtail='odiamond', dir='back', headlabel="* ")
print(dot.source)
dot.view()
- python生成图:
结语
如果您觉得该方法或代码有一点点用处,可以给作者点个赞,或打赏杯咖啡;╮( ̄▽ ̄)╭
如果您感觉方法或代码不咋地//(ㄒoㄒ)//,就在评论处留言,作者继续改进;o_O???
如果您需要相关功能的代码定制化开发,可以留言私信作者;(✿◡‿◡)
感谢各位大佬童鞋们的支持!( ´ ▽´ )ノ ( ´ ▽´)っ!!!


 5057
5057

 被折叠的 条评论
为什么被折叠?
被折叠的 条评论
为什么被折叠?
 到【灌水乐园】发言


