


由垂直变成水平:
由
ax.bar()

变成
ax.barh()
水平翻转:
#加上一条
plt.gca().invert_xaxis()

#同理,plt.gca().invert_yaxis() 是上下翻转

#同时别忘了把之前
ax.set_ylabel('Group')
ax.set_xlabel('Weights')
ax.set_title('Scores by group and gender')
ax.set_yticks(index)
ax.set_yticklabels(('N', 'I', 'E', 'G', 'B', 'C', 'J', 'H'))
#中的x,y颠倒回来
全部代码:
import numpy as np
import matplotlib.pyplot as plt
from matplotlib.ticker import MaxNLocator
from collections import namedtuple
n_groups = 8
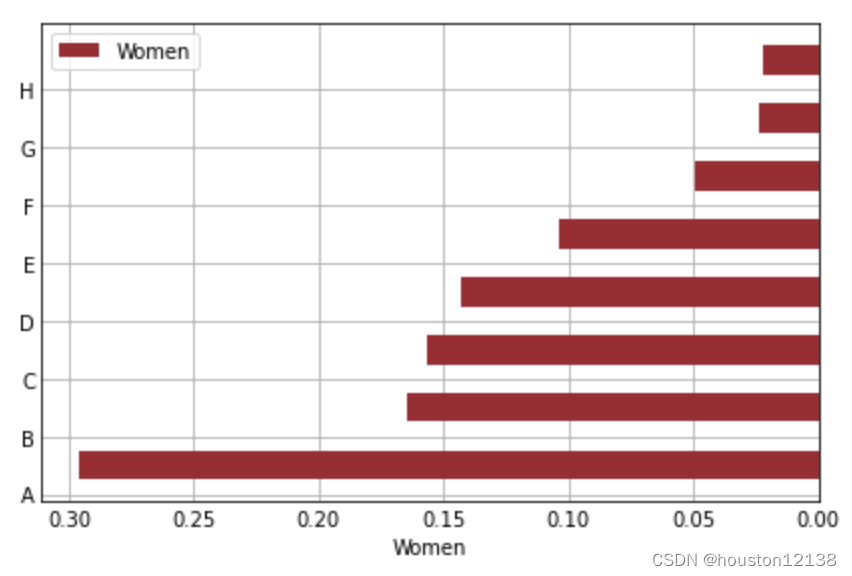
means_women = (0.296, 0.165, 0.157, 0.143, 0.104, 0.049, 0.024, 0.022)
#std_women = (3, 5, 2, 3, 3)
fig, ax = plt.subplots()
index = np.arange(n_groups)
bar_width = 0.5
opacity = 1
error_config = {'ecolor': '0.3'}
rects2 = ax.barh(index + bar_width, means_women, bar_width,
alpha=opacity, color='#A2242F',
label='Women')
#ax.set_ylabel('Group')
ax.set_xlabel('Women')
#ax.set_title('Scores by group and gender')
ax.set_yticks(index)
ax.set_yticklabels(('A', 'B', 'C', 'D', 'E', 'F', 'G', 'H'))
plt.gca().invert_xaxis()
ax.legend()
fig.tight_layout()
plt.show()图变成了:


 3585
3585


 被折叠的 条评论
为什么被折叠?
被折叠的 条评论
为什么被折叠?
 到【灌水乐园】发言


