


- tcpdump
| 参数 | 常用关键字 |
|---|---|
| 类型 | host/port |
| 方向 | src/dst |
| 协议 | tcp/udp/ip |
| 逻辑 | and/or/not |
| 常用参数 | -i 指定网卡 -s 指定包长度 -s0 抓取完整包 -c 指定抓包数量 -n 以数字的方式显示ip/port -A 以ASCII格式显示 -x 以十六进制显示 -X 以十六进制ASCII显示 -w 将抓取的数据写入文件 -r 读取存储数据的文件 eg: sudo /usr/sbin/tcpdump src host 10.123.9.12 and port 36000 -Xs70 -iany -n -c10 |
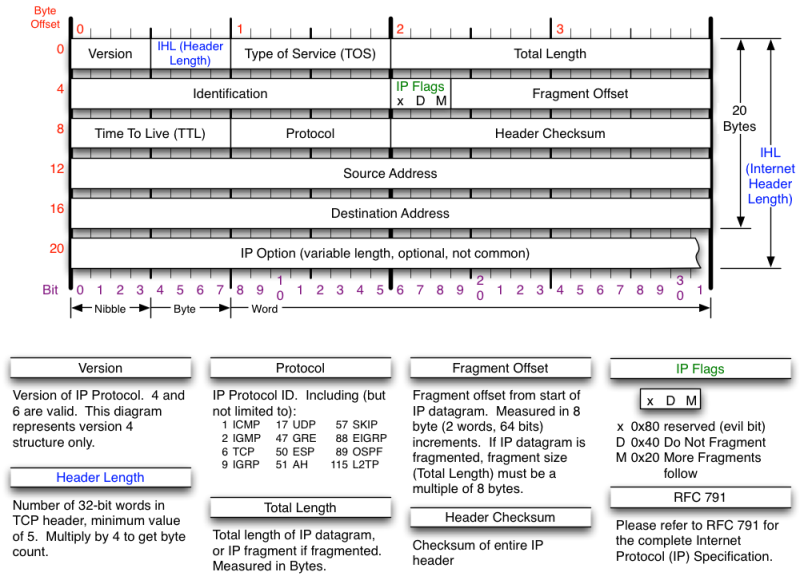
ip报头结构:
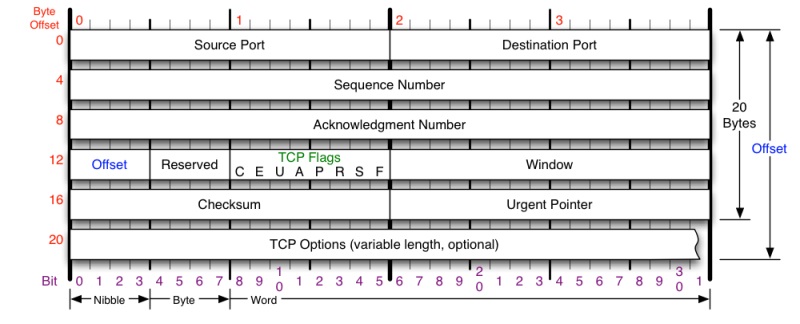
tcp报头结构
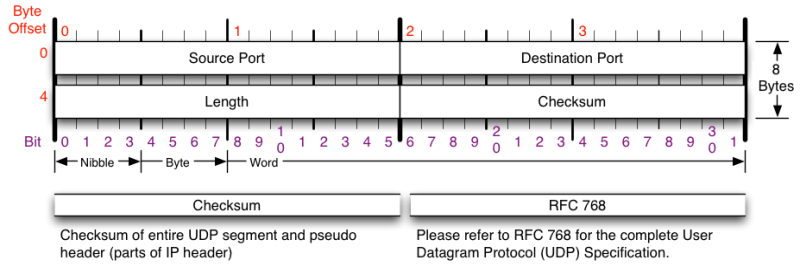
udp报头结构
2. curl
| 参数 | 说明 |
|---|---|
| curl 直接加网址 | 获取某个html页面 eg:curl "v.qq.com/" |
| curl -o | 将获取的内容保存为文件 eg:curl -o test.html "v.qq.com/" |
| curl -x | 指定服务器ip和端口 eg:curl "v.qq.com/" -x "119.147.33.29:80" |
| curl -b | 添加cookie信息 eg:curl "v.qq.com/" -x "119.147.33.29:80" -b "xxx" |
| curl -d | 发起post请求 eg:curl -d "param1=value1¶m2=value2" "v.qq.com/" |
3. top
默认top命令
按下1键,可以显示每个cpu的情况:
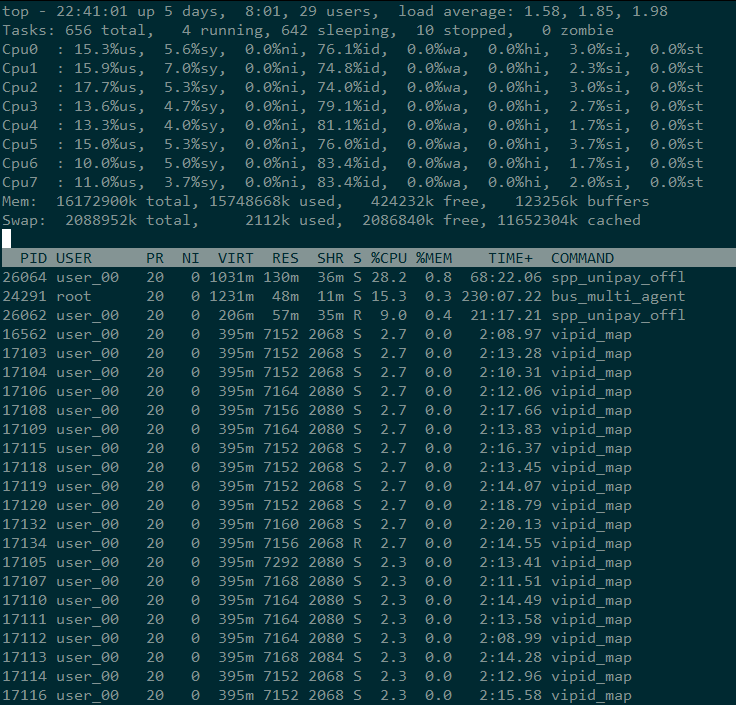
第一行,任务队列信息:
22:41:01 — 当前系统时间
up 5 days, 8:01 — 系统已经运行了5天8小时1分钟(在这期间系统没有重启过)
users — 当前有29个用户登录系统
load average: 1.58, 1.85, 1.98 — load average后面的三个数分别是1分钟、5分钟、15分钟的负载情况。
load average数据是每隔5秒钟检查一次活跃的进程数,然后按特定算法计算出的数值。如果这个数除以逻辑CPU的数量,结果高于5的时候就表明系统在超负荷运转了。
第二行,Tasks — 任务(进程),具体信息说明如下:
系统现在共有656个进程,其中处于运行中的有4个,642个在休眠(sleep),stoped状态的有10个,zombie状态(僵尸)的有0个。
第三行,cpu状态信息,具体属性说明如下:
us — 用户空间占用CPU的百分比。
sy — 内核空间占用CPU的百分比。
ni — 改变过优先级的进程占用CPU的百分比
id — 空闲CPU百分比
wa — IO等待占用CPU的百分比
hi — 硬中断(Hardware IRQ)占用CPU的百分比
si — 软中断(Software Interrupts)占用CPU的百分比
第四行,内存状态,具体信息如下:
total — 物理内存总量
used — 使用中的内存总量
free — 空闲内存总量
buffers — 缓存的内存量
swap交换分区信息,具体信息说明如下:
total — 交换区总量
used — 使用的交换区总量
free — 空闲交换区总量
cached — 缓冲的交换区总量
备注:
第四行中使用中的内存总量(used)指的是现在系统内核控制的内存数,空闲内存总量(free)是内核还未纳入其管控范围的数量。纳入内核管理的内存不见得都在使用中,还包括过去使用过的现在可以被重复利用的内存,内核并不把这些可被重新使用的内存交还到free中去,因此在linux上free内存会越来越少,但不用为此担心。
如果出于习惯去计算可用内存数,这里有个近似的计算公式:第四行的free + 第四行的buffers + 第五行的cached。
对于内存监控,在top里我们要时刻监控第五行swap交换分区的used,如果这个数值在不断的变化,说明内核在不断进行内存和swap的数据交换,这是真正的内存不够用了。
第七行以下:各进程(任务)的状态监控,项目列信息说明如下:
PID — 进程id
USER — 进程所有者
PR — 进程优先级
NI — nice值。负值表示高优先级,正值表示低优先级
VIRT — 进程使用的虚拟内存总量,单位kb。VIRT=SWAP+RES
RES — 进程使用的、未被换出的物理内存大小,单位kb。RES=CODE+DATA
SHR — 共享内存大小,单位kb
S — 进程状态。D=不可中断的睡眠状态 R=运行 S=睡眠 T=跟踪/停止 Z=僵尸进程
%CPU — 上次更新到现在的CPU时间占用百分比
%MEM — 进程使用的物理内存百分比
TIME+ — 进程使用的CPU时间总计,单位1/100秒
COMMAND — 进程名称(命令名/命令行)
top -p pid 显示指定的进程信息
4. netstat
| 参数 | 说明 |
|---|---|
| -a | 列出所有当前的连接 |
| -t | 列出TCP协议的连接 |
| -u | 列出UDP协议的连接 |
| -n | 禁止域名解析,加快查询速度 |
| -l | 列出监听中的连接 LISTEN |
| -p | 列出进程信息 |
| -c | 持续输出信息 |
| 常用命令 | netstat -natp |
5. makefile 相关
| 参数 | 说明 |
|---|---|
| -I dir | Add the directory dir to the list of directories to be searched for header files. This can be used to override a system header file, substituting your own version,since these directories are searched before the system header file directories. However, you should not use this option to add directories that contain vendor-supplied system header files (use -isystem for that). If you use more than one -I option, the directories are scanned in left-to-right order; the standard system directories come after. |
| -L dir | Add directory dir to the list of directories to be searched for -l. |
| -Wl,option | Pass option as an option to the linker. If option contains commas, it is split into multiple options at the commas. You can use this syntax to pass an argument to the option. For example, -Wl,-Map,output.map passes -Map output.map to the linker. When using the GNU linker, you can also get the same effect with -Wl,-Map=output.map. |
| -rpath dir | Add a directory to the runtime library search path. |
| -w | Inhibit all warning messages. |
| -Wall | This enables all the warnings about constructions that some users consider questionable, and that are easy to avoid (or modify to prevent the warning), even in conjunction with macros. This also enables some language-specific warnings described in C++ Dialect Options and Objective-C and Objective-C++ Dialect Options. |
6. gdb相关
在使用g++或者gcc编译程序的时候,加入-g的选项,便会在可执行程序中加入相关的调试信息.
说明: -g Produce debugging information in the operating system’s native format (stabs, COFF, XCOFF, or DWARF 2). GDB can work with this debugging information.
例: g++ -c test.cpp -o test -g; gdb ./test
| 参数 | 说明 |
|---|---|
| list [file:]function | type the text of the program in the vicinity of where it is presently stopped. |
| break [file:]function | Set a breakpoint at function (in file). |
| bt | Backtrace: display the program stack. |
| print expr | Display the value of an expression. |
| c | Continue running your program (after stopping, e.g. at a breakpoint). |
| next | Execute next program line (after stopping); step over any function calls in the line. |
| step | Execute next program line (after stopping); step into any function calls in the line. |
| frame n | show the No.n level of the program stack |
| quit | Exit from GDB. |
启动gdb的几种方式
1. gdb program
2. gdb program croe 同时调试一个程序和coredump文件
3. gdb program pid 调试一个正在服务的程序,gdb会自动attach上去
coredump相关
ulimit -c 可以查看是否开启coredump文件生成, 若返回0,则程序不生成core文件
开启生成core文件 ulimit -c size(unlimited), size指定生成core文件的最大大小,单位为blocks,如果不限制core文件的大小,可以将size设置为unlimited
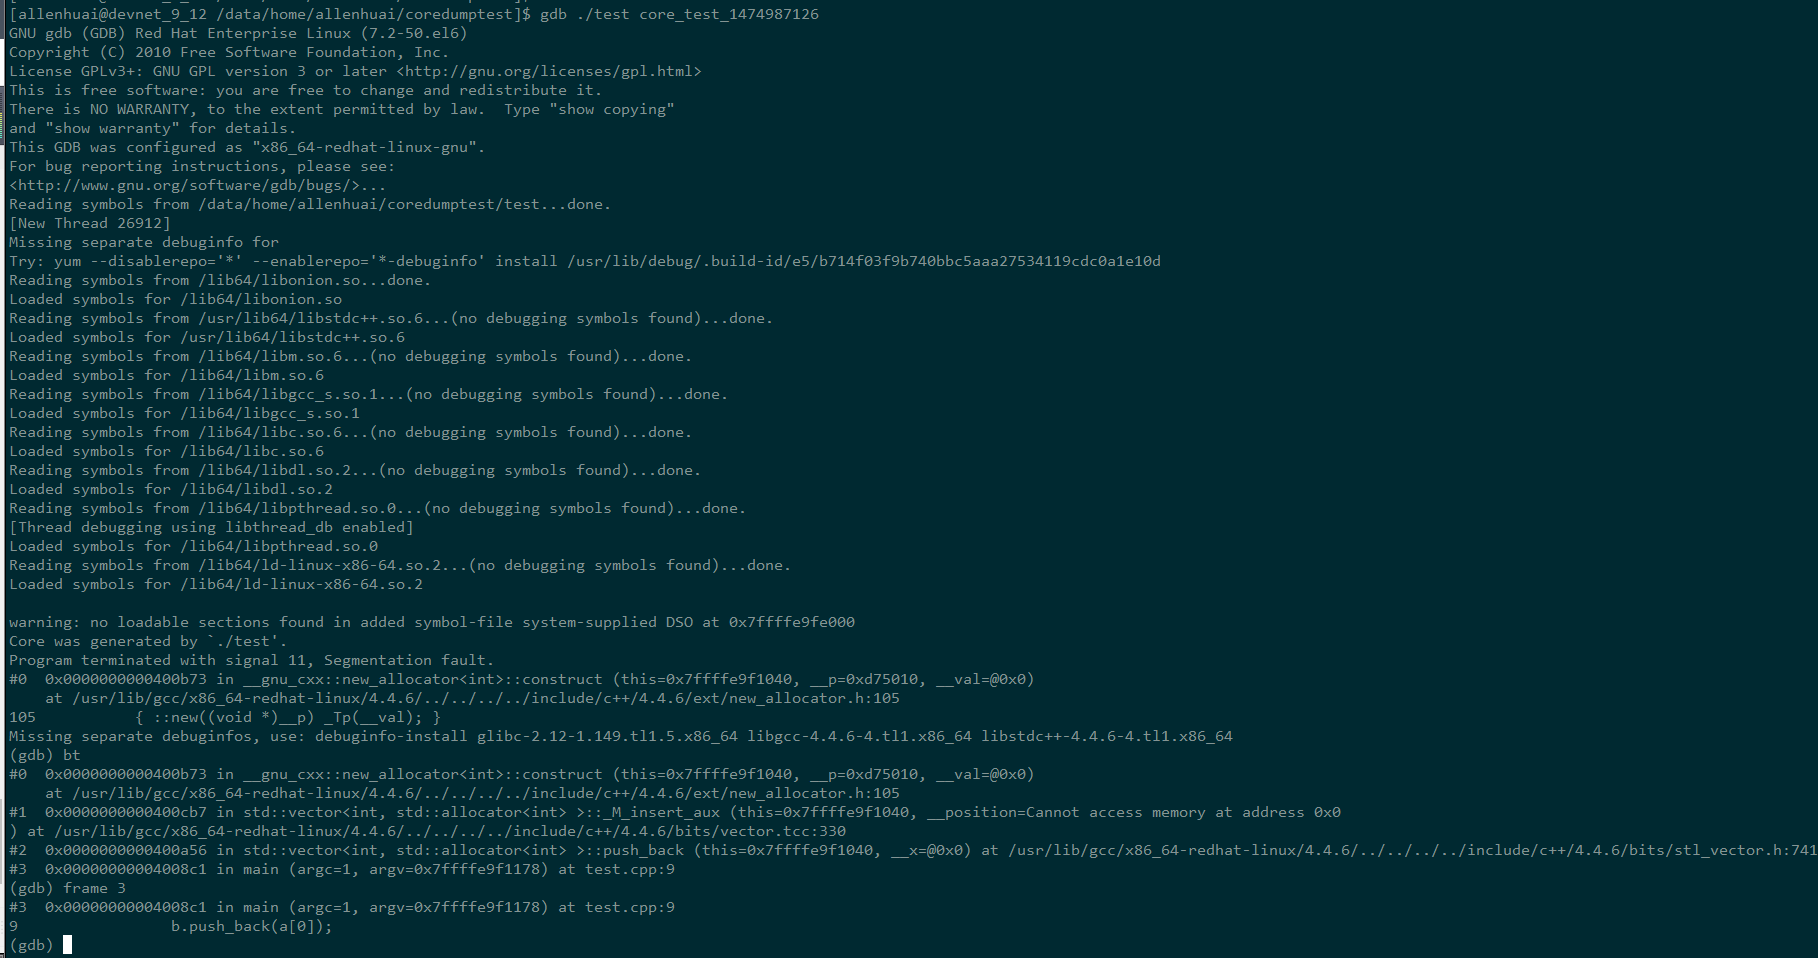
coredump定位
例:
  1 #include <vector>
  2 using namespace std;
  3
  4 int main(int argc, char const *argv[])
  5 {
  6       vector<int> a;
  7       vector<int> b;
  8
  9       b.push_back(a[0]);
 10
 11       return 0;
 12 }
g++ test.cpp -o test -g; chmod a+x ./test; ./test
Segmentation fault (core dumped)
一般来说,库函数不会有错,所以看一下堆栈信息,即可发现错误.
程序发成coredump,此时程序会生成一个core文件,默认为当前目录下,core文件生成的目录,可以配置.
/proc/sys/kernel/core_pattern可以控制core文件保存位置和文件名格式。


 13万+
13万+

 被折叠的 条评论
为什么被折叠?
被折叠的 条评论
为什么被折叠?
 到【灌水乐园】发言


