


一.前言
GitHub是世界上最大的代码托管平台,超5千万开发者正在使用。GitHub中文社区,是国内领先的开源社区,是一个帮您发现GitHub上优质开源项目的地方。
它的首页动画很有意思,如下:
动画主要展示了世界各地都在用github,闪光点和发出的射线表达了各地的pull,merge,push等操作,比较生动并且科技感十足。
这边我们将代码扒了下来,并去掉了多余不关心的部分,方便我们进行解析。
本文主要对如下三点进行解析:
1.地球的制作,世界地图的描点
2.射线和冒尖闪光点的制作
3.鼠标hover的交互原理,点击跳转等
二.动画解析
1.制作地球仪
地球严谨上来讲是个椭圆球体,但是为了方便计算这里当作标准球体。
球体创建
    const geometry = new SphereBufferGeometry(radius, detail, detail);      //构建几何球体,radius为半径,detail为段数

    const materialFill = new MeshStandardMaterial({         //使用PBR物理材质
      color: waterColor,                                    //材质颜色使用深蓝色
      metalness: 0,                                         //金属度
      roughness: 0.9,                                       //粗糙度
    });

    this.uniforms = [];
    /*
    省略材质预编译代码
    */

    this.mesh = new Group();
    const meshFill = new Mesh(geometry, materialFill);
    meshFill.renderOrder = 1;
    this.mesh.add(meshFill);
    this.meshFill = meshFill;
    this.materials = [materialFill];
更详细的代码在Globe类中,其中还包含了一些光线和阴影的处理,这里先忽略不做分析。
加载地图数据
    loadAssets() {
        let basePath = 'webgl-globe/';
        let imagePath = 'images/';
        const dataPath = `${basePath}data/`;

        // eslint-disable-next-line no-nested-ternary
        const manifest = [
          { url: `${basePath}${imagePath}map.png`, id: 'worldMap' }
        ];

        const loader = new Loader();

        return new Promise((resolve, reject) => {
          loader
            .load(manifest)
            .then(({ assets }) => {
              resolve(assets);
              loader.dispose();
            })
            .catch((error) => reject(error));
        });
      }
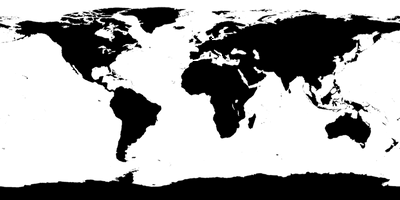
如何根据如上地图把点描在地图上,当然不是用贴图的方法,因为我们需要每个点的信息。根据逐个映射的方法可以来填充地图,图中黑色部分就是地域,透明部分就是海洋,那我们只用把黑色部分映射出来即可。这里面有几个点需要处理:
1.如何获取纹理数据
2.已知经纬度,如何判断有效点 (图中黑色的像素点)
3.如何映射
获取纹理数据
getImageData(image) {
    const canvas = document.createElement('canvas');
    const ctx = canvas.getContext('2d');
    ctx.canvas.width = image.width;
    ctx.canvas.height = image.height;
    ctx.drawImage(image, 0, 0, image.width, image.height);
    return ctx.getImageData(0, 0, image.width, image.height);
}
用上面拿到的imageData来创建上下文,然后用getImageData就可以获取纹理数据
根据经纬度判断有效点
visibilityForCoordinate(long, lat, imageData) {
    const dataSlots = 4;                              //R、G、B、A 每个像素用4个1bytes值
    const dataRowCount = imageData.width * dataSlots; //行数据个数
    const x = parseInt((long + 180)/360 * imageData.width + 0.5);   //根据经度计算横坐标  (-180,180) => (0,360)
    const y = imageData.height - parseInt((lat + 90)/180 * imageData.height - 0.5); //纬度范围 (-90,90) => (0,180) 上面是0 所以用imageData.height来减
    const alphaDataSlot = parseInt(dataRowCount * (y - 1)  + x * dataSlots) + (dataSlots - 1);

    return imageData.data[alphaDataSlot] > MAP_ALPHA_THRESHOLD;     //该点在图片上的透明度大于阈值
}
根据经纬度来确定横纵,找到该像素在imageData数组中的点,(dataSlots - 1)就是rgba中的a即透明值
如何映射
function polarToCartesian(lat, lon, radius, out) {     //根据球的参数方程来转化
  out = out || new Vector3();
  const phi = (90 - lat) * DEG2RAD;
  const theta = (lon + 180) * DEG2RAD;
  out.set(-(radius * Math.sin(phi) * Math.cos(theta)), radius * Math.cos(phi), radius * Math.sin(phi) * Math.sin(theta));
  return out;
}
回忆一下球的参数方程:x=a+Rsinu,y=b+Rsinucosv,z=c+Rsinusinv(u,v为参数)
这里几何的意义是将极坐标转化为笛卡尔坐标
填充地图
处理了上述这些问题,我们就可以开始填充地图了
buildWorldGeometry() {
      const { assets: { textures: { worldMap }, }, } = AppProps;
      const dummyDot = new Object3D();
      const imageData = this.getImageData(worldMap.image);
      const dotData = [];
      const dotResolutionX = 2; // how many dots per world unit along the X axis
      const rows = this.worldDotRows;
      for (let lat = -90; lat <= 90; lat += 180/rows) {         //纬度(-90,90)
        const segmentRadius = Math.cos(Math.abs(lat) * DEG2RAD) * GLOBE_RADIUS;   //半径
        const circumference = segmentRadius * Math.PI * 2;      //圆周长
        const dotsforRow = circumference * dotResolutionX;      //一行的点数=圆周长x2
        for (let x = 0; x < dotsforRow; x++) {
          const long = -180 + x*360/dotsforRow;                 //经度
          if (!this.visibilityForCoordinate(long, lat, imageData)) continue;  //检测该经纬度是否可见
          const pos = polarToCartesian(lat, long, this.radius);  //极坐标转笛卡3D尔坐标
          dummyDot.position.set(pos.x, pos.y, pos.z);
          const lookAt = polarToCartesian(lat, long, this.radius + 5);
          dummyDot.lookAt(lookAt.x, lookAt.y, lookAt.z);
          dummyDot.updateMatrix();
          dotData.push(dummyDot.matrix.clone());  //得到三维点的矩阵
        }
      }
      const geometry = new CircleBufferGeometry(this.worldDotSize, 5);    //圆点
      const dotMaterial = new MeshStandardMaterial({ color: COLORS.LAND, metalness: 0, roughness: 0.9, transparent: true, alphaTest: 0.02 }); //物理材质
      dotMaterial.onBeforeCompile = function (shader) {
        const fragmentShaderBefore = 'gl_FragColor = vec4( outgoingLight, diffuseColor.a );'
        const fragmentShaderAfter = `
          gl_FragColor = vec4( outgoingLight, diffuseColor.a );
          if (gl_FragCoord.z > 0.51) {
            gl_FragColor.a = 1.0 + ( 0.51 - gl_FragCoord.z ) * 17.0;
          }
        `
        shader.fragmentShader = shader.fragmentShader.replace(fragmentShaderBefore, fragmentShaderAfter); //替换成成自定义的材质
      };
      const dotMesh = new InstancedMesh(geometry, dotMaterial, dotData.length);  //多实例渲染,提升性能
      for (let i = 0; i < dotData.length; i++) dotMesh.setMatrixAt(i, dotData[i]);
      dotMesh.renderOrder = 3;
      this.worldMesh = dotMesh;
      this.container.add(dotMesh);    //添加所有的有效区域点
    }
上述代码的逻辑是:
1.将球以经纬度分成若干份,即球面由若干个3D点组成
2.然后根据经纬度拿到该点对应地图上的像素alpha值,筛选掉无效区域(即透明区域)
3.将筛选后的点 根据经纬度转化成笛卡尔3D坐标,即球面上的有效点
4.根据3D有效点,创建圆形的小亮点,添加在container上 即下图中的一个个小白点
图2.2 球体上添加有效区域点后,简单地球仪的样子
2.射线和尖峰点的制作
射线的制作
    {
        "uml": "California City",
        "gm": {
            "lat": 35.1258,
            "lon": -117.9859
        },
        "uol": "California City",
        "gop": {                                            //经纬度
            "lat": 35.1258,
            "lon": -117.9859
        },
        "l": "Jupyter Notebook",
        "nwo": "executablebooks/sphinx-book-theme",         //name with owner
        "pr": 506,
        "ma": "2022-02-24T22:44:55Z",
        "oa": "2022-02-24T00:27:54Z"
    },
上面是单个数据,data.json数据中包含了所有的git分支open,merge信息,包括地点时间,作者等。
制作射线的思路是根据json中的数据取出open和merge两个经纬度的坐标,如果这个坐标满足条件(距离大于一定长度,例如上面距离为0就忽略),就根据两个点 以及两者之间得到贝塞尔曲线的两个控制点。得到曲线后,根据我们前面文章有提到的TubeBufferGeometry建立管道,就可以得到弧线(射线其实可以看做是超级瘦的管道)。
来结合代码看一下创建射线的过程:
for (let i = 0; i < maxAmount; i++) {
        const { gop, gm } = data[i];
        // Casting longitude and latitude into numbers
        const geo_user_opened = { lat: +gop.lat, lon: +gop.lon };         //取open点
        const geo_user_merged = { lat: +gm.lat, lon: +gm.lon };           //取merge点
        if (!hasValidCoordinates(geo_user_opened) || !hasValidCoordinates(geo_user_merged)) {
          continue;
        }
        const vec1 = polarToCartesian(geo_user_opened.lat, geo_user_opened.lon, radius);
        const vec2 = polarToCartesian(geo_user_merged.lat, geo_user_merged.lon, radius);
        const dist = vec1.distanceTo(vec2);
        if (dist > 1.5) {                                                         //距离大于1.5才继续
          // arcs in outer orbit
          let scalar;
          if (dist > radius * 1.85) {                                             //距离和radius乘以一个系数比较,获取scale
            scalar = map(dist, 0, radius * 2, 1, 3.25);
          } else if (dist > radius * 1.4) {
            scalar = map(dist, 0, radius * 2, 1, 2.3);
          } else {
            scalar = map(dist, 0, radius * 2, 1, 1.5);
          }
          const midPoint = latLonMidPoint(geo_user_opened.lat, geo_user_opened.lon, geo_user_merged.lat, geo_user_merged.lon);  //获取中点
          const vecMid = polarToCartesian(midPoint[0], midPoint[1], radius * scalar);
          ctrl1.copy(vecMid);
          ctrl2.copy(vecMid);
          const t1 = map(dist, 10, 30, 0.2, 0.15);    //[10,30] => [0.2, 0.15]
          const t2 = map(dist, 10, 30, 0.8, 0.85);    //[10,30] => [0.8, 0.85]
          scalar = map(dist, 0, radius * 2, 1, 1.7);
          const tempCurve = new CubicBezierCurve3(vec1, ctrl1, ctrl2, vec2);       //建立临时三维贝塞尔曲线
          tempCurve.getPoint(t1, ctrl1);        //根据t1设置ctrl1点
          tempCurve.getPoint(t2, ctrl2);        //根据t2设置ctrl2点
          ctrl1.multiplyScalar(scalar);         //根据scale放大
          ctrl2.multiplyScalar(scalar);
          const curve = new CubicBezierCurve3(vec1, ctrl1, ctrl2, vec2);           //建立三维贝塞尔曲线
          // i is used to offset z to make sure that there's no z-fighting (objects
          // being rendered on the  same z-coordinate), which would cause flickering
          const landingPos = polarToCartesian(geo_user_merged.lat, geo_user_merged.lon, radius + i/10000);  //转笛卡尔坐标,i参与计算防止z-fighting
          const lookAt = polarToCartesian(geo_user_merged.lat, geo_user_merged.lon, radius+5);
          this.landings.push({pos: landingPos, lookAt: lookAt });
          const curveSegments = MIN_LINE_DETAIL + parseInt(curve.getLength());
          const geometry = new TubeBufferGeometry(curve, curveSegments, TUBE_RADIUS, this.TUBE_RADIUS_SEGMENTS, false);
          const hitGeometry = new TubeBufferGeometry(curve, parseInt(curveSegments/this.HIT_DETAIL_FRACTION), TUBE_HIT_RADIUS, this.TUBE_RADIUS_SEGMENTS, false);
          geometry.setDrawRange(0, 0);
          hitGeometry.setDrawRange(0, 0);
          const lineMesh = new Mesh(geometry, this.tubeMaterial);             //曲线mesh
          const lineHitMesh = new Mesh(hitGeometry, this.hiddenMaterial);     //选中态的mesh 默认隐藏
          lineHitMesh.name = 'lineMesh';
          lineMesh.userData = { dataIndex: i };
          lineHitMesh.userData = { dataIndex: i, lineMeshIndex: this.lineMeshes.length };
          this.lineMeshes.push(lineMesh);
          this.lineHitMeshes.push(lineHitMesh);
        }
      }
      const { width, height } = parentNode.getBoundingClientRect();
    }
这其中latLonMidPoint是根据两个经纬度坐标求中点坐标 ,这里重点讲一下:
直接进行经纬度求平均值是肯定不可取的,自己画个示意图就能知道。
正确的做法是求两个点在三个轴分量的平均值,然后在反向合成 即可求出中点。
先看下图:
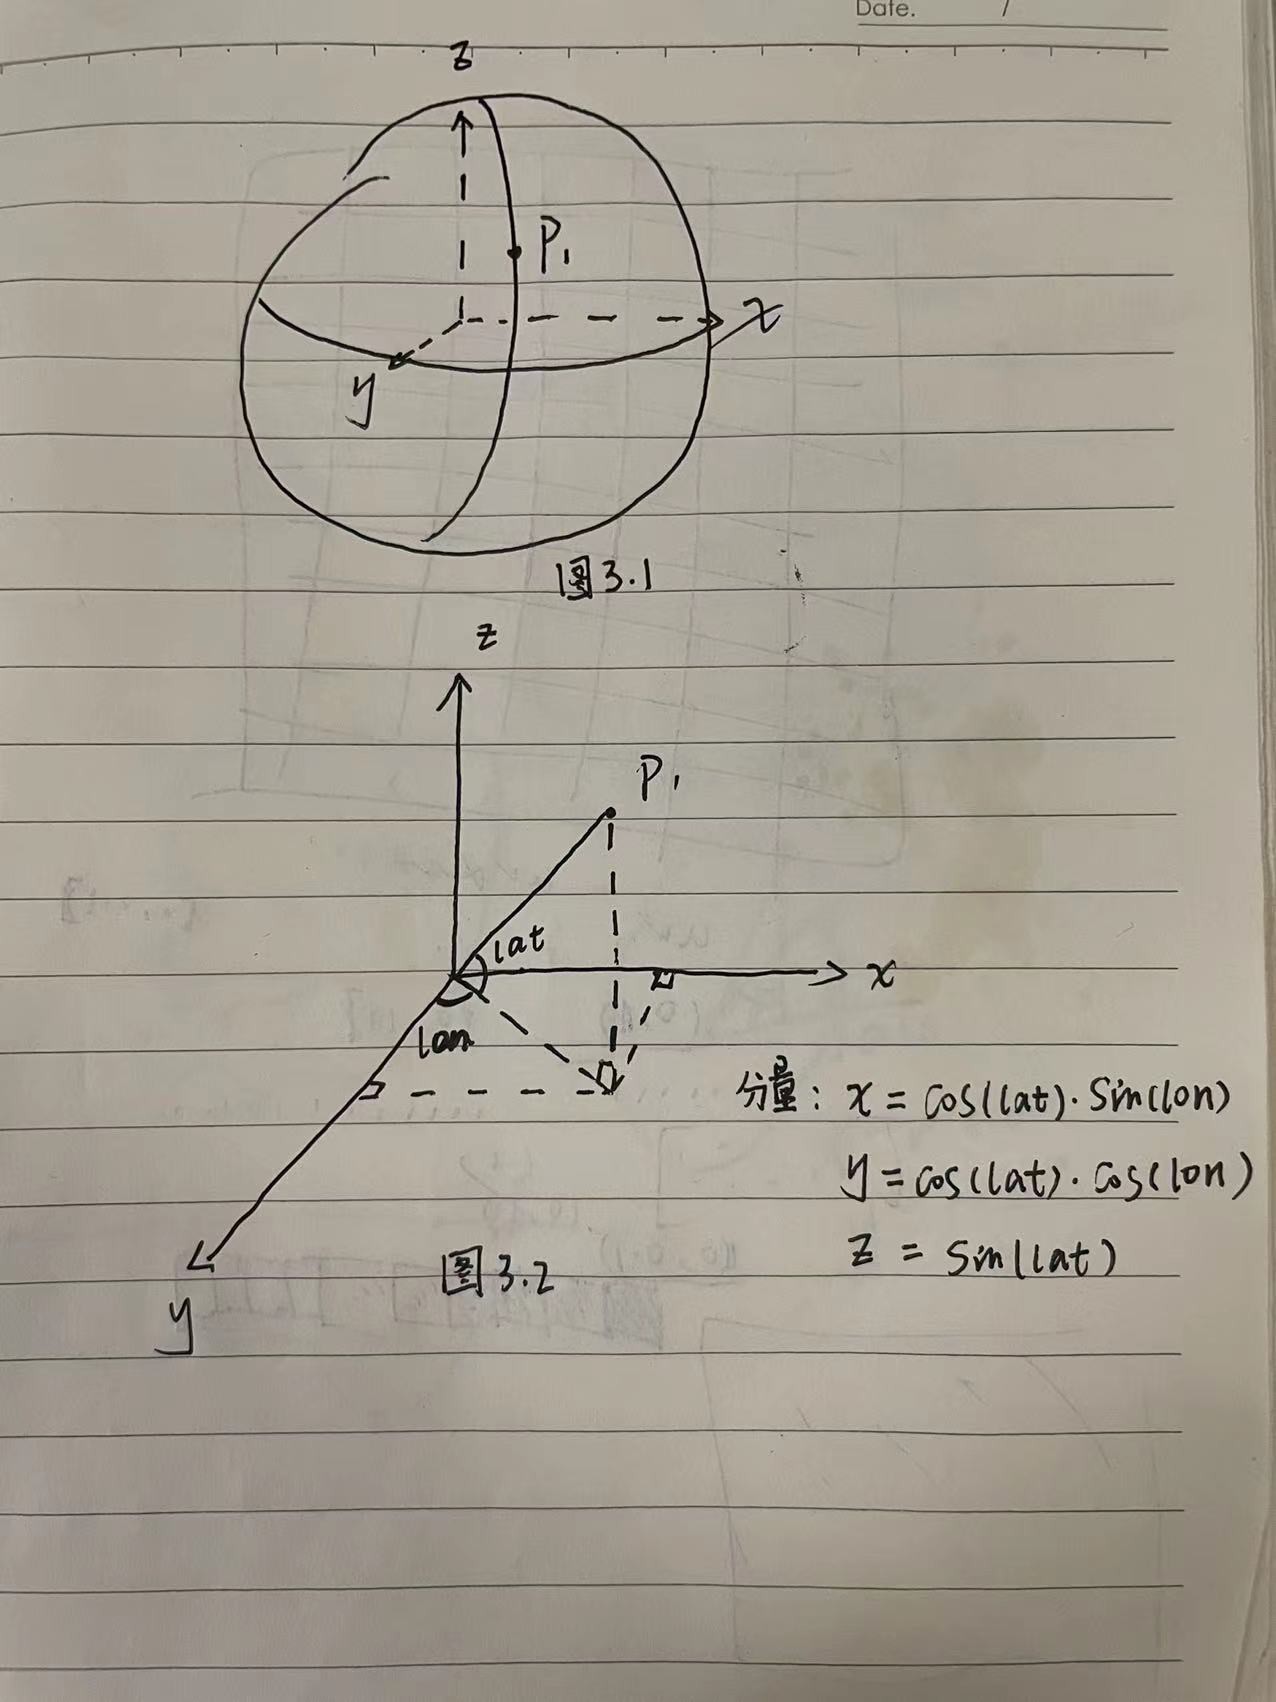
图3.1是P1点在球体的空间示意图,图3.2是P1点的投影图,3.2中列出了求分量的公式。上代码:
function latLonMidPointMul(latlonArr){
  let x = 0,y = 0, z = 0;
  let lon,lat;
  for(var i = 0; i < latlonArr.length; i++){
    let latlon = latlonArr[i];
    lon = degreesToRadians(latlon.lon);
    lat = degreesToRadians(latlon.lat);

    x += Math.cos(lat) * Math.sin(lon);
    y += Math.cos(lat) * Math.cos(lon);
    z += Math.sin(lat);
  }

  x /= latlonArr.length;
  y /= latlonArr.length;
  z /= latlonArr.length;

  lon = radiansToDegrees(Math.atan2(x,y));
  lat = radiansToDegrees(Math.atan2(z,Math.sqrt(x*x + y*y)));
  return [lon, lat];
}
这里代码扩展了一下可以求多个点的中心点,degreesToRadians和radiansToDegrees是弧度和角度的转换,先转为弧度是为了方便三角函数的运算,后转成角度输出得到中心点的经纬度。
产生射线的动画
根据上面的原理和算法我们得出了想要的射线,动画只需要根据geometry的内置函数setDrawRange来实现即可,先来看一下函数定义:
	setDrawRange( start, count ) {
		this.drawRange.start = start;
		this.drawRange.count = count;
	}
顾明思议,设置起点和终点即可。起点和终点的坐标我们是已知的,那么只需要在update中给一定的速度让他增长即可,具体实现可以看一下代码:
update(delta = 0.01, visibleIndex) {
    let newVisibleIndex = parseInt(this.visibleIndex + delta * this.DATA_INCREMENT_SPEED);
    if (newVisibleIndex >= this.lineMeshes.length) {
    newVisibleIndex = 0;
    this.visibleIndex = 0;
    }
    if (newVisibleIndex > this.visibleIndex) this.isAnimating.push(this.animatedObjectForIndex(newVisibleIndex));     //新加入一条线
    let continueAnimating = [];
    let continueAnimatingLandingOut = [];
    for (const animated of this.isAnimating) {      //遍历animating数组(场景中存在一个或多个线段在做动画)
    const max = animated.line.geometry.index.count;
    const count = animated.line.geometry.drawRange.count + delta * this.lineAnimationSpeed;   //曲线根据速度向前移动一段距离
    let start = animated.line.geometry.drawRange.start + delta * this.lineAnimationSpeed;

    if (count >= max && start < max) this.animateLandingIn(animated);

    if (count >= max * this.PAUSE_LENGTH_FACTOR + this.MIN_PAUSE && start < max) {            //反向走
        // Pause animation of this line if it's being hovered
        if (animated.line == this.highlightedMesh) {        //鼠标hover的话 暂停
        continueAnimating.push(animated);
        continue;
        }
        start = this.TUBE_RADIUS_SEGMENTS * Math.ceil(start/this.TUBE_RADIUS_SEGMENTS);
        const startHit = this.TUBE_RADIUS_SEGMENTS * Math.ceil(start/this.HIT_DETAIL_FRACTION/this.TUBE_RADIUS_SEGMENTS);
        animated.line.geometry.setDrawRange(start, count);                                      //设置进度
        animated.lineHit.geometry.setDrawRange(startHit, count/this.HIT_DETAIL_FRACTION);
        continueAnimating.push(animated);
    } else if (start < max) {                                                                 //正向走
        animated.line.geometry.setDrawRange(0, count);
        animated.lineHit.geometry.setDrawRange(0, count/this.HIT_DETAIL_FRACTION);
        continueAnimating.push(animated);
    } else {
        this.endAnimation(animated);                                                             //走完了
    }
    }
    for (let i = 0; i < this.animatingLandingsOut.length; i++) {
    if (this.animateLandingOut(this.animatingLandingsOut[i])) {                                //应该结束就返回false,返回为true下次继续走相当于循环
        continueAnimatingLandingOut.push(this.animatingLandingsOut[i]);                          //不该结束放入continue数组
    }
    }
    this.isAnimating = continueAnimating;
    this.animatingLandingsOut = continueAnimatingLandingOut;
    this.visibleIndex = this.visibleIndex + delta * this.DATA_INCREMENT_SPEED;
}
尖峰点的制作
这里尖峰点指地球动画上像触须一样的点,头上还有一个亮点。
触须使用CylinderBufferGeometry来实现,两点是point粒子,动画的实现方法参考射线,这里就不再赘述,有兴趣的可以看一下源码 我在里面附加了注释
三.交互原理
1.自转和拖拽旋转
自动和拖拽旋转就是根据鼠标操作控制rotaion,threejs也有自己的工具类支持,这里编写了control类来实现,方便添加一些自定义的处理。
2.hover亮起和跳转
3D里的鼠标交互基本都是用射线检测来实现的,那本例中如何根据射线检测来实现呢,这里结合代码来讲:
function getMouseIntersection(mouse, camera, objects, raycaster, arrayTarget, recursive = false) {
  raycaster = raycaster || new Raycaster();       //new一条射线
  raycaster.setFromCamera(mouse, camera);         //射线定义为从相机鼠标定义一条线
  const intersections = raycaster.intersectObjects(objects, recursive, arrayTarget); //射线穿过的物体会被拾取到arrayTarget
  return intersections.length > 0 ? intersections[0] : null;
}
根据该函数定义,我们只用把需要检测的物体放入objects中即可。
const { raycaster, camera, mouseScreenPos } = this;
const frameValid = this.raycastIndex % this.raycastTrigger === 0;     //10帧检测一次
let found = false;
let dataItem;

if (frameValid) {
this.testForDataIntersection();       //检测数据交互 结果存放于this.intersects

if (this.intersects.length) {         //length>1 则鼠标与点或线相交
    const globeDistance = this.radius * this.containerScale;

    for (let i = 0; i < this.intersects.length && !found; i++) {
    const { instanceId, object } = this.intersects[i]; // vertex index

    if (object.name === 'lineMesh') {                         //弧线
        dataItem = this.setMergedPrEntityDataItem(object);
        found = true;
        break;
    } else if (object === this.openPrEntity.spikeIntersects && this.shouldShowOpenPrEntity(instanceId)) {   //尖峰点
        dataItem = this.setOpenPrEntityDataItem(instanceId);
        found = true;
        break;
    } else if (object.name === 'arcticCodeVault') {       //旗帜
        dataItem = {
        header: 'Arctic Code Vault',
        body: 'Svalbard • Cold storage of the work of 3,466,573 open source developers. For safe keeping.\nLearn more →',
        type: POPUP_TYPES.CUSTOM,
        url: 'https://archiveprogram.github.com'
        }
        this.highlightArcticCodeVault();
        found = true;
        break;
    }
    }
}

if (found && dataItem) {
    this.setDataInfo(dataItem);
    this.dataInfo.show();
} else {
    this.dataInfo.hide();
    this.openPrEntity.setHighlightIndex(-9999);
    this.mergedPrEntity.resetHighlight();
    this.resetArcticCodeVaultHighlight();
    this.dataItem = null;
    if (AppProps.isMobile) this.mouse = { x: -9999, y: -9999 } // Don't let taps persist on the canvas
}
}
上面代码的核心逻辑是:
1.拿到碰撞的物体(可能是地球,射线,尖峰,旗帜)
2.碰撞对应物体后设定特定的状态,并显示dataItem信息
3.根据dataItem信息来设置跳转的url路径
4.鼠标点击后即可跳转,松开后隐藏dataItem面板
其中设定特定状态这里,针对射线和尖峰,代码里有设置高亮的方法
//设置曲线高亮就是替换成高亮材质即可
setHighlightObject(object) {
    const index = parseInt(object.userData.lineMeshIndex);
    const lineMesh = this.lineMeshes[index];
    if (lineMesh == this.highlightedMesh) return;
    lineMesh.material = this.highlightMaterial;
    this.resetHighlight();
    this.highlightedMesh = lineMesh;
}
实质是提前创建了高亮的材质,然后替换材质即可,材质的属性可以随意配置。
跳转就是herf跳转,这里也不展开讲了。
四.结语
此动画初步看时比较复杂难于下手,当逐个解析时还是可以很好的去理解的,难点在于一些立体空间的计算。这方面时间久了不用就非常生疏,好在通过一些投影图的辅助还是可以算出来的。另外,这其中的科技感大多是一些光效的处理,本文并没有做过多的解析,后面有机会会做详细的解析。


 1114
1114


 被折叠的 条评论
为什么被折叠?
被折叠的 条评论
为什么被折叠?
 到【灌水乐园】发言


