


vaspkit自1.2.5版本后即更新了自动绘图功能,绘图的范围包括布里渊区示意图、能带图、态密度图、3d能带等等,均可在vasp计算完成后处理时自动绘制能带,在最新版本更新了可将能带和态密度绘制在一张图片上的功能。
示意图如下
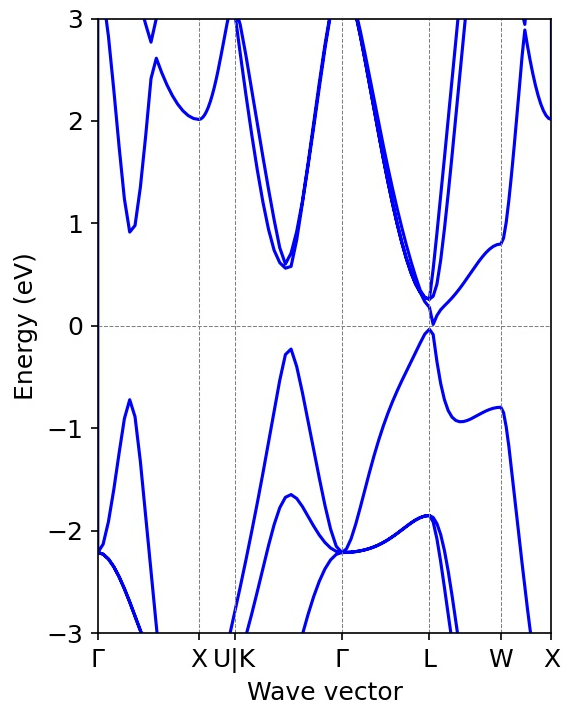
正常能带图(vaspkit-211功能):
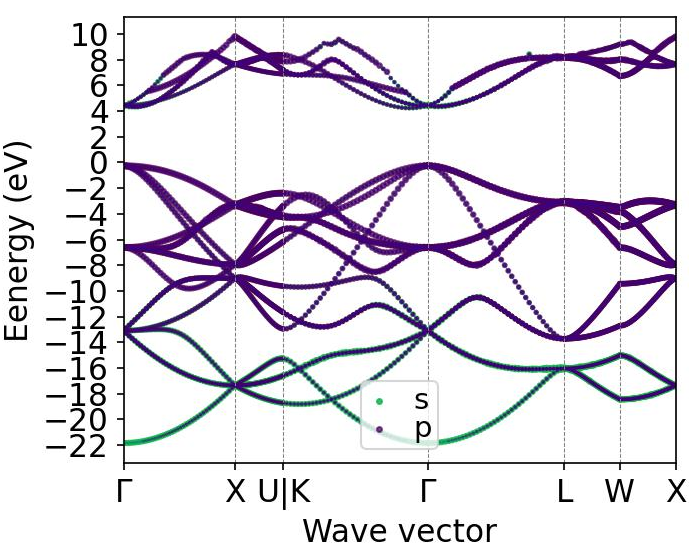
区分s和p轨道贡献的投影能带图(vaspkit-213功能):
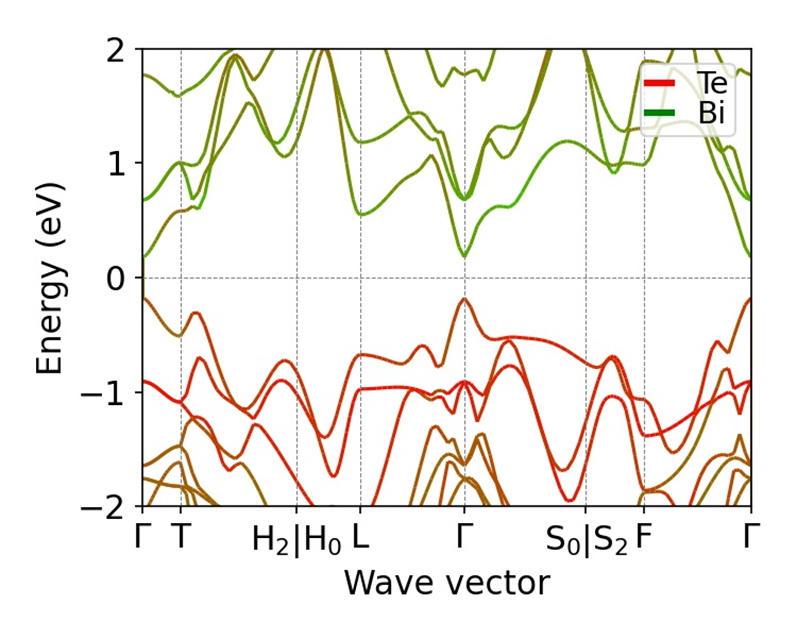
区分不同元素贡献的投影能带图(vaspkit-215功能,限制最多三个元素):
布里渊区图,附带推荐高对称点路径(vaspkit-303功能,依据晶体空间群对称性而定):

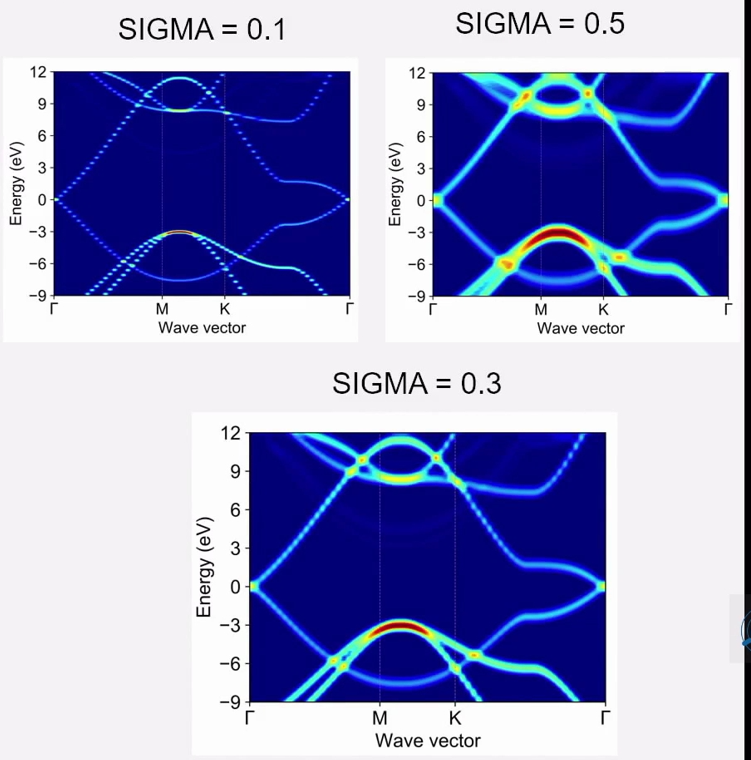
能带反折叠有效能带(vaspkit-282功能,推荐使用matlab后续绘图处理):
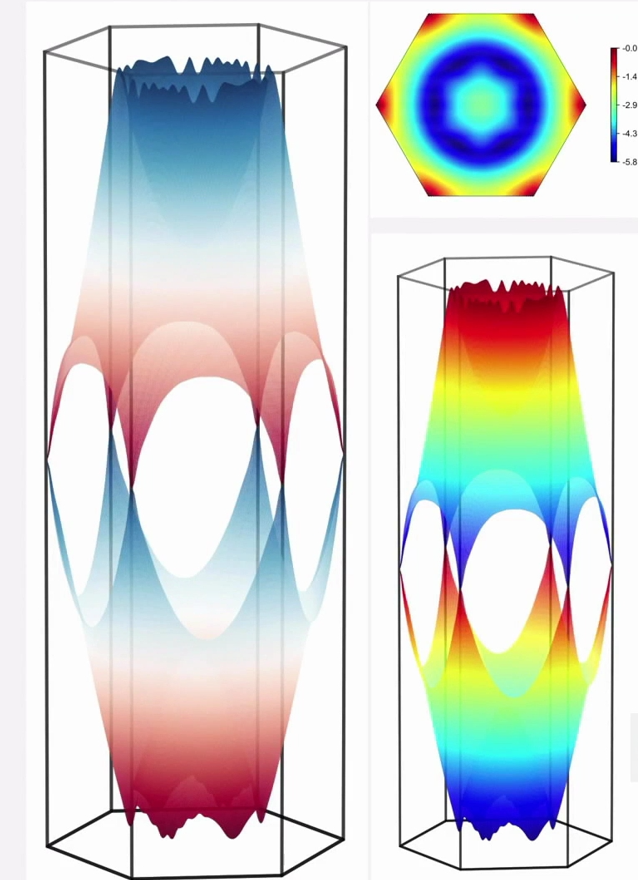
3D能带(vaspkit-23功能,对2维材料HOMO & LUMO Bands绘图,也可使用绘图脚本通过python或matlab绘图):
vaspkit开启自动绘图环境要求:python3 和matplotlib。
建议安装anaconda3完成python环境配置。
vaspkit环境文件路径为~/.vaspkit,可通过vi或vim命令编辑。
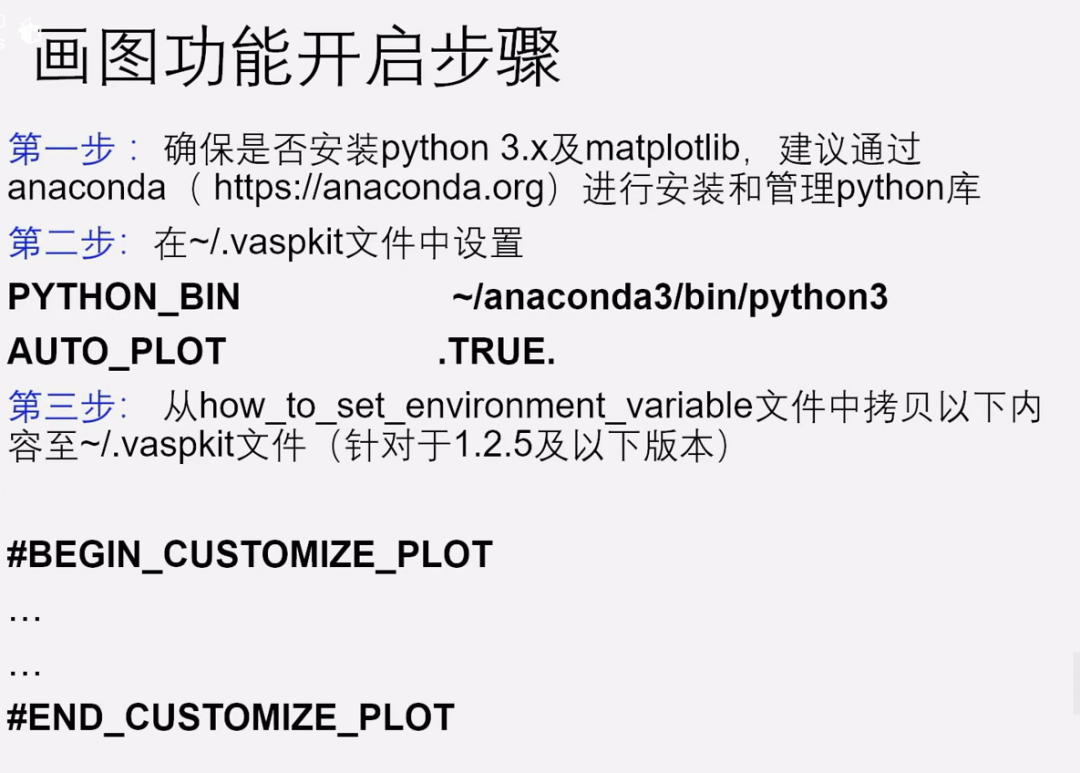
其中,PYTHON_BIN为python3路径,如果anaconda3为默认设置安装的话可直接写为~/anaconda3/bin/python3,如果不清楚系统python路径,可通过下面命令找到路径并替换更改
which python3AUTO_PLOT为是否开启自动绘图功能,默认为FLASE。
在vaspkit的环境配置文件(~/.vaspkit)中,从#BEGIN_CUSTOMIZE_PLOT 到
#END_CUSTOMIZE_PLOT
部分都是画图的设置,部分设置为vaspkit pro的设置内容,即便修改,对普通版vaspkit也不会生效。
具体设置细节可学习matplotlib使用。
开启自动绘图后,在运行vaspkit处理VASP计算数据后,部分环节会出现绘制图片的过程,大部份机器会报字体缺失的问题
findfont: Font family ['arial'] not found. Falling back to DejaVu Sans.这个情况可以直接忽略。
在每次绘图后,在文件夹中会存有一个名为PLOT.In 的文件,如对图片绘制有要求,可以自行更改PLOT.In文件然后重新执行命令,vaspkit会按该文件里的设置重新绘图。
PLOT.In文件和vaspkit环境文件(~/.vaspkit)中从#BEGIN_CUSTOMIZE_PLOT 到
#END_CUSTOMIZE_PLOT的部分基本是一致的。
#BEGIN_CUSTOMIZE_PLOT#+------------------------------------------------------------------------------------------------------------------+#| WARNNING! The character-type values of plot variables are case sensitive and must be enclosed in single quotes. |#+------------------------------------------------------------------------------------------------------------------+# https://matplotlib.org/3.3.3/tutorials/introductory/customizing.html# https://matplotlib.org/tutorials/text/text_props.html# https://github.com/rougier/matplotlib-cheatsheet# Advanced Features of VASPKIT Pro versionfigure_format = 'pdf' # string type (default: 'jpg'). Options: 'png', 'pdf', 'eps', 'jpg', etc.figure_height = 4.0 # float type (default: 4.0). The height of the figure.figure_width = 5.0 # float type (default: 5.0). The width of the figure.dpi = 400 # integer type (default: 400). The resolution of the figure in dots-per-inch.# Global settings =figure_style = 'default' # string type (default: 'default'). Options: 'default', 'classic', 'grayscale', 'seaborn', 'bmh', 'seaborn-notebook', etc.font_family = 'arial' # string type (default: 'arial'). Options: 'fantasy','arial','sans-serif', 'monospace', 'cursive', 'serif', etc.global_fontsize = 12.0 # float type (default: 15.0).label_fontsize = 12.0 # float type (default: 15.0).number_format = '%.3f' # string type (default: 15.0).# Legend-related settings =show_legend = .TRUE. # .TRUE. or .FALSE (default: .TRUE.).legend_location = 'best' # string type (default: 'best'). Options: 'best', 'upper right', 'upper left', 'lower left', 'lower right', 'right', 'center left', 'center right', 'lower center', 'upper center', 'center', etc.legend_fontsize = 12.0 # float type (default: 14.0).=# Line-related settings =line_colors = ['b', 'g', 'r', 'm'] # string type (default: 'blue'). Options: 'red', 'green', 'cyan', '#4c005c', etc.line_styles = ['-', '-', '-', '-'] # string type (default: '-'). Options: '-' or solid, '--' or 'dashed', '-.' or 'dashdot', etc.line_widths = [1.5, 1.5, 1.5] # float type (default: 1.5).line_alpha = [1.0, 1.0, 1.0] # float type (default: 1.0). 0.0< alpha <=1.0, adjust the transparency of each line (by default, alpha=1.0)fill_areas = .FALSE. # .TRUE. or .FALSE (default: .FLASE.). Fill the area between two horizontal curves.# Marker-related settings =#marker_colors = ['blue', 'cyan', 'red', 'magenta', 'orange', 'lawngreen', 'deeppink', 'brown', 'dodgerblue']marker_symbols = ['o','o','o'] # string type (default: 'o'). Options: 'o': Circle, 'x': Cross, '+': Plus sign, 'D': Filled diamond, 's': Square, '^': Triangle, etc.marker_colors = ['#0db14b', '#4c005c', '#d93b2b','#0075dc', '#740aff', '#993f00', '#4c005c', '#426600']marker_sizes = [60, 60.0, 60.0] # float type (default: 10.0).marker_scale = 1.0 # float type (default: 1.0). marker_sizes = marker_sizes * marker_scalemarker_alpha = [0.8, 0.7, 0.6, 0.5, 0.4] # float type (default: 1.0). 0.0< alpha <=1.0), adjust the transparency of markers (by default, alpha=1.0)# Tick-related settings =#x_label = 'Wave vector' # string type (No default value).#y_label = 'Energy (eV)' # string type (No default value).#z_label = 'k$_x$ ($\\mathrm{\\AA}$)' # string type (No default value).#x_limits = [-8.0, 8.0] # float type [xmin, xmax] (No default value).#y_limits = [-8.0, 8.0] # float type [ymin, ymax] (No default value).#z_limits = [-8.0, 8.0] # float type [zmin, zmax] (No default value).#x_major_locator = 2.0 # float type (No default value).#y_major_locator = 2.0 # float type (No default value).#z_major_locator = 2.0 # float type (No default value).#x_minor_locator = 1.0 # float type (No default value).#y_minor_locator = 1.0 # float type (No default value).#z_minor_locator = 1.0 # float type (No default value).# contour-related settingscolormap = 'RdBu' # string typ (default: 'jet'). Options: 'jet', 'hsv', 'viridis', 'gray', etc.contour_levels = 5 # integer type (default: 5).contour_limits = [0.0, 0.5] # float type (No default value).display_colorbar = .FLASE. # .TRUE. or .FALSE (default: .FLASE.).display_level_value = .FLASE. # .TRUE. or .FALSE (default: .FLASE.).colorbar_shrink = 0.5 # float type (default: 0.4).colorbar_orientation = 'vertical' # 'horizontal' or 'vertical' (default: 'horizontal')# 3D-plot related settingselevation = 12.0 # float type (default: 12).azimuth = 24.0 # float type (default: 23).display_coordinate_axes = .TRUE. # .TRUE. or .FALSE (default: .TRUE.).# XKCD sketch-style related settingsxkcd_style = .FALSE. # .TRUE. or .FALSE (default: .FLASE.). Turn on xkcd sketch-style drawing mode or not.xkcd_scale = 1 # float type (default: 1.0). The amplitude of the wiggle perpendicular to the source line (default: 1).xkcd_length = 100 # float type (default: 100.0). The length of the wiggle along the line (default: 100).xkcd_randomness = 2 # float type (default: 2.0). The scale factor by which the length is shrunken or expanded (default: 2).#END_CUSTOMIZE_PLOT


 1108
1108


 被折叠的 条评论
为什么被折叠?
被折叠的 条评论
为什么被折叠?
 到【灌水乐园】发言


