


最近在看《Machine Learning in Action》这本书,自己之前也没有接触过机器学习的相关内容,算是入门吧。书的内容实战性很强,书的作者是用Python进行算法实现的,正好自己也能通过这本书来学习numpy和matplotlib的使用。对于熟悉使用Python进行科学计算来说,真是一举两得。
———————————————————————————————————————————
一、kNN算法原理
k近邻算法是最简单的机器学习算法之一,它的实现原理也非常的简单。存在一个训练样本集,其中每一个样本对应一种分类,即已知训练各样本所属分类。此时输入一个实例,在训练样本集中寻找最近邻的K个实例(这里我们是通过特征向量之间的欧式距离来计算的),这k个实例中的多数类别作为输入实例的类别。
下面从度娘引用一张图来更直观地说明(绿色圆形为输入实例):
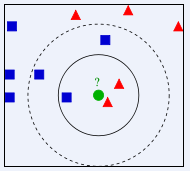
k=3时,最近邻的3个实例是2红三角和1蓝方,此时根据绿圆属于3个中的大多数,也就是红三角;
k=5时,最近邻的5个实例是2红三角和3蓝方,此时根据绿圆属于5个中的大多数,也就是蓝方;
———————————————————————————————————————————
二、kNN算法实现
以约会网站的对象推荐为例。kNN适合数值型和布尔型。我们通过量化特征,来获得相应的训练样本(当然书中已经给我们准备好了量化之后的训练样本),之后就是编写一个小程序:输入量化特征,便能自动输出是“讨厌”,“喜欢”,“疯狂”的结果判定。
# coding: UTF-8
import numpy as np
import matplotlib.pyplot as plt
import operator


def file2mat():
    with open('datingTestSet2.txt') as f:
        lines = f.readlines()
    array_num = len(lines)
    # 创建训练矩阵(包含3个特征)及类别列表
    trained_mat = np.zeros((array_num, 3))
    class_list = []
    for index, line in enumerate(lines):
        # 去换行,以制表符为分界
        line = line.strip().split('\t')
        # 整行添加、将最后一个添加到类别列表
        trained_mat[index, :] = line[:3]
        class_list.append(int(line.pop()))
    return trained_mat, class_list


def mat2norm(trained_mat):
    # 各列的最大最小值,及范围
    max_values = trained_mat.max(axis=0)
    min_values = trained_mat.min(axis=0)
    ranges = max_values - min_values
    # 分子,分母
    diff_min_mat = trained_mat - np.tile(min_values, (trained_mat.shape[0], 1))
    range_mat = np.tile(ranges, (trained_mat.shape[0], 1))
    # 归一化矩阵
    norm_mat = diff_min_mat / range_mat
    return norm_mat, ranges, min_values


def classify(input_vector, trained_mat, class_list, k=3):
    # 欧式距离计算
    rows = trained_mat.shape[0]
    input_mat = np.tile(input_vector, (rows, 1))
    diff_mat = input_mat - trained_mat
    squ_mat = diff_mat ** 2
    sum_mat = squ_mat.sum(axis=1)
    d = sum_mat ** 0.5
    # 根据距离排序,获得排序后的索引
    sorted_d = d.argsort()
    # 创建用来统计某一类标签的字典
    class_count = {}
    for i in xrange(k):
        class_label = class_list[sorted_d[i]]
        class_count[class_label] = class_count.get(class_label, 0) + 1
    # 根据统计得到的类别数量,进行排序,返回一个包含元组的列表,[(),(),...()]
    sorted_class = sorted(class_count.iteritems(), key=operator.itemgetter(1), reverse=True)
    return sorted_class[0][0]


def error_rate_test():
    trained_mat, class_list = file2mat()
    norm_mat, ranges, min_values = mat2norm(trained_mat)
    rows = norm_mat.shape[0]
    # 用前10%的数据作为测试样本
    test_num = int(0.1 * rows)
    error_count = 0.0
    for i in xrange(test_num):
        # 后90%的数据作为训练样本
        classify_result = classify(norm_mat[i], norm_mat[test_num:], class_list[test_num:], 3)
        print "The classify result:%d\tThe real value:%d\n" % (classify_result, class_list[i])
        if classify_result != class_list[i]:
            error_count += 1.0
    print "The error rate:%.2f" % (error_count / float(test_num))


def classify_person(trained_mat, class_list):
    result_list = ['ignore', 'like', 'crazy']
    # 键盘输入3个分量
    file_miles = float(raw_input("Frequent flier miles earned per year:"))
    video_games = float(raw_input("Percentage of time spent on video games:"))
    ice_cream = float(raw_input("Liters of ice consumed per week:"))
    input_vector = np.array([file_miles, video_games, ice_cream])
    # 归一化
    norm_mat, ranges, min_values = mat2norm(trained_mat)
    # 数量向量也需要归一化,通过(x-min)/(max-min)
    classify_result = classify((input_vector - min_values) / ranges, norm_mat, class_list, 3)
    print "Your attitude to the person maybe:", result_list[classify_result - 1]


def show(trained_mat, class_list):
    fig = plt.figure()
    ax = fig.add_subplot(111)
    ax.scatter(trained_mat[:, 0], trained_mat[:, 1],
               s=15 * np.array(class_list), c=np.array(class_list), alpha=0.5, edgecolors='face')
    plt.xlabel('Fly miles per year(mile)')
    plt.ylabel('Time spent on video games per week(%)')
    plt.show()


def main():
    # 从文本中获得数据
    trained_mat, class_list = file2mat()
    # 散点图显示原始数据
    show(trained_mat, class_list)
    # 预测
    classify_person(trained_mat, class_list)

if __name__ == '__main__':
    main()
三、结果分析
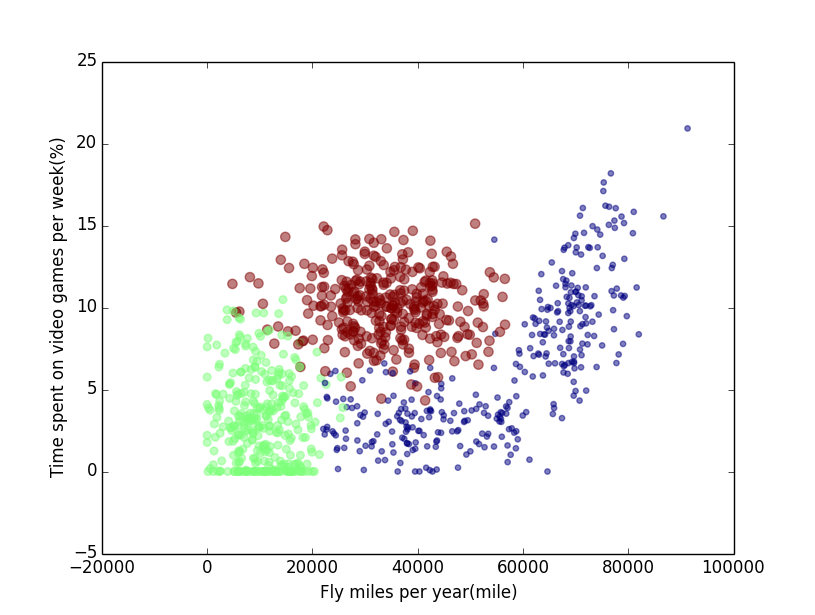
1.输入数据散点图
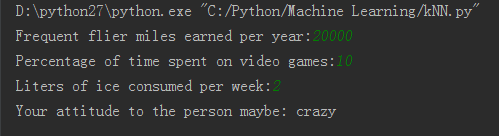
2.实际输出预测情况
3.用前10%样本作为测试样本,后90%作为训练样本,得到的误差率为5%左右。


 1148
1148

 被折叠的 条评论
为什么被折叠?
被折叠的 条评论
为什么被折叠?
 到【灌水乐园】发言


