


1. 前言
Markdown是一种轻量级的标记语言,把作者从繁杂的排版工作中解放出来,实现易读易写的文章写作,已经逐渐成为事实上的行业标准。CSDN博客支持Markdown可以让广大博友更加专注于博客内容,大赞。但是,不少博友可能对Markdown比较生疏,本博接下来用一个系列文章《Markdown简明教程》扼要介绍Markdown,希望可以对大家有所帮助。
系列教程目录
- 关于Markdown
- Markdown基本使用
- Markdown表格和公式
- Markdown UML图
- CSDN Markdown快速上手
- Markdown 参考手册
本文为《Markdown简明教程》系列教程的第4篇Markdown UML图,主要讲解Markdown序列图、流程图等, 顺便为介绍了无需任何插件的在线绘制UML的Gravizo。
2. 序列图
2.1 序列图示例
基于js-sequence-diagrams实现了序列图,使用下列的格式声明一个序列图:
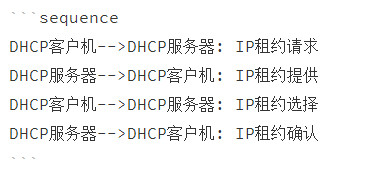
在网页上解析结果为:
注意:所有的序列图代码需要放在一个语法类型为sequence的代码块中。如下面代码所示。

2.2 序列图语法
序列图的语法如下图所示。
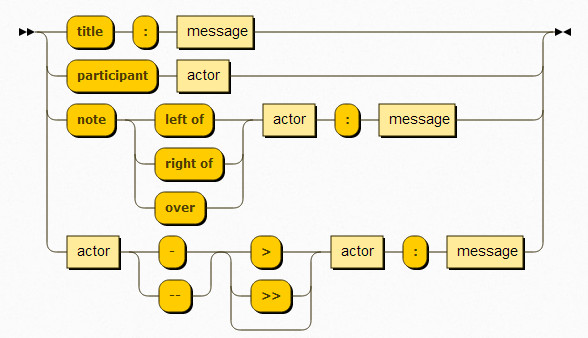
具体来说:
- 设置title,采用title: message。
- 1
将编译为:
- 设置participant,采用participant: actor
- 1
- 2
将编译为:
- 设置note,
- 左侧note: note left of acotor: message
- 右侧note: note right of actor: message,
- 覆盖note: note over actor:message
- 1
- 2
- 3
- 4
- 5
将编译为:
- 设置会话,
- 实线实箭头: actor->actor: message
- 虚线实箭头: actor–>actor:message
- 实线虚箭头: actor->>actor:message
- 虚线虚箭头: actor–>>actor:message
- 1
- 2
- 3
- 4
- 5
将编译为:
下面的案例演示了序列图语法的混合使用,参见代码:
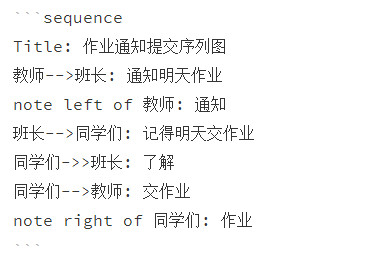
在网页上解析之后结果为:
3. 流程图
3.1 流程图示例
CSDN Markdown基于flowchart.js实现流程图。一个简单的流程格式如下代码所示:
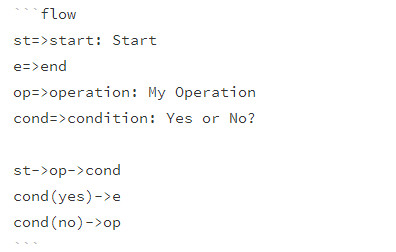
编译之后结果为:
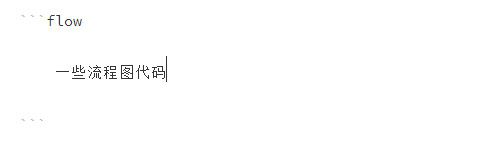
注意:所有的流程图代码需要放在一个语法类型为flow的代码块中。如下面代码所示。
3.2 流程图语法
流程图绘制包括两部分:节点定义和节点连接。
1. 节点定义
格式如下:
- 1
- 节点名称可随意起,甚至支持中文。提示文本可以为英文,可以为中文,也可以为空使用默认值。例如:
- 1
- 2
- 3
- 4
- 5
- 6
- 7
- 节点类型有start、operation、condition、end等,如下图所示。
- 1
- 2
- 3
- 4
- 5
2. 节点连接
格式如下
- 1
- 2
- 3
- 4
- 5
如下面代码所示:
- 1
- 2
- 3
- 4
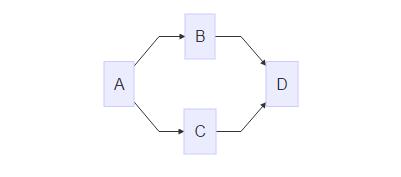
编译之后结果为
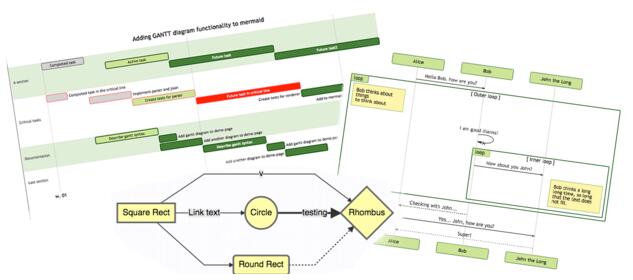
接下来做一个复杂的案例,如下图所示,请大家思考如何实现。
列出源代码供大家参考。
- 1
- 2
- 3
- 4
- 5
- 6
- 7
- 8
- 9
- 10
- 11
- 12
- 13
- 14
- 15
- 16
- 17
4. Gravizo
在研究Markdown UML图的时候,找到了不少在线绘制UML图的方式,例如Dot、PlantUML和UMLGraph等方式,并且发现了一个不用使用任何插件就可调用图片的方式-Gravizo。
例如,我们可以使用PlantUML的方式绘制一个用例图,代码如下。
 。
。
- 1
- 2
- 3
- 4
- 5
- 6
- 7
- 8
- 9
- 10
- 11
- 12
然后,我们就可以使用下面代码调用该图片:
- 1
- 2
- 3
- 4
- 5
- 6
- 7
- 8
- 9
- 10
- 11
- 12
- 13
- 14
本文为《Markdown简明教程》系列教程的第4篇Markdown UML图,主要讲解Markdown序列图、流程图等, 顺便为介绍了无需任何插件的在线绘制UML的Gravizo。下一篇文章我们来研读CSDN Markdown的一些特性。
mermaid简介
当撰写文档的时候,对于流程图的生成大多使用Visio等繁重的工具,没有一种轻便的工具能够画图从而简化文档的编写,就像markdown那样。
mermaid解决这个痛点,这是一个类似markdown语法的脚本语言,通过JavaScript实现图表的生成。
先来看个例子:
1.流程图(flowchart)
- 1
- 2
- 3
- 4
- 5
- 1
- 2
- 3
- 4
- 5
生成的图表如下所示:
2. 时序图(sequence diagram)
- 1
- 2
- 3
- 4
- 5
- 6
- 7
- 8
- 9
- 10
- 11
- 1
- 2
- 3
- 4
- 5
- 6
- 7
- 8
- 9
- 10
- 11
生成的图表如下所示:
3.甘特图(gantt diagram)
- 1
- 2
- 3
- 4
- 5
- 6
- 7
- 8
- 9
- 10
- 11
- 12
- 13
- 14
- 15
- 1
- 2
- 3
- 4
- 5
- 6
- 7
- 8
- 9
- 10
- 11
- 12
- 13
- 14
- 15
生成的表如下:
下游项目
Mermaid 是由Knut Sveidqbist发起旨在轻便化的文档撰写。所有开发者:开发者列表
- Gitbook-plugin
- Light table
- Confluence plugin
- Using mermaid via docpad
- Using mermaid in Jekvll
- Using mermaid via Octopress
- Mardown editor Haroopad
- Plugin for atom
- Markdown Plus
- LightPaper 1.2+
- Vim Plugin
以上的这些都有集成mermaid或者开发相关的插件。
Graph
- 1
- 2
- 1
- 2

这是申明一个由左到右,水平向右的图。\
可能方向有:
- TB - top bottom
- BT - bottom top
- RL - right left
- LR - left right
- TD - same as TB
节点与形状
默认节点
graph LR
id1

注意:’id’显示在节点内部。
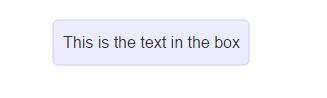
文本节点

- 1
- 2
- 1
- 2
圆角节点
- 1
- 2
- 1
- 2
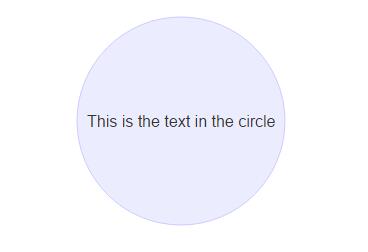
圆节点(The form of a circle)
- 1
- 2
- 1
- 2
非对称节点(asymetric shape)

- 1
- 2
- 1
- 2
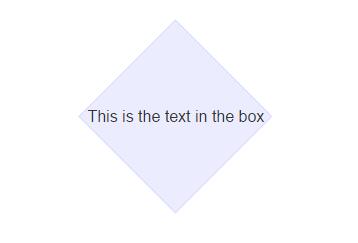
菱形节点(rhombus)
- 1
- 2
- 1
- 2
连接线
节点间的连接线有多种形状,而且可以在连接线中加入标签:
箭头形连接
- 1
- 2
- 1
- 2
开放行连接
- 1
- 2
- 1
- 2
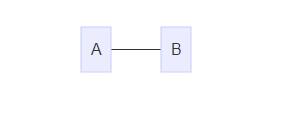
标签连接
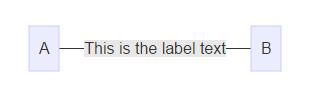
- 1
- 2
- 1
- 2
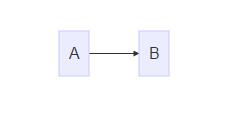
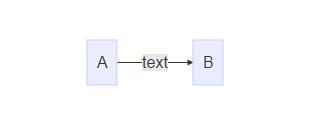
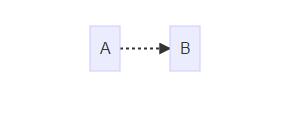
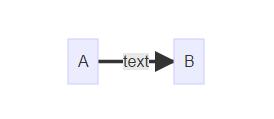
箭头标签连接
A–>|text|B\
或者\
A– text –>B
- 1
- 2
- 1
- 2
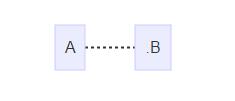
虚线(dotted link,点连线)
-.->
- 1
- 2
- 1
- 2
-.-.
- 1
- 2
- 1
- 2
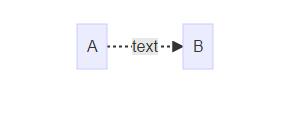
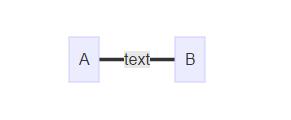
标签虚线
-.text.->
- 1
- 2
- 1
- 2
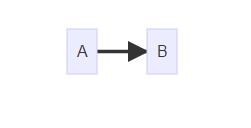
粗实线
==>
- 1
- 2
- 1
- 2
===
- 1
- 2
- 1
- 2

标签粗线
=\=text\==>
- 1
- 2
- 1
- 2
=\=text\===
- 1
- 2
- 1
- 2
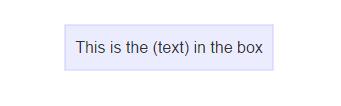
特殊的语法
使用引号可以抑制一些特殊的字符的使用,可以避免一些不必要的麻烦。
graph LR\
d1[“This is the (text) in the box”]
- 1
- 2
- 1
- 2
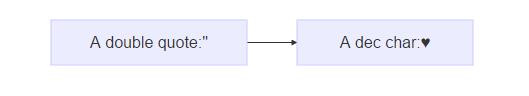
html字符的转义字符
转义字符的使用语法:
流程图定义如下:
graph LR\
A[“A double quote:#quot;”] –> B[“A dec char:#9829;”]
渲染后的图如下:
- 1
- 2
- 1
- 2
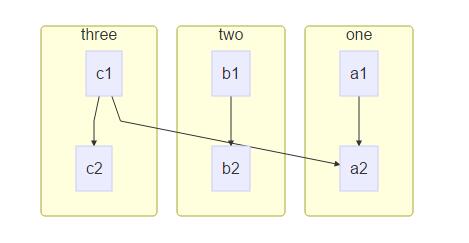
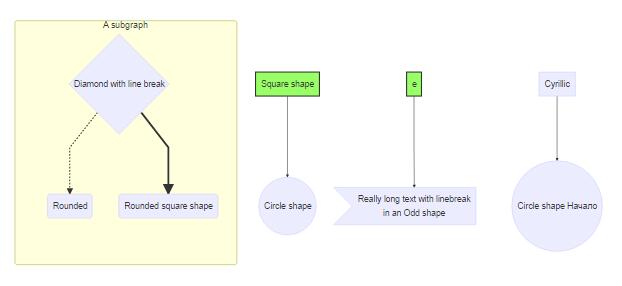
子图(Subgraphs)
subgraph title\
graph definition\
end
示例:
- 1
- 2
- 3
- 4
- 5
- 6
- 7
- 8
- 9
- 10
- 11
- 1
- 2
- 3
- 4
- 5
- 6
- 7
- 8
- 9
- 10
- 11
结果:
基础fontawesome支持
如果想加入来自frontawesome的图表字体,需要像frontawesome网站上那样引用的那样。\
详情请点击:fontawdsome
引用的语法为:++fa:#icon class name#++
- 1
- 2
- 3
- 4
- 5
- 1
- 2
- 3
- 4
- 5
渲染图如下:
- 1
- 2
- 3
- 4
- 5
- 1
- 2
- 3
- 4
- 5
以上reference:
1.mermaid docs
第二部分—图表(graph)
定义连接线的样式
- 1
- 2
- 3
- 4
- 1
- 2
- 3
- 4
渲染结果:

- 1
- 2
- 3
- 4
- 1
- 2
- 3
- 4
备注:这些样式参考CSS样式。
样式类
为了方便样式的使用,可以定义类来使用样式
类的定义示例:
- 1
- 1
对节点使用样式类:
- 1
- 1
同时对多个节点使用相同的样式类:
- 1
- 1
可以在CSS中提前定义样式类,应用在图表的定义中。
- 1
- 2
- 3
- 4
- 1
- 2
- 3
- 4
默认样式类:\
当没有指定样式的时候,默认采用。
- 1
- 1
示例:
- 1
- 2
- 3
- 1
- 2
- 3
结果:
- 1
- 2
- 3
- 1
- 2
- 3

序列图(sequence diagram)1
示例:
- 1
- 2
- 3
- 4
- 5
- 1
- 2
- 3
- 4
- 5
- 1
- 2
- 3
- 4
- 5
- 1
- 2
- 3
- 4
- 5
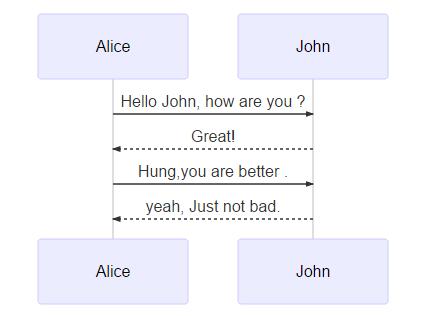
观察上面的图,如果想让John出现在前面,如何控制,mermaid通过设定参与者(participants)的顺序控制二者的顺序。上面的图可以做如下修改:
sequenceDiagram\
participant John\
participant Alice\
Alice->>John:Hello John,how are you?\
John–>>Alice:Great!
- 1
- 2
- 3
- 4
- 5
- 1
- 2
- 3
- 4
- 5
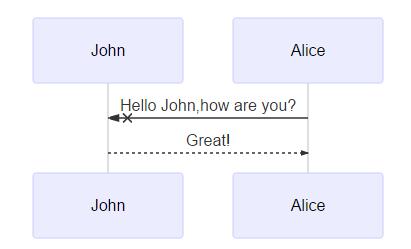
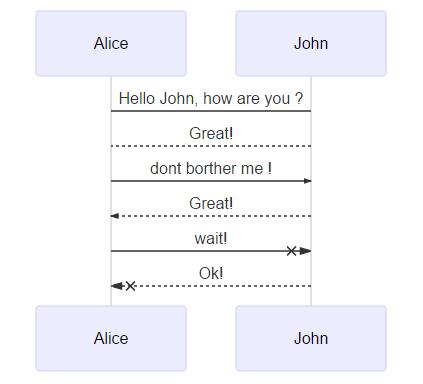
消息的语法:
实线或者虚线的使用:
[Actor][Arrow][Actor]:Message text\
Arrow的六种样式:
- ->
- –>
- ->>
- –>>
- -x
- –x
示例:
- 1
- 2
- 3
- 4
- 5
- 6
- 7
- 1
- 2
- 3
- 4
- 5
- 6
- 7
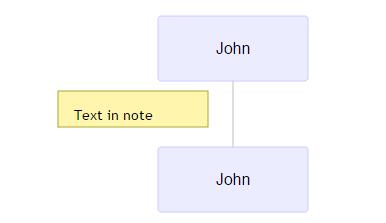
便签
给序列图增加便签:\
具体规则:\
[right of | left of | over][Actor]:Text\
示例:
- 1
- 2
- 3
- 1
- 2
- 3
结果:
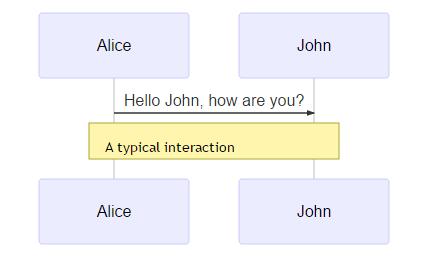
跨越两个Actor的便签:
- 1
- 2
- 3
- 1
- 2
- 3
- 1
- 2
- 3
- 1
- 2
- 3
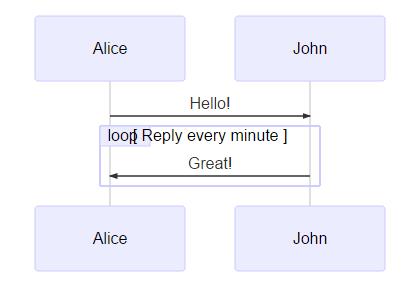
循环Loops
在序列图中,也可以使用循环,具体规则如下:
- 1
- 2
- 3
- 1
- 2
- 3
示例:
- 1
- 2
- 3
- 4
- 5
- 1
- 2
- 3
- 4
- 5
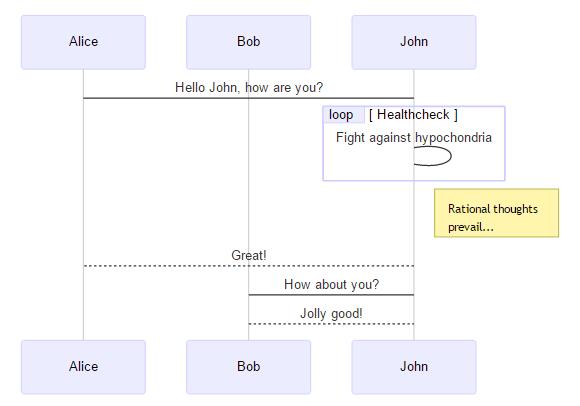
渲染结果:
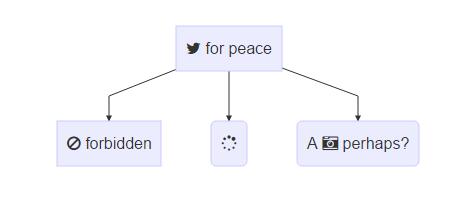
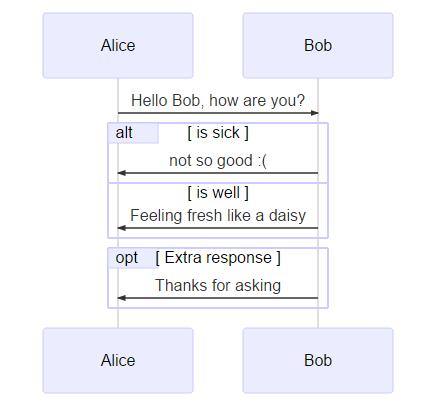
选择ALT
在序列图中选择的表达。规则如下:
- 1
- 2
- 3
- 4
- 5
- 1
- 2
- 3
- 4
- 5
或者使用opt(推荐在没有else的情况下使用)
- 1
- 2
- 3
- 1
- 2
- 3
示例:
- 1
- 2
- 3
- 4
- 5
- 6
- 7
- 8
- 9
- 10
- 1
- 2
- 3
- 4
- 5
- 6
- 7
- 8
- 9
- 10
渲染结果如下:
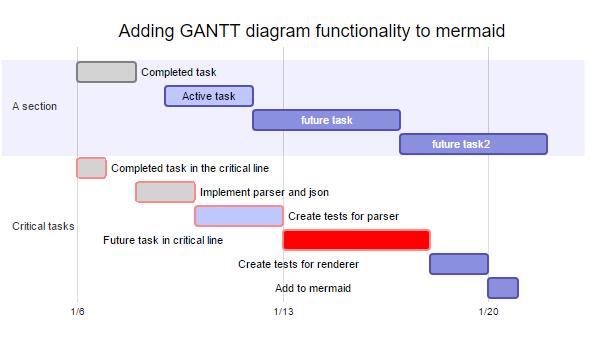
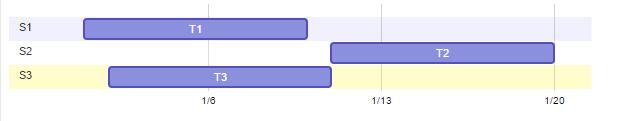
甘特图(gantt)2
甘特图是一类条形图,由Karol Adamiechi在1896年提出, 而在1910年Henry Gantt也独立的提出了此种图形表示。通常用在对项目终端元素和总结元素的开始及完成时间进行的描述。
示例:
- 1
- 2
- 3
- 4
- 5
- 6
- 7
- 8
- 9
- 10
- 11
- 1
- 2
- 3
- 4
- 5
- 6
- 7
- 8
- 9
- 10
- 11
- 1
- 2
- 3
- 4
- 5
- 6
- 7
- 8
- 1
- 2
- 3
- 4
- 5
- 6
- 7
- 8
先来看一个大的例子:
- 1
- 2
- 3
- 4
- 5
- 6
- 7
- 8
- 9
- 10
- 11
- 12
- 13
- 14
- 15
- 16
- 17
- 18
- 19
- 20
- 21
- 22
- 23
- 24
- 25
- 26
- 27
- 1
- 2
- 3
- 4
- 5
- 6
- 7
- 8
- 9
- 10
- 11
- 12
- 13
- 14
- 15
- 16
- 17
- 18
- 19
- 20
- 21
- 22
- 23
- 24
- 25
- 26
- 27
获得的图渲染后如下:
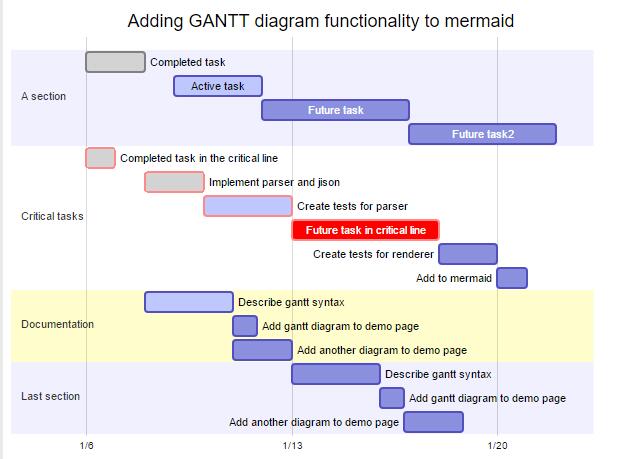
| header 1 | header 2 |
|---|---|
| title | 标题 |
| dateFormat | 日期格式 |
| section | 模块 |
| Completed | 已经完成 |
| Active | 当前正在进行 |
| Future | 后续待处理 |
| crit | 关键阶段 |
| 日期缺失 | 默认从上一项完成后 |
关于日期的格式可以参考:
- string-format
- Time-Formatting
Demo
- 1
- 2
- 3
- 4
- 5
- 6
- 7
- 8
- 9
- 10
- 11
- 12
- 13
- 14
- 15
- 16
- 1
- 2
- 3
- 4
- 5
- 6
- 7
- 8
- 9
- 10
- 11
- 12
- 13
- 14
- 15
- 16


 2万+
2万+

 被折叠的 条评论
为什么被折叠?
被折叠的 条评论
为什么被折叠?
 到【灌水乐园】发言


