


Level 2 Autonomous Driving on a Single Device: Diving into the Devils of Openpilot
单一设备上的 2 级自动驾驶:深入探究 Openpilot 的奥秘
Abstract
Equipped with a wide span of sensors, predominant autonomous driving solutions are becoming more modular-oriented for safe system design. Though these sensors have laid a solid foundation, most massive-production solutions up to date still fall into Level 2 (L2, Partial Driving Automation) phase. Among these, Comma.ai comes to our sight, claiming one $999 aftermarket device mounted with a single camera and board inside owns the ability to handle L2 scenarios. Together with open-sourced software of the entire system released by Comma.ai, the project is named Openpilot. Is it possible? If so, how is it made possible? With curiosity in mind, we deep-dive into Openpilot and conclude that its key to success is the end-to-end system design instead of a conventional modular framework. The model inside Openpilot is briefed as Supercombo, and it can predict the ego vehicle’s future trajectory and other road semantics on the fly from monocular input. Unfortunately, the training process and massive amount of data to make all these work are not available to the public. To achieve an intensive investigation, we try to reimplement the training details and test the pipeline on public benchmarks. The refactored network proposed in this work is referred to as OP-Deepdive. For a fair comparison of our version to the original Supercombo, we introduce a dual-model deployment scheme to test the driving performance in the real world. Experimental results of OP-Deepdive on nuScenes, Comma2k19, CARLA, and in-house realistic scenarios (collected in Shanghai) verify that a low-cost device can indeed achieve most L2 functionalities and be on par with the original Supercombo model. In this report, we would like to share the audience with our latest findings, shed some light on the new perspective of end-to-end autonomous driving from an industrial product-level side, and potentially inspire the community to continue improving the performance based on the environments provided in this work. Our code, datasets, benchmarks are available at https://github.com/OpenPerceptionX/Openpilot-Deepdive.
配备有广泛的传感器,主导的自动驾驶解决方案正变得更加模块化,以实现安全系统设计。尽管这些传感器为技术发展奠定了坚实的基础,但迄今为止,大多数大规模生产的解决方案仍处于部分驾驶自动化(L2级别)阶段。其中,Comma.ai引起了我们的注意,他们宣称一款售价999美元的售后设备,内置单摄像头和控制板,能够处理L2级别的场景。Comma.ai发布的整个系统的开源软件项目名为Openpilot。这是否可行?如果是,它是如何实现的?带着好奇心,我们深入探究了Openpilot,并得出结论,其成功的关键在于端到端的系统设计,而不是传统的模块化框架。Openpilot内部的模型被称为Supercombo,它能够即时从单目视觉输入预测自车的未来轨迹和其他道路语义。不幸的是,使这一切成为可能的训练过程和大量数据并未公开。为了进行深入的研究,我们尝试重新实现训练细节,并在公共基准测试上测试这一流程。本研究中提出的重构网络被称为OP-Deepdive。为了与原始Supercombo进行公平比较,我们引入了双模型部署方案,以测试在现实世界中的驾驶性能。OP-Deepdive在nuScenes、Comma2k19、CARLA以及我们自己收集的上海真实场景上的实验结果证实,低成本设备确实能够实现大部分L2功能,并与原始Supercombo模型相媲美。在这份报告中,我们希望与大家分享我们的最新发现,从工业产品级的角度为端到端自动驾驶的新视角提供一些启示,并可能激发社区继续基于本工作提供的环境来提高性能。我们的代码、数据集、基准测试可在https://github.com/OpenPerceptionX/Openpilot-Deepdive获取。

1 Introduction
Autonomous driving has witnessed an explosion of solutions, whose capability and capacity never stop growing. On board with the latest technologies in hardware, a single consumer vehicle can feature the ability of performing 176 tera operations per second (teraOPs) [1]. It is over 10 billion times more than what the Apollo Guidance Computer can do, the one that took Apollo 11 and astronaut Armstrong to the moon. Such a big step for computational power enables autonomous vehicles to cope with the data generated from various kinds of complex sensors, including multi-view cameras, long-and-short-range radars, LiDARs, precise inertial measurement units, etc. A combination of the super-powered computational chip and sensors usually cost more than 10; 000 U.S. dollars.
自动驾驶领域见证了解决方案的爆炸性增长,其能力和容量从未停止增长。搭载最新硬件技术的单辆消费车辆可以每秒执行176万亿次操作(teraOPs)[1]。这比阿波罗11号和宇航员阿姆斯特朗登月时使用的阿波罗制导计算机的能力高出超过100亿倍。如此巨大的计算能力飞跃使自动驾驶车辆能够应对由各种复杂传感器生成的数据,包括多视角摄像头、长短期雷达、激光雷达、精确惯性测量单元等。超级计算芯片和传感器的组合通常成本超过10,000美元。
This appetite for expensive devices successfully drive many self-driving solutions, such as Tesla’s AutoPilot [2], Waymo’s Waymo One [3], General Motors’s Super Cruise [4], and Baidu’s Apollo Go [5]. Unfortunately, no matter how exquisitely automotive companies advertise, in the official documents, most massive-production products still belong to Level 2 (Partial Driving Automation) [6] driving performance. No one is confident enough to make any further claims beyond L2.
这种对昂贵设备的需求成功地推动了许多自动驾驶解决方案的发展,例如特斯拉的AutoPilot[2]、Waymo的Waymo One[3]、通用汽车的Super Cruise[4]以及百度的Apollo Go[5]。不幸的是,无论汽车公司的广告多么精美,在官方文件中,大多数大规模生产的产品仍然属于二级(部分驾驶自动化)[6]的驾驶性能。没有人有足够的信心做出超出L2的进一步声明。
However, on the way to commercializing autonomous driving techniques to customers in daily life, Comma.ai1 builds in their own fashion. Their aftermarket product as depicted in Fig. 1, Comma Two/Three, is claimed to have the ability of L2, with a single device that costs only $999. It is probably the most affordable device for autonomous driving in the market. Meant to be compatible with many different brands of vehicles, their software, Openpilot, is open-source and hosted on Github [7]. More surprisingly, in 2020, Consumer Reports recognized Comma Two as the best among 18 competitors in terms of overall rating2, beating competitors such as Tesla, Cadillac, Ford.
然而,在将自动驾驶技术商业化并提供给日常生活中的消费者的过程中,Comma.ai以他们自己的方式进行构建。如图1所示,他们的售后产品Comma Two/Three宣称具有L2级别的能力,仅用一个售价仅为999美元的设备。它可能是市场上最经济实惠的自动驾驶设备。该设备旨在与多种不同品牌的汽车兼容,他们的软件Openpilot是开源的,并托管在Github上[7]。更令人惊讶的是,在2020年,《消费者报告》将Comma Two评为18个竞争对手中整体评分最高的[2],击败了特斯拉、凯迪拉克、福特等竞争对手。

Wait, is it even possible? If so, how is it made possible? What kind of situations does it work in? To answer these questions, we exquisitely test the Comma device, and reimplement part of their systems from scratch. After several months of deepdive, we draw the conclusion that Openpilot is simple and yet effective, for it can work in many simple L2 situations. In this report, we would like to share the audience with our latest findings, and motivate the community to dive into the devils of Openpilot.
等等,这真的可能吗?如果是,它是如何实现的?它在哪些情况下有效?为了回答这些问题,我们精心测试了Comma设备,并从头重新实现了他们系统的一部分。经过几个月的深入研究,我们得出结论,Openpilot既简单又有效,因为它可以在许多简单的L2场景中工作。在这份报告中,我们希望与观众分享我们的最新发现,并激励社区深入研究Openpilot的细节。
In contrast to most traditional autonomous driving solutions where the perception, prediction, and planning units are modular-based, Openpilot adopts an end-to-end philosophy on a system-level design to predict the trajectory directly from the camera images. The differences are illustrated in Figure 2. This end-to-end network in Openpilot is named as Supercombo, and it is the main target that we would like to reimplement and discuss in this work.
与大多数传统的自动驾驶解决方案不同,这些方案通常将感知、预测和规划单元基于模块化设计,Openpilot则采用了一种端到端的系统级设计理念,直接从摄像头图像预测轨迹。这些差异在图2中进行了说明。Openpilot中的端到端网络被称为Supercombo,它也是我们希望在这项工作中重新实现和讨论的主要目标。

Although Openpilot is deemed as the first to apply the end-to-end spirit for massive consumer products in autonomous driving, there are many pioneering work in academia that try to achieve an end-to-end framework design without explicit perception modules [8, 9, 10, 11, 12]. These work motivate in sense that end-to-end design would leverage towards better feature representation via co-trained optimization and multi-task learning. Literature in academia achieve impressive results on simulation environments such as CARLA [13], the driving performance and safety guarantee when we transfer algorithms to realistic cases remain unclear, however.
尽管Openpilot被认为是在自动驾驶领域首次将端到端精神应用于大规模消费产品,但学术界有许多开创性的工作尝试在没有显式感知模块的情况下实现端到端框架设计[8, 9, 10, 11, 12]。这些工作在某种程度上激励了人们,认为端到端设计将通过协同优化和多任务学习,更好地利用特征表示。学术文献在CARLA等仿真环境中取得了令人印象深刻的结果[13],然而,当我们将算法转移到现实案例时,其驾驶性能和安全保障仍然不明确。
To this end, the importance of Openpilot lies in the product-level achievement of such an end-to-end design for the whole autonomous driving system, and it can satisfy basic L2 functionalities for daily scenes. The success of Openpilot would encourage more investigation both in academia and industry tryouts. Unfortunately, the training details as well as massive amount of data are not released to the public. We believe these are very crucial to achieve the L2 goal in an end-to-end spirit. This motivates us to build our own end-to-end model, namely OP-Deepdive, where we keep most of the pre-processes and post-processes consistent with Openpilot.
为了实现这一目标,Openpilot的重要性在于它在产品级别上实现了整个自动驾驶系统的端到端设计,并且能够满足日常场景中的基本L2功能。Openpilot的成功将鼓励学术界和工业界进行更多的研究和尝试。不幸的是,训练细节以及大量的数据并未向公众公开。我们相信这些对于以端到端精神实现L2目标至关重要。这激励我们构建我们自己的端到端模型,即OP-Deepdive,其中我们保持大部分预处理和后处理与Openpilot一致。
Extensive experiments on both public datasets and real-world scenarios are carried out to evaluate the refactored model performance. During the real-world test, we exquisitely analyze the underlying logic and propose a dual-model deployment framework to successfully run our own model on the device. Numeric results prove that both the original Supercombo and our reimplemented model OP-Deepdive can perform elegant on highway scenarios, but it does not hold true on street scenarios. In terms of quantitative metrics, our model is consistent with the original Openpilot model. The on-board performance test further demonstrates that Openpilot is suitable for closed roads (high-speed, ordinary roads, etc.), and is excellent for driving assistance system as in ADAS.
在公共数据集和现实世界场景上进行了大量的实验,以评估重构模型的性能。在现实世界的测试中,我们精心分析了底层逻辑,并提出了一个双模型部署框架,成功地在设备上运行了我们自己的模型。数值结果证明,原始的Supercombo和我们重新实现的模型OP-Deepdive在高速公路场景中都能表现出色,但在街道场景中情况并非如此。在定量指标方面,我们的模型与原始的Openpilot模型保持一致。车载性能测试进一步证明,Openpilot适用于封闭道路(高速公路、普通道路等),并且作为驾驶辅助系统(如ADAS)表现出色。
In this report, we first give an overview of the Openpilot system, and the test scenarios we use in Section 2. Then, we provide the details of our reimplementation version of OP-Deepdive in Section 3. The results, along with the comparison with the original model, are shown in Section 4. Further discussions are noted in Section 5. We summarize the contributions as follows:
在这份报告中,我们首先在第2节提供了Openpilot系统的概述以及我们使用的测试场景。接着,在第3节中,我们提供了我们重新实现的OP-Deepdive版本的详细信息。第4节展示了结果以及与原始模型的比较。进一步的讨论在第5节中记录。我们总结的贡献如下:
- We test the Openpilot system in real-world scenarios and conclude it can indeed achieve L2 autonomous driving on a single vision device.
- We revivify the training phase of Openpilot from scratch, design the network structure of Supercombo in Openpilot, and test our refactored model on public datasets. OP-Deepdive is comparable with the original one.
- . This technical report serves as a starting point for the research community to work on the end-to-end system design for the ultimate driving task of planning and control, in an industrial massive to-consumer product sense.
1.我们在现实世界场景中测试了Openpilot系统,并得出结论,它确实可以在单一视觉设备上实现L2级别的自动驾驶。
2.我们从头开始重新激活Openpilot的训练阶段,设计了Openpilot中Supercombo的网络结构,并在公共数据集上测试了我们重构的模型。OP-Deepdive与原始模型相当。
3.这份技术报告作为研究社区在最终驾驶任务的规划和控制方面的端到端系统设计的起点,从工业大规模到消费者产品的角度来看。
2 Preliminaries(准备工作)
2.1 Openpilot: An Overview
Openpilot is a relatively mature open-source project for L2 assisted driving systems introduced by Comma.ai, which implements conventional assisted driving functions including Adaptive Cruise Control (ACC), Automated Lane Centering (ALC), Forward Collision Warning (FCW) and Lane Keeping Assist (LKA) based on an end-to-end model named Supercombo. The user interface is shown in Figure 3. It has been made available to massive consumers, and is designed to be compatible with over 150 types of vehicles. Users can enjoy the experience of assisted driving by installing the aftermarket kit on their own car in a few steps.
Openpilot 是由 Comma.ai 推出的一个相对成熟的开源项目,用于 L2 级辅助驾驶系统。它实现了包括自适应巡航控制(ACC)、自动车道居中(ALC)、前碰撞预警(FCW) 和**车道保持辅助(LKA)**在内的传统辅助驾驶功能,这些功能基于一个名为 Supercombo 的端到端模型。图 3 显示了用户界面。该项目已经向广大消费者开放,并且设计上能够兼容超过 150 种车型。用户可以通过在他们的汽车上安装售后套件的几个简单步骤来体验辅助驾驶。

Openpilot mainly consists of two parts: software and hardware. The software part contains various algorithms and middleware. The hardware device, named EON, acts as the brain of a complete set of devices and is responsible for running the NEO system (a highly-customised Android system) and the software algorithms. The overall system architecture is shown in Figure 4. Different units on the EON device capture the corresponding environmental information, e.g., a camera takes the front image of the physical world and a car interface named Panda extracts the state of the vehicle from CAN Bus. The stock radar on the vehicle is also used in this step. Then, with these data, Openpilot runs the Supercombo model and validates its output by post-processing software and middleware. It finally sends control signals to the vehicle controller via Panda interface.
Openpilot 主要由两部分组成:软件和硬件。软件部分包含了各种算法和中间件。硬件设备被称为 EON,它作为整套设备的大脑,负责运行 NEO 系统(一个高度定制的 Android 系统)和软件算法。整体系统架构如 图 4 所示。EON 设备上不同的单元捕获相应的环境信息,例如,一个摄像头捕捉物理世界前方的图像,一个名为 Panda 的车载接口从 CAN 总线提取车辆的状态。车辆上的标准雷达也在这一步中使用。然后,使用这些数据,Openpilot 运行 Supercombo 模型,并通过后处理软件和中间件验证其输出。最后,它通过 Panda 接口将控制信号发送到车辆控制器。

We test the system in real world both qualitatively and quantitatively to disclose its strengths and shortcomings. We refer audience for detailed original system-level tests to Appendix. A and our webpage https://sites.google.com/view/openpilot-deepdive/home .
我们在现实世界中对系统进行了定性和定量的测试,以展现其长处和短处。我们建议读者查阅附录 A 中详细的原始系统级测试,并访问我们的网页 https://sites.google.com/view/openpilot-deepdive/home 以获取更多信息。
2.2 The Supercombo Model
The core of the whole system is the software algorithms running on the EON device, which are responsible for perception, planning, localization and control. Among these algorithms, the perceptual algorithm (i.e., the Supercombo model) is the key first step that worth digging into. It takes in the images from the camera, and predicts lanes, road edges, location and velocity of leading vehicles, and, most importantly, the trajectory that the ego agent should follow in the future. Hence, it’s also called a trajectory planning model. We give a simplified illustration of Supercombo in Figure 5. Specifically, the pipeline of the model execution includes the following parts.
整个系统的核心是 EON 设备上运行的软件算法,这些算法负责感知、规划、定位和控制。在这些算法中,感知算法(也就是 Supercombo 模型)是关键的第一步,值得我们深入探究。它接收摄像头捕捉的图像,预测车道、道路边缘、前车的位置和速度,以及最重要的,自车未来应该遵循的轨迹。因此,它也被称作轨迹规划模型。我们在图 5 中提供了 Supercombo 的简化图示。具体来说,模型执行的流程包括以下几个部分。

图 5 展示了 Supercombo 的工作流程。它接收两个连续的视频帧、一个向量来表示所需的高级指令,以及一个布尔值来指示是遵循右侧还是左侧的交通规则。最终的预测结果包括规划好的轨迹、自车的位置姿态、车道线、前车的状态等信息。
Preprocessing. First, the original single-frame 3-channel RGB image taken from the camera with size (3×256×512), is transformed into 6-channel YUV format with size (6×128×256). Then, the two consecutive frames is concatenated together as the model input, resulting in a (12 × 128 × 256) input size.
预处理阶段。起初,由摄像头捕获的原始单帧三通道 RGB 图像,尺寸为 (3×256×512),被转换成六通道 YUV 格式,尺寸变为 (6×128×256)。接着,将两个连续帧合并作为模型的输入,得到最终的输入尺寸为 (12 × 128 × 256)。
Main Network. The backbone network adopts Google’s Efficientnet-B2 [14], which boasts good performance yet high efficiency. It adopts the group convolution to reduce the amount of parameters in the backbone. In order to capture temporal information, a GRU (gated recurrent unit) is connected to the backbone network.
主网络部分。骨干网络使用了谷歌的 Efficientnet-B2 [14],该网络在保持高效性能的同时,还具有很高的效率。它通过使用组卷积技术来减少骨干网络中的参数数量。为了能够捕捉时间信息,骨干网络连接了一个 GRU(门控循环单元)。
Prediction Head. Several fully connected layers are attached to the GRU, acting as prediction heads. The output includes 5 possible trajectories, among which the one with the highest confidence is chosen as the planned trajectory. Each trajectory contains the coordinates of 33 3D points under ego vehicle’s coordinate system. Besides, the Supercombo also predicts lane lines, road edges, the position and velocity of leading objects, and some other information of the vehicle.
预测头。GRU 之后连接了几个全连接层,充当预测头。输出结果包括 5 条可能的轨迹,其中选择置信度最高的一条作为规划轨迹。每条轨迹都包含了在自车坐标系中定义的 33 个三维点的坐标。除此之外,Supercombo 还预测了车道线、道路边缘、前车的位置和速度,以及车辆的其他相关信息。
To note, although the network structure, along with the pre-and-post processing methods are opensource, the training pipeline and data remain internal. Therefore, we need to reimplement it from scratch. Also, as for the training data, Comma.ai claims that their Supercombo model is trained from a video collection of 1 million minutes of driving3. However, they only make a small segment of it available to the public.
需要指出的是,尽管网络架构以及预处理和后处理的方法是公开的,但训练流程和数据仍然是公司内部的。因此,我们需要从零开始重新实现它。同时,就训练数据而言,Comma.ai 表示他们的 Supercombo 模型是基于 1 百万分钟的驾驶视频集合进行训练的。但是,他们只公开了其中一小部分数据。
3 Method
In this section, we present an end-to-end trajectory planning model inspired by the Supercombo model, and a deployment framework based on EON device design, as summarized in Figure 6 and Figure 9.
在这一部分,我们提出了一个受 Supercombo 模型启发的端到端轨迹规划模型,并提出了一个基于 EON 设备设计的部署框架,如图 6 和图 9 所示。
3.1 An End-to-end Planning Model
Remember our aim is to reimplement the Supercombo model. Ideally, our model should have exactly the same structure as the Supercombo and require the same input and output format. Unfortunately, it is not feasible, for some data required for training is not easily accessible, such as the location and speed of the leading car. Therefore, we make some changes on the input and output format which do not have a significant impact on main conclusions we believe. As shown in Figure 6, the main structure of our reimplemented model is quite similar to the original Supercombo. It takes in two consecutive frames from the single, forward-facing camera, and directly predicts the future trajectory. The input frames go through the backbone and are flattened into a feature vector of length 1024. Then, the vector is fed into the GRU module of width 512, enabling the model to remember temporal information. Finally, several fully-connected layers organize the network output into the required format. More details are discussed below.
我们的目标是重新实现 Supercombo 模型。理想情况下,我们的模型应该与 Supercombo 模型具有完全相同的结构,并需要相同的输入和输出格式。然而,由于一些训练所需的数据,例如前车的位置和速度,不易获得,这使得完全复制变得不可行。因此,我们对输入和输出格式进行了一些不影响我们认为的主要结论的改动。如图 6 所示,我们重新实现的模型的主要结构与原始的 Supercombo 类似。它接收单个前向摄像头捕获的两个连续帧,并直接预测未来的轨迹。输入帧通过骨干网络处理,并被压缩成一个长度为 1024 的特征向量。接着,这个向量被送入宽度为 512 的 GRU 模块,使模型能够捕捉时间信息。最终,几个全连接层将网络的输出整理成所需的格式。更多细节将在下文中讨论。

Preprocessing - Perspective Transformation. Openpilot is designed to work with all kinds of vehicles. One direct problem is that different users may mount the device in different positions. This is also called mount bias. To eliminate it, it’s crucial to know how the cameras are mounted (i.e., the camera extrinsics). Openpilot requires the user to do a camera calibration process after installation, during which the driver should drive the vehicle manually along a long, straight road for a while and keep a relatively fixed speed. The camera extrinsics are derived then. Also, there is an online calibrating process that keeps running while the device is working, to keep the extrinsic parameters being updated in case of vibration originated from the suspension system. Once the extrinsics are known, we can do a simple image warping operation, to make the images look like the ones taken from a standard camera. This standard camera is also called the virtual camera in some materials. Figure 7 illustrates the result of perspective transformation along with the original image taken from the camera. We can clearly see that Openpilot only pays attention to a very narrow field, for most of the outliers areas in the image are cropped out. The images are resized to 128 × 256 in this step.
预处理阶段包括透视变换。Openpilot 设计用于与各类车辆配合使用。一个直接的挑战是,不同用户可能会将设备安装在不同的位置,这被称作安装偏差。为了消除这种偏差,了解摄像头的安装方式(即摄像头的外参)非常关键。Openpilot 要求用户在安装后进行摄像头校准,在此过程中,驾驶员需要手动驾驶车辆沿一条长直的道路行驶一段时间,并保持相对固定的车速。通过这个过程可以确定摄像头的外参。同时,还有一个在线校准过程在设备运行时持续进行,以确保外参参数能够适应悬挂系统引起的震动而进行更新。一旦确定了外参,我们就可以执行图像变形操作,使图像看起来像是从标准摄像头拍摄的。这个标准摄像头在某些文献中也被称作虚拟摄像头。图 7 展示了透视变换后的结果以及摄像头原始拍摄的图像。可以清楚地看到,Openpilot 只关注图像中非常狭窄的区域,因为图像中的大部分边缘区域都被裁切掉了。在这一步中,图像尺寸被调整为 128 × 256。

Preprocessing - Color Transformation. Openpilot directly reads raw images from the CMOS (complementary metal-oxide semiconductor, a kind of image sensors). To convert raw images into the commonly-used RGB-888 format, we need a debayering process, which will introduce extra overhead. Openpilot uses the YUV-422 format as the model input to reduce the overhead. However, as all public-available datasets already recognize RGB-888 as the default image format, it doesn’t make sense to convert them back into YUV-422. Therefore, we stick with RGB-888 format. In other words, the color transformation is omitted in our work.
预处理阶段包括颜色转换。Openpilot 直接读取来自 CMOS(互补金属氧化物半导体,一种图像传感器)的原始图像。为了将这些原始图像转换为常用的 RGB-888 格式,需要进行(debayering)处理,这会增加额外的处理负担。Openpilot 采用 YUV-422 格式作为模型的输入,以减少这种负担。但是,由于所有公开可用的数据集已经将 RGB-888 作为默认图像格式,将它们重新转换为 YUV-422 格式没有实际意义。因此,我们选择使用 RGB-888 格式。换句话说,在我们的工作中省略了颜色转换步骤。
Backbone. Openpilot adopts EfficientNet-B2 [14] as the backbone. It features accuracy and efficiency, thanks to the latest AutoML (auto machine learning) and model scaling technologies. It contains 9.2 million parameters, and requires 0.65 billion floating-point operations in one pass. In comparison, the commonly-used ResNet-50 [15] backbone contains 25 million parameters and requires 2.7 billion floating-point operations in one pass. Given an input tensor of shape (6; 128; 256), the backbone outputs a tensor of shape (1408; 4; 8). Then, a convolutional layer with 3 × 3 kernel reduces the number of channels to 32. Finally, the tensor of shape (32; 4; 8) is flattened into a feature vector of length 1024.
Openpilot 选择 EfficientNet-B2 [14] 作为其骨干网络。这个网络因其准确性和效率而受到青睐,这得益于最新的自动机器学习(AutoML)和模型缩放技术。EfficientNet-B2 包含 920 万个参数,在单次前向传播中需要进行 6.5 亿次浮点运算。与之相比,广泛使用的 ResNet-50 [15] 骨干网络拥有 2500 万个参数,在单次前向传播中需要进行 27 亿次浮点运算。输入张量的形状为 (6, 128, 256),经过骨干网络处理后,输出张量的形状变为 (1408, 4, 8)。接下来,一个具有 3 × 3 卷积核的卷积层将通道数降至 32。最终,形状为 (32, 4, 8) 的张量被展平成一个长度为 1024 的特征向量。
GRU Module. A GRU [16] module with width 512 is attached following the feature vector. The aim of using GRU here is to capture the temporal information.
在特征向量之后,我们连接了一个宽度为 512 的 GRU 模块。在这里使用 GRU 的目的是为了捕获时间序列数据中的动态信息。GRU 是一种特别适合于序列预测任务的循环神经网络单元,它能够记住重要的时间信息,并忽略不重要的变化,从而对时间序列进行有效的建模。通过将 GRU 应用于自动驾驶系统中,可以帮助模型理解连续帧之间的关系,进而预测车辆在未来应该遵循的轨迹。
Prediction Head. After the GRU module, a few fully-connected layers are responsible to organize the output dimension as required. The Supercombo model will produce a tensor of length 6609 as the final output, which is tremendous. The prediction includes planned trajectories, predicted lane lines, road edges, the position of leading vehicles, and some other information. However, as currently there is no such dataset that provides all these annotations, we only focus on the planned trajectories in our reimplementation. Let M be the number of possible trajectories. Each trajectory is consisted of the coordinate of N 3D points under ego vehicle coordinate system, and one number for confidence value. Then, the output dimension D is,
预测头,在 GRU 模块之后,一些全连接层负责将输出组织成所需的维度。Supercombo 模型将生成一个长度为 6609 的张量作为最终输出,这个数字相当庞大。预测内容包括规划的轨迹、预测的车道线、道路边缘、前车的位置以及其他一些信息。然而,由于目前还没有提供所有这些注释的数据集,我们在重新实现时只关注规划的轨迹。设 M 为可能的轨迹数量。每条轨迹由 N 个 3D 点的坐标组成,并且每个点都在自车坐标系中,还有一个表示置信度的数值。因此,输出维度 D 可以表示为:
D
=
M
×
(
3
N
+
1
)
D=M×(3N+1)
D=M×(3N+1) ------------------------------------------------------------------------------(1)
Typically, we have M = 5 and N = 33. Considering that the raw value of coordinates under international units is relatively large, we add an exponential function to all x coordinates and add a sinh function to all y coordinates. (Openpilot is never designed to work when reversing!)
通常,我们设定 M = 5(表示有 5 条可能的轨迹),N = 33(表示每条轨迹由 33 个 3D 点组成)。考虑到在国际单位制下坐标的原始值通常较大,我们对所有 x 坐标应用了指数函数,并对所有 y 坐标应用了双曲正弦(sinh)函数。这样的处理有助于将大范围的数值压缩到更小的数值范围内,同时保持数值的相对比例,这在神经网络的输出层是常见的做法。Openpilot 从未设计用于处理倒车的情况,这可能是为什么它没有包括处理 y 坐标负值的机制。
Loss. First, we consider the ground truth trajectory to be the one that human drivers actually drive. Then, we follow the informative Comma.ai’s blog 4 to use MTP (Multimodal Trajectory Prediction) loss [17], which includes a regression loss Lreg and a classification loss Lcls. The overall loss is depicted as,
损失函数。首先,我们认为真实轨迹是驾驶员实际驾驶的轨迹。然后,我们遵循 Comma.ai 富有启发性的博客文章 4,使用多模态轨迹预测(MTP)损失 [17],它包括一个回归损失
L
r
e
g
L_{reg}
Lreg 和一个分类损失
L
c
l
s
L_{cls}
Lcls 。总体损失函数表示为:

To be specific, we calculate the cosine similarity between the ground truth and the M predicted
trajectories. Denote P as the predicted trajectory with the highest similarity. Then we calculate the
regression loss, smooth-L1, between P and the ground truth. As for Lcls, we give P confidence 1,
while others are kept 0. The BCE (binary cross entropy) loss is adopted for the classification task.
This process is illustrated in Figure 8. The trajectory with the highest confidence is taken as the
prediction result during inference.
具体来说,我们计算真实轨迹与 M 条预测轨迹之间的余弦相似度。假设 P 是与真实轨迹相似度最高的预测轨迹。接着,我们计算 P 与真实轨迹之间的平滑 L1 回归损失。对于
L
c
l
s
L_{cls}
Lcls ,我们将 P 的置信度设置为 1,而其他轨迹的置信度保持为 0。在分类任务中,我们采用了二元交叉熵(BCE)损失。如图 8 所示,这一过程说明了如何进行损失计算。在推理阶段,我们选取置信度最高的轨迹作为最终的预测结果。

图 8 展示了多模态轨迹预测(MTP)损失的工作方式。在这种鸟瞰视图(BEV)中,粉红色矩形表示自车。真实轨迹用绿色表示。预测的轨迹用蓝色表示。显然,我们应该选择直线行驶的轨迹作为预测轨迹 P。
在这种情况下,选择与真实轨迹(绿色)最接近的预测轨迹(蓝色)作为 P 是合理的,因为它代表了模型预测中最准确的结果。在自动驾驶系统中,这样的选择有助于确保车辆沿着预期的安全路径行驶。
3.2 Deployment on Device
To further validate the performance on the real-world application, we explore an on-device deployment pipeline based on the existing Openpilot software and hardware system. Considering that our model only predicts the trajectory to follow, while the original Supercombo predicts some other information, we design a dual-model deployment scheme. In this scheme, both models are deployed on the board, and make prediction alternately. To be specific, we replace the trajectory predicted by the Supercombo with the one predicted by our model, and keep other information untouched. Since the device-side deployment is tightly coupled touch with the specific hardware platform, we carefully analyze the camera data stream of Openpilot and the rock-bottom model framework in detail. We then add the additional deployed model with the idea of modularity in mind. The overall model deployment framework is shown in Figure 9. The blue boxes are the part added by our model and replace the plan node in Supercombo.
为了在现实世界应用中进一步验证性能,我们基于现有的 Openpilot 软硬件系统,探索了一个设备上的部署流程。考虑到我们的模型仅预测要遵循的轨迹,而原始的 Supercombo 模型预测了其他一些信息,我们设计了一个双模型部署方案。在这个方案中,两个模型都被部署在设备上,并交替进行预测。具体来说,我们将我们的模型预测的轨迹替换 Supercombo 预测的轨迹,并保留其他信息不变。由于设备端的部署与特定的硬件平台紧密相关,我们详细分析了 Openpilot 的摄像头数据流和基础模型框架。然后,我们本着模块化的理念,增加了额外部署的模型。整体的模型部署框架在图 9 中展示。图中的蓝色框是我们模型添加的部分,它们替换了 Supercombo 中的规划节点。

图 9 展示了我们的双模型部署框架的流程。我们训练完成的模型首先在 CARLA 模拟器中进行测试验证,然后在部署到设备上之前转换成 DLC(可下载内容包)格式。两个模型同时运行,各自为最终的输出结果贡献了不同的部分。这种部署策略允许我们的模型专注于轨迹预测任务,同时保留原有系统中的其他功能和信息。
4 Experiments
4.1 Openpilot: A Real-world Test
In order to test the functions including ACC, ALC, LKA and DM (driver monitoring), we carefully design some test scenarios, study how it actually performs both qualitatively and quantitatively, and try to discover the failure cases.
为了测试包括自适应巡航控制(ACC)、自动车道居中(ALC)、车道保持辅助(LKA)和驾驶员监控(DM)在内的功能,我们精心设计了一些测试场景,研究它们在定性和定量上的实际表现,并尝试发现失败案例。
The main conclusions of our test are as follows. For details, please refer to the Appendix. A.
我们的测试得出的主要结论如下。如需了解更多细节,请参考附录 A。
- Openpilot is capable of running on closed roads (high-speed, ordinary roads, etc.), and can perform excellent driving assistance functions.
- It can not handle some complex urban roads such as two-way roads without lanes. In these cases, human intervention is required to avoid collision.
1.Openpilot 能够在封闭道路(如高速公路、普通道路等)上运行,并能提供出色的驾驶辅助功能。
2.它无法处理一些复杂的城市道路,例如没有车道线的双向道路。在这些情况下,需要人工干预以避免碰撞。
4.2 OP-Deepdive: Our Reimplementation of Supercombo(深入研究和重新实现 Supercombo 模型的工作)
4.2.1 Dataset
We train and evaluate our model on two datasets, nuScenes [18] and Comma2k19 [19]. Table 1 shows some key features of them.
我们在一个名为 nuScenes [18] 和另一个名为 Comma2k19 [19] 的两个数据集上训练和评估了我们的模型。表 1 展示了它们的一些关键特性。

nuScenes. nuScenes [18] is a public large-scale dataset for autonomous driving curated by Motional. It is multipurpose, supporting various kinds of tasks, like detection, tracking, prediction, and segmentation. It provides 12 raw frames per second, but, only 2 of them are aligned and can be used in our setting. We extract 556 minutes of valid video clips from it, and randomly split it into 80%=20% as the training set and validation set, respectively.
nuScenes [18] 是一个由 Motional 提供的公共大规模自动驾驶数据集。它用途广泛,能够支持包括检测、跟踪、预测和分割在内的各种任务。该数据集每秒提供 12 帧原始图像,但在我们的应用场景中,只有 2 帧是经过对齐的,可以被使用。我们从这个数据集中提取了 556 分钟的有效视频片段,并且随机地将其按照 80% 用于训练集,20% 用于验证集的比例进行了分割。
To cater for the relatively low 2 Hz frame rate, we make a change on the ground truth of the trajectory. Instead of 33, each ground truth trajectory only contains 10 points that record ego vehicle’s position in 5 seconds in the future.
为了应对相对较低的 2 Hz 帧率,我们对轨迹的真值(ground truth)做了一些调整。现在,每个真实轨迹只包含 10 个点,而不是 33 个点,这些点用于记录自车在未来 5 秒内的位置。这样的调整有助于模型在给定帧率下更有效地预测轨迹,同时减少计算负担。
Comma2k19. Comma2k19 [19] is a dataset of over 33 hours of commute in California’s 280 highway, presented by Comma.ai in 2018. This dataset was collected using their early products. We believe it’s a small subset of the training data on which Comma.ai train Supercombo, which is 1 million minutes as stated in their blog. Therefore, this dataset is ideal for training our model on. Again, we pick 80% as the training set, and the rest 20% as the validation set.
Comma2k19 [19] 是一个由 Comma.ai 在 2018 年发布的数据集,它包含了在加利福尼亚州 280 号高速公路上超过 33 小时的通勤数据。此数据集是通过使用他们早期的产品收集而来的。我们相信这是 Comma.ai 用来训练 Supercombo 模型的 1 百万分钟训练数据中的一小部分,正如他们在博客中提到的。因此,这个数据集对我们模型的训练来说是非常理想的。同样,我们将 80% 的数据用作训练集,剩下的 20% 用作验证集。
We align the ground truth with Openpilot for Comma2k19. Each ground truth trajectory contains 33 planned positions in 10 seconds in the future, under current ego vehicle’s coordinate system. The points are not uniformly distributed. Instead, they follow a mechanism called time-based anchor.
为了与 Openpilot 保持一致,我们对 Comma2k19 数据集的真实轨迹进行了对齐处理。在这个数据集中,每个真实轨迹包含了自车在未来 10 秒内的 33 个规划位置,这些位置都是根据当前自车的坐标系统来确定的。这些点的分布并不是均匀的,而是根据一个叫做时间基锚定(time-based anchor)的机制来安排的。这种机制可能意味着点的分布是根据时间间隔来确定的,而不是等间隔地分布在未来的时间线上。
At an indefinite time t = 0, the trajectory contains the locations that the car would appear in at some time T. T is exactly the time-based anchor. The values for T are fixed, chosen from the set {0., 0.00976562, 0.0390625, 0.08789062, 0.15625, 0.24414062, 0.3515625, 0.47851562, 0.625, 0.79101562, 0.9765625, 1.18164062, 1.40625, 1.65039062, 1.9140625, 2.19726562, 2.5, 2.82226562, 3.1640625, 3.52539062, 3.90625, 4.30664062, 4.7265625, 5.16601562, 5.625, 6.10351562, 6.6015625, 7.11914062, 7.65625, 8.21289062, 8.7890625, 9.38476562, 10.}. Note that they are not uniformly distributed between 0 and 10. Instead, they are dense in the near future and become sparse as the time goes, which suggests that the model should focus more on the near future. The coordinates are linearly interpolated from the 30 Hz data.
在不确定的时间点
t
=
0
t=0
t=0 ,轨迹包含了汽车在特定时间
T
T
T 会出现的位置。时间
T
T
T 是基于时间的锚点。
T
T
T 的值是固定的,并且从集合中选取,这个集合包括了从 0 开始到 10 秒之间:{0., 0.00976562, 0.0390625, 0.08789062, 0.15625, 0.24414062, 0.3515625, 0.47851562, 0.625, 0.79101562, 0.9765625, 1.18164062, 1.40625, 1.65039062, 1.9140625, 2.19726562, 2.5, 2.82226562, 3.1640625, 3.52539062, 3.90625, 4.30664062, 4.7265625, 5.16601562, 5.625, 6.10351562, 6.6015625, 7.11914062, 7.65625, 8.21289062, 8.7890625, 9.38476562, 10.},以非均匀方式分布的一系列时间点。这些时间点在近期未来比较密集,随着时间推移变得稀疏,这意味着模型应该更多地关注近期的预测。这些坐标是基于 30 Hz 采集的原始数据通过线性插值计算得出的。这种设计反映了对近期预测的更高关注度,因为近期预测对于自动驾驶系统的实时反应和安全性至关重要。
4.2.2 Metrics(指标)
We use two kinds of metrics to evaluate the methods, namely the imitation metrics and the comfort
metrics.
我们采用了两种不同的度量标准来评估方法:模仿度指标和舒适度指标。模仿度指标可能用于评估模型预测的轨迹与实际驾驶行为的相似度,而舒适度指标可能关注预测轨迹的平滑度和驾驶过程中的乘坐体验。这些指标共同帮助我们全面理解模型在自动驾驶任务中的表现。
Imitation Metrics. Imitation metrics are aimed to show how well a model learns from the human drivers. Inspired by the 3D detection metric used in KITTI detection challenge [20], we first divide the trajectory points to 5 groups according to the distances on x axis, that is, 0 ∼ 10, 10 ∼ 20, 20 ∼ 30, 30 ∼ 50 and 50+ meters. In each range, we calculate two metrics, the average Euclidean distance and average precision.
模仿度指标用于衡量模型模仿人类驾驶员行为的能力。受到 KITTI 检测挑战赛中使用的 3D 检测度量标准的启发,我们将轨迹点根据沿 x 轴的距离分为 5 个区间:0 到 10 米、10 到 20 米、20 到 30 米、30 到 50 米以及超过 50 米。在每个区间内,我们计算两个度量指标:平均欧氏距离和平均精度。这些指标帮助我们评估模型预测的轨迹与真实轨迹之间的接近程度和准确性。
• Average Euclidean Distance Error. As the name suggests, we calculate the Euclidean distances in 3D space between the corresponding predicted and ground truth points. Then, we average them. Besides, we also calculate the Euclidean distances when the points are projected onto x and y axis. The lower, the better. The unit is meter.
• Average Precision. If the distance between two corresponding points is smaller than a threshold, we mark it “Hit”. Otherwise, we mark it “Miss”. Then, we can calculate the hit rate, and average them. For example, AP@0.5 means the average hit rate under threshold 0.5. The higher the better.
• 平均欧氏距离误差:我们计算预测点与真实轨迹点在三维空间中的欧氏距离,并对这些距离取平均值。同时,我们也计算当这些点分别投影到 x 轴和 y 轴上时的欧氏距离。这个指标越低越好,单位是米。
• 平均精度:如果两个对应点的距离小于一个预设阈值,我们将其记录为“命中”。如果超出阈值,则记为“未命中”。之后,我们计算各阈值下的命中率,并求出平均值。例如,AP@0.5 表示在 0.5 米阈值下的命中率平均值。这个指标越高越好。
Comfort Metrics. Comfort metrics can reflect if a possible trajectory will make passengers feel comfortable. To be specific, we use jerk and lateral acceleration to measure comfort.
• Jerk. Jerk is the rate at which an object’s acceleration changes with respect to time. To note, since jerk is a directed quantity, we actually report the amplitude of it. The unit is m=s3. The lower, the better.
• Lateral Acceleration. Lateral acceleration is the acceleration which is transverse to the direction of travel of a car. Also, it’s a directed quantity, so we actually report its amplitude. The unit is m=s2. The lower, the better.
舒适度指标。舒适度指标可以反映一个可能的轨迹是否会让乘客感到舒适。具体来说,我们使用急加速(jerk)和侧向加速度(lateral acceleration)来衡量舒适度。
• 急加速(Jerk)。急加速是物体加速度随时间变化的速率。需要注意的是,由于急加速是一个有方向的量,我们实际上报告的是它的幅度。单位是米/秒³(
m
/
s
3
m/s^3
m/s3 )。数值越低表示乘坐体验越平稳,舒适度越高。
• 侧向加速度(Lateral Acceleration)。侧向加速度是垂直于汽车行驶方向的加速度。同样,它也是一个有方向的量,所以我们报告的是它的幅度。单位是米/秒²(
m
/
s
2
m/s^ 2
m/s2 )。数值越低表示车辆在转弯时乘客感受到的侧向力越小,舒适度越高。
4.2.3 Implementation Details
Our implementation is compatible with PyTorch [21] 1.8. By default, we use AdamW as the optimizer. The batch size and the learning rate are set to be 48 and 10−4, respectively. A gradient clip of value 1:0 is applied. During training, we use 8 NVIDIA V100 GPUs. Since there is a GRU module, we need to initialize its hidden state by filling zeros. The parameters are updated once every 40 steps,
我们的系统实现与 PyTorch 深度学习框架的 1.8 版本兼容。在默认设置中,我们选择 AdamW 作为优化算法。我们为训练过程设置了 batch 大小为 48,学习率为
1
0
−
4
10^{−4}
10−4 。此外,我们实施了梯度裁剪,其阈值设为 1.0,以避免训练过程中的梯度爆炸问题。在训练环节,我们动用了 8 块 NVIDIA V100 图形处理单元(GPU)以加速计算。考虑到模型中包含 GRU(门控循环单元)这一循环神经网络模块,我们通过将隐藏状态初始化为零来开始每个序列的训练。模型的参数每 40 个训练步骤更新一次。这样的设置有助于模型在处理时间序列数据时保持稳定性,并在多次迭代后有效地调整参数。

(a) 我们的 OP-Deepdive 模型的模仿度指标如下:
D.E.(欧氏距离误差):预测轨迹点与真实轨迹点之间的平均欧氏距离。
D
.
E
.
x
→
D.E.\overrightarrow{x}
D.E.x(x轴上的欧氏距离误差):当这些点投影到 x 轴上时的平均欧氏距离。
AP@0.5(0.5 米阈值下的平均精度):在距离阈值设定为 0.5 米时,预测点与真实点匹配的命中率平均值。命中率越高,表示模型的预测越准确。
其他指标可以根据上述解释进行推断,它们可能包括不同距离阈值下的平均精度,例如 AP@1.0 表示在 1.0 米阈值下的平均命中率等。
在累积梯度的步骤中,每 40 步进行一次参数更新。使用单个 NVIDIA GTX 1080 GPU,在 Comma2k19 数据集上完成 100 个训练周期大约需要 120 小时。此外,该网络在同一 GPU 上进行推理时,能够以每秒 100 帧的速度运行。这表明模型在保持较高精度的同时,也具有较快的处理速度,适合实时应用场景。
为什么前面用了8个V100训练,这里又改成1080Ti训练了???
4.2.4 Quantitative Results
On nuScenes Dataset. As each ground truth trajectory only lasts 5 seconds and most of the collection scenarios are in busy downtown, there are only a few samples that fall in the “50+ meter” range. Therefore, we do not report the results in that range.
在 nuScenes 数据集中,考虑到每个真实轨迹的持续时间仅为 5 秒,并且大部分场景收集自繁忙的城市中心区域,导致在 “50+ 米” 这个距离范围内的样本数量较少。因此,我们选择不报告该距离范围内的评估结果。这可能是因为较短的轨迹持续时间和复杂的市中心交通环境限制了模型在较长距离预测上的准确性和可靠性。
Table 2a shows the results of our reimplemented model on nuScenes dataset. To be honest, we fail to achieve a reasonable result, for the distance errors are large while the APs are low.
表 2a 展示了我们的 OP-Deepdive 模型在 nuScenes 数据集上的测试结果。老实说,我们的结果并不理想,距离误差偏大,同时平均精度(APs)也较低。这可能意味着模型在模仿真实轨迹方面存在一定的差距,需要进一步调整和优化。
Trying to understand the magic behind, we test the original Supercombo model on nuScenes dataset. As shown in Table 2b, the results are even worse. This is understandable, for the framerate in nuScenes is not 30 FPS. We further finetune the Supercombo model using our pipeline. As shown in Table 2c, it performs a bit better than our reimplementation. We conclude that on nuScenes dataset, better pre-trained weights can lead to a better performance, but the benefit is not significant.
为了理解为何结果不佳,我们在 nuScenes 数据集上对原始的 Supercombo 模型进行了测试。表 2b 显示,测试结果甚至比我们的模型更差。这种情况是可以理解的,因为 nuScenes 数据集的帧率并不是标准的 30 FPS。随后,我们使用我们的训练流程对 Supercombo 模型进行了进一步的微调。表 2c 展示的结果显示,微调后的模型性能略优于我们重新实现的模型。我们得出的结论是,在 nuScenes 数据集上,更好的预训练权重可能会导致性能上的提升,但这种提升并不是非常明显。这表明,尽管预训练模型权重对于模型性能有一定的影响,但可能还需要其他因素,如模型架构的调整或更精细的训练策略,来实现显著的性能提升。
Since it’s unreasonable to calculate the lateral acceleration and jerk based on such a low frame rate (2 Hz), we do not report comfort metrics on nuScenes dataset.
考虑到在如此低的帧率(2 Hz)基础上计算侧向加速度和急加速会导致不合理的结果,我们选择不针对 nuScenes 数据集提供舒适度指标的报告。低帧率可能会影响这些动态指标的准确性,因为它们需要足够频繁的样本来准确反映车辆在短时间内的运动变化。
On Comma2k19 Dataset. In terms of the imitation metrics, our model achieves very good results on Comma2k19 dataset. The original Supercombo model shows comparable results, as we can see in Table 3a and Table 3b. On average, our model performs better than the original Supercombo.
在 Comma2k19 数据集上,根据模仿度指标,我们的 OP-Deepdive 模型实现了非常优秀的结果。原始的 Supercombo 模型也展现出了相似的性能水平,这一点可以从表 3a 和表 3b 中观察到。总体而言,我们的模型在平均性能上超过了原始的 Supercombo 模型。这表明我们的重新实现的模型在模仿真实驾驶行为方面具有较高的准确性和可靠性。
Comma2k19数据集比较好,nuScenes数据集比较差,用数据集比较好的情况下,训练出的模型也更好,说明数据集的质量非常重要,但是前面也提到了nuScenes数据集采集的繁忙的城市道路,Comma2k19采集的是高速公路,显然高速公路的难度更低,可能这也是在Comma2k19上面表现更好的主要原因,可能是这个模型在处理复杂工况上还有些不足。
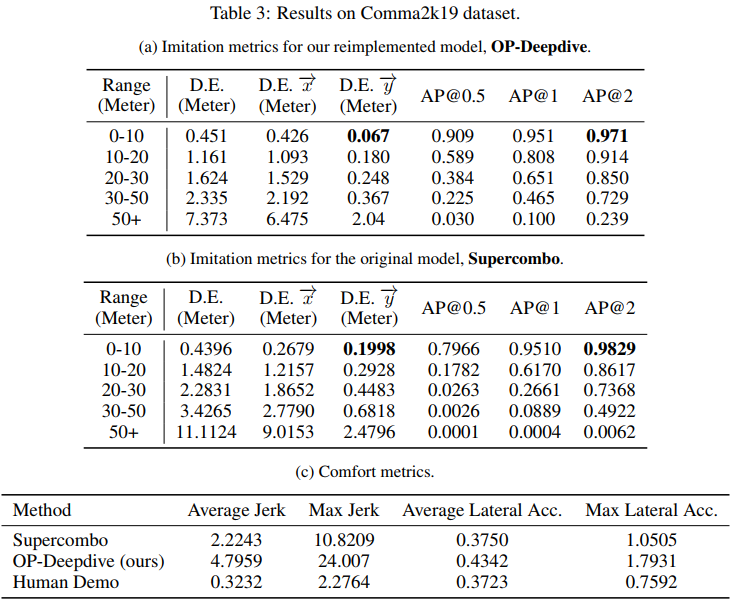
As for the comfort metrics, however, things become different. As Table 3c shows, the trajectories produced by our model feature higher jerks and lateral accelerations than the ones produced by the Supercombo. In the meantime, the trajectories from the human demo (i.e., the ground truth) show much lower jerks and lateral accelerations than both of the models. This suggests that the predicted trajectories are not smooth enough, compared with human drivers. However, this does not mean that Openpilot is not so good as a human driver, for the predicted trajectories require further processing before Openpilot sends commands to the car.
在舒适度指标方面,情况有所差异。表 3c 展示了我们的模型产生的轨迹比 Supercombo 产生的轨迹具有更高的急加速和侧向加速度。与此同时,人类演示(也就是真实轨迹)的轨迹在急加速和侧向加速度上都比两个模型的预测轨迹要低得多。这表明与人类驾驶员相比,我们的模型预测的轨迹平滑度不足。然而,这并不意味着 Openpilot 作为辅助驾驶系统的性能不如人类驾驶员,因为预测轨迹在 Openpilot 发出车辆控制指令前还需要经过更多的处理步骤。这意味着当前的模型可能在轨迹平滑度方面还有改进空间,以更接近人类驾驶员的平稳驾驶风格。
4.3 Dual-model Experiments
After we successfully reimplement the Supercombo model which achieves a reasonable performance on some public datasets, we would like to deploy it on the Comma Two board and see its real-world performance.
在成功地重新实现了 Supercombo 模型,并且在一些公共数据集上取得了合理的性能之后,我们计划将其部署到 Comma Two 设备上,并测试其在现实世界中的表现。这将是一个重要的步骤,以验证模型是否能够适应真实世界的复杂性和多变性。通过在 Comma Two 板上的部署,我们可以进一步评估模型的实用性和稳健性,并为未来的改进和优化收集宝贵的现场数据。
4.3.1 CARLA Simulation Test
We first test the dual-model framework in CARLA [13], an autonomous driving simulation platform. The main purpose of the simulation test is to verify whether the dual-model framework is logically correct before we perform a real on-board test. However, please kindly note that there are some gap between simulation and the real world.
我们首先在 CARLA [13] 这个自动驾驶模拟平台上对双模型部署框架进行测试。进行模拟测试的主要目的是为了在我们执行实际的车辆测试之前,确保双模型部署框架在逻辑上是正确的。不过,请注意,尽管模拟测试非常有用,但模拟环境与现实世界之间还是存在一些差异,这些差异可能会影响模型在真实环境中的表现。因此,模拟测试的结果将为我们提供一个初步的评估,但实际车载测试仍然是验证模型有效性的关键步骤。
• The source of data is different. The data stream in CARLA is rendered by the simulator. There is a certain domain gap between the rendered images and the real-world images.
• The hardware platform is different. The simulation is conducted on the PC, which has sufficient computing power. However, in the real-world test, the Comma Two board is based on the Qualcomm SOC platform, which has limited computing power and requires explicit neural network acceleration.
• The model format is different. The simulation platform adopts ONNX, which is a commonlyused model format, while the the Comma Two board requires DLC, a specific model format for Qualcomm mobile platforms.
• 数据来源差异:CARLA 中的数据流是由模拟器生成的。模拟器渲染的图像与现实世界捕获的图像在视觉和信息上存在差异,这可能导致模型在现实世界中的表现与模拟环境中有所不同。
• 硬件平台差异:模拟测试通常在计算能力较强的 PC 上进行。而在现实世界中,Comma Two 板基于高通系统级芯片(SOC)平台,其计算资源有限,可能需要特别的硬件加速来运行神经网络。
• 模型格式差异:在模拟环境中,可能使用 ONNX(开放神经网络交换)格式,这是一个广泛支持的模型格式,便于在不同平台间迁移和部署。相比之下,Comma Two 板需要 DLC(动态库)格式,这是专为高通等移动平台设计的特定模型格式,可能需要模型转换或优化以适应该硬件架构。
Figure 10a shows an example of the dual-model framework running in CARLA simulation. Note that the planned trajectory is from our reimplemented model while the lane lines are the original Supercombo model. The two models are running simultaneously.
图 10a 展示了在 CARLA 模拟环境中运行的双模型部署框架的实例。请注意,规划轨迹是由我们重新实现的模型生成的,而车道线则是由原始的 Supercombo 模型生成的。这两个模型是并行运行的。这种设置允许我们分别评估每个模型在特定任务上的性能,并且可以在不干扰其他系统组件的情况下集成新的模型。

We further compare the two model’s predicted trajectories in Figure 10b. Overall, the trajectories are close to each other. However, compared with the original Openpilot, the execution time and frame loss rate increase apparently. The reasons may include two aspects. Two models run simultaneously so that they occupy more hardware resources. In addition, they subscribe to the same data flow node, leading to the increase of the frame loss rate. It is reasonable to suspect that the problem may be further magnified when it is deployed on a mobile device.
在图 10b 中,我们进一步对比了两个模型所预测的轨迹。总体来看,这些轨迹相互之间非常接近。但是,与原始的 Openpilot 系统相比,执行时间和丢帧率都有所明显增加。这种情况的原因可能有两个方面:首先,两个模型同时运行,这意味着它们会占用更多的硬件资源;其次,它们订阅了相同的数据流节点,这可能导致丢帧率的增加。我们有理由怀疑,当这些模型部署在移动设备上时,由于计算资源和内存限制,这些问题可能会变得更加严重。
4.3.2 Real-world Test
After we verify the dual-model framework in simulation environment, we can finally deploy it on board. The board we use is Comma Two, and the vehicle is Lexus ES 2020. Figure 11a shows the result of our dual-model deployment framework. For safety concern, the software is running with the dubug mode on, where it makes predictions but does not control the vehicle. Overall, it is in line with expectations, which proves that our deployment scheme on a single device is effective. Similar to the previous section, we also show both trajectories in Figure 11b. It can be observed that the output curves are relatively consistent. We further analyze the running state of the two models on device. The running time and frame loss rate are higher than those in the simulation environment as expected. Due to the limited on-device computational power and bandwidth, frame loss and runtime will increase inevitably.
在模拟环境中验证了双模型框架之后,我们可以将其部署到 Comma Two 硬件板上。我们用于测试的车辆是 2020 年款的雷克萨斯 ES。图 11a 展示了我们双模型部署框架的运行结果。为了安全起见,软件在调试模式下运行,这意味着它能够进行预测但不会实际控制车辆。总体来看,结果符合我们的预期,这证明了我们的部署方案在单一设备上是可行的。和之前一样,我们在图 11b 中展示了两个模型预测的轨迹。可以看出,两个模型输出的曲线相对一致。我们进一步分析了设备上两个模型的运行状态。与模拟环境相比,运行时间和丢帧率都有所提高,这是我们预料之中的。由于设备上的计算能力和带宽有限,因此在实际部署时,丢帧和运行时间的增加是不可避免的。

5 Discussion
5.1 Open-loop v.s. Closed-loop System
In this paper, our model is trained and tested in an open-loop manner. Although the results seem acceptable, this manner has certain drawbacks.
在本文中,我们的模型采用了开环方式进行训练和测试。虽然结果看似令人满意,但这种开环方法确实存在一些固有的缺陷。开环控制方法意味着系统的输出不会反馈到输入中去影响模型的决策过程,这可能会导致模型无法适应实时变化和不确定性,从而影响其在复杂和动态环境中的性能。在自动驾驶和其他需要高度适应性和鲁棒性的领域,这些缺点尤其值得关注。
First, as Comma.ai has figured out5, the model just learns and predicts the human drivers’ most likely behaviour. In datasets collected from real world, the human drivers just keep the vehicle going straight in most of the time, and avoid any possible bad behaviours, such as dangerous driving and traffic offence. In this way, the model will not even have the chance to learn how to recover from mistakes. For example, if we manually feed a video sequence where the vehicle is going over the center line, which of course is a kind of dangerous driving, the model is likely to predict a trajectory that keeps going straight, instead of returning to the correct line.
首先,Comma.ai 已经意识到^5,模型只学习并预测人类驾驶员最有可能的行为。在现实世界中收集的数据集中,人类驾驶员大多数时间只是让车辆保持直线行驶,并避免任何可能的不良驾驶行为,比如危险驾驶和交通违规。在这种情况下,模型根本没有机会学习如何从错误中恢复。例如,如果我们人为地输入一个车辆正在越过中心线的视频序列,这无疑是一种危险驾驶行为,模型很可能会预测出一条继续直线行驶的轨迹,而不是纠正回到正确的车道。这意味着模型可能缺乏处理异常情况和从偏离状态中恢复的能力。
*5 https://blog.comma.ai/end-to-end-lateral-planning/
Second, we notice that it may introduce a kind of feature leakage. Under certain circumstances, if the vehicle is currently speeding up, the model will predict a longer and faster trajectory, vice versa. Also, if the vehicle is turning left or right, the model will predict a corresponding trajectory that turns left or right. This suggests that the model is learning from the drivers’ driving intentions rather than the road characteristics. A typical scenario that reveals this problem is starting-and-stop according to traffic lights. The model may decide to slow down long before it actually sees the red light or the stop line. Then, when the car is slowly starting to move before the red light turns green, the model may decide to speed up quickly. This makes us believe there is a certain kind of temporal feature leakage.
其次,我们发现这种方法可能会引起一种特征泄露问题。在特定情况下,如果车辆当前正在加速,模型往往会预测出一个更长且速度更快的轨迹;如果车辆正在减速,模型则预测出相反的轨迹。此外,如果车辆正在进行左转或右转,模型也会相应地预测出左转或右转的轨迹。这表明模型更多地是从驾驶员的驾驶意图中学习,而不是基于道路的实际特征。
一个典型的例子是红绿灯前的启停操作。模型可能会在实际看到红灯或停车线之前就决定减速。然后,当车辆在红灯变为绿灯之前开始缓慢移动时,模型可能会决定迅速加速。这种现象让我们认为模型可能在利用时间序列中的某些特征信息,这些信息可能并不完全是基于当前帧的观察结果,而可能涉及到对未来事件的预测,从而导致了特征泄露。
The barrier to closed-loop training and testing is that we simply cannot. Allowing a non-well-trained vehicle driving on the road based on its predicted trajectory is too dangerous and thus not practical. There are two solutions. The first one is introduced in Comma.ai’s blog. We can simulate closed-loop training and testing through the WARP mechanism, making the images collected from one perspective look like being collected from a different perspective. The second one is to train and test the model completely in a simulator. However, neither of the solutions are perfect, for the WARP mechanism will introduce image artifacts while the existing simulators [13] fail to render realistic images.
实现闭环训练和测试的难点在于我们根本无法承担这样的风险。让一辆未经充分训练的自动驾驶车辆根据其预测轨迹在真实道路上行驶是非常危险的,因此这种做法并不可行。为了解决这个问题,有两种可能的解决方案。第一种解决方案是 Comma.ai 在其博客中提到的,可以通过 WARP(Warping-Augmented Reality in Perspective)机制来模拟闭环训练和测试,该机制可以让从一个视角收集的图像看起来像是从另一个视角收集的。第二种解决方案是完全在模拟器中进行模型的训练和测试。然而,这两种方案都有其局限性:WARP 机制可能会在图像中引入失真或伪影,而现有的模拟器可能无法生成足够逼真的图像来模拟现实世界的复杂性。
这些挑战表明,在自动驾驶领域,实现安全有效的闭环控制系统仍然有很长的路要走,需要在模拟技术、数据收集方法和模型鲁棒性方面进行进一步的研究和创新。
5.2 Imitation Metric(模仿度指标)
Though we propose two imitation metrics (i.e., average Euclidean distance error and average precision) in this paper, we believe that the metrics for imitation learning, especially in the field of autonomous driving, remain open. There are two main factors to concern:
尽管在本文中我们提出了两种模仿度指标(即平均欧几里得距离误差和平均精度),但我们认为模仿学习,特别是在自动驾驶领域,其评估指标仍然是一个开放性的问题。有两个主要因素需要关注:
First, the ideal trajectory that the model should learn, is not well-defined. Currently we adopt the human drivers’ trajectory as the “ground truth”. It’s not a bad choice. However, human drivers may make mistakes. The model may learn these bad examples, which may cause further problems. Moreover, suppose that the leading vehicle is moving slowly. For human drivers, we can choose to overtake it or not, which leads to at least two possible trajectories. Then, how can we decide which trajectory is better and force the model to learn it?
首先,模型应该学习的理想的轨迹****并没有被很好地定义。目前,我们采用人类驾驶员的轨迹作为“真实轨迹”。这不是一个糟糕的选择。然而,人类驾驶员可能会犯错误。模型可能会学习这些不良示例,这可能会导致进一步的问题。此外,假设前车行驶缓慢。对于人类驾驶员来说,我们可以选择超车或不超车,这至少会导致两种可能的轨迹。那么,我们如何决定哪条轨迹更好,并强迫模型学习它呢?
Second, is it necessary to care about the trajectory points that are so far away? Considering that Openpilot inferences at 30 FPS, then theoretically only the trajectory points within 0.033 seconds in the future are important, for the later ones will be overridden by the next prediction. If a vehicle is moving at 120 kph, then it only moves 1.1 meters in 0.033 seconds. Does it mean that we only need to focus on the trajectories within several meters?
第二,我们真的需要关心那些很远的轨迹点吗?考虑到 Openpilot 以每秒 30 帧(30 FPS)进行推理,那么从理论上讲,只有未来 0.033 秒内的轨迹点才重要,因为更晚的点将被下一次预测所覆盖。如果一辆车以每小时 120 公里的速度行驶,那么在 0.033 秒内它只移动了 1.1 米。这是否意味着我们只需要关注几米内的轨迹?
5.3 “Debug” an End-to-end Model
It’s common knowledge that algorithm designers should pay attention to corner cases and failure cases. Traditionally, in an autonomous driving system where the perception and planning module are apart, we may conclude which part is at fault on failure. However, for an end-to-end model like Supercombo, whose perception and planning module are fused together, how can we debug it on failure? For example, if the model refuses to stop on red light, how can we know if it successfully detects the red light and the stop line?
众所周知,算法设计者应该关注边缘情况和失败案例。传统上,在感知模块和规划模块分开的自动驾驶系统中,我们可能在失败时判断出哪个部分出了问题。然而,对于像 Supercombo 这样的端到端模型,其感知和规划模块是融合在一起的,失败时我们该如何调试?例如,如果模型在红灯前拒绝停车,我们怎么知道它是否成功检测到了红灯和停车线?
Frankly speaking, we do not know the answer, either. Of course there are some genetic solutions to make the model robust, like adding more data, making the model deeper and larger, etc., but they do not help solve a specific problem.
坦白地说,我们也不知道答案。当然,有一些通用的解决方案可以使模型更加稳健,比如增加更多数据、使模型更深更广等,但这些方法并不能帮助解决特定的问题。
5.4 Reason for Dual-model Deployment Scheme( 双模型部署方案的原因)
In our work, the dual-model deployment scheme is mainly based on two considerations: On the one hand, due to the insufficient labeling of the dataset, the model we reimplement only predicts the trajectories, while the original Supercombo also predicts other information including lead, pose, lanes, road, edges, etc. These additional predictions are also required by other middleware modules in the Openpilot system. On the other hand, as a mass-produced aftermarket product, Openpilot is more than a pure end-to-end neural network. Instead, it’s a systematic project, involving software algorithms, communication middleware, and hardware drivers. There is a certain degree of coupling between each module. Therefore, we deploy the model into the existing Openpilot system with the idea of modularity in mind, rather than starting from scratch.
在我们的研究中,采用双模型部署策略主要是基于两个考虑因素:一方面,由于数据集的标注不充分,我们重新实现的模型只预测轨迹,而原始的 Supercombo 模型还预测其他信息,包括领先车辆、姿态、车道、道路和边缘等。这些额外的预测结果也是 Openpilot 系统中其他中间件模块所需要的。另一方面,作为一个面向市场的大规模生产售后产品,Openpilot 不仅仅是一个纯粹的端到端神经网络,它是一个包含软件算法、通信中间件和硬件驱动的系统性工程。系统中的每个模块都存在一定程度的相互依赖。因此,我们是本着模块化的思想将我们的模型集成到现有的 Openpilot 系统中,而不是完全重新构建系统。
Of course, it is technically possible to discard the dual-model framework. If the reimplemented model can be perfectly aligned with the Supercombo, then we can simply replace it. One possible way to achieve this is to relabel existing datasets and make sure that all the required information is properly labelled.
当然,技术上完全可以放弃双模型部署框架。如果我们重新实现的模型能够完美地与 Supercombo 模型相匹配,那么我们就可以简单地用新模型替换掉旧模型。实现这一目标的一个可能的方法是重新标注现有的数据集,确保所有必要的信息都被准确无误地标注好。这样做可以帮助训练出一个更加精确的模型,从而可能不再需要依赖原始的 Supercombo 模型来提供其他信息。
数据集标注非常重要
6 Conclusions and Future Work
In this report, to discover how Comma.ai manages to achieve L2 assisted driving on a single device, we reimplement the essential Supercombo model from scratch, and test it on public datasets. Experiments suggest that both the original Openpilot and our reimplemented model can perform well on highway scenarios. To test the whole system in real world, we design a dual-model deployment framework. We verify it in CARLA simulation environment, and deploy it on board, proving that our scheme is applicable. Our work confirms that a simple yet effective L2 assisted driving system can be integrated onto a single board, and it can work well in most cases. Of course, there are still a lot to explore and discuss. We hope this report can give the audience some inspiration.
在这份报告中,为了探究 Comma.ai 如何在单一设备上实现 L2 级辅助驾驶功能,我们从零开始重新实现了核心的 Supercombo 模型,并且在公共数据集上对其进行了测试。实验结果表明,无论是原始的 Openpilot 模型还是我们重新实现的模型,在高速公路场景下都能表现出色。为了在现实世界中对整个系统进行测试,我们设计了一个双模型部署框架。我们首先在 CARLA 模拟环境中进行了验证,随后将其部署到车辆上,证明了我们的方案是切实可行的。我们的研究证实,一个简单而有效的 L2 级辅助驾驶系统可以被集成到单一的控制板上,并且在大多数情况下能够良好地工作。当然,还有许多值得进一步探索和讨论的问题。我们希望这份报告能够给读者带来一些启发。
We believe there are still many open problems that worth exploring in this field. To name a few:
1.As end-to-end learning is data-hungry, we may explore new ways to generate and label high-quality data, such as crowdsourcing and auto-labeling.
2.The reason behind the performance gap between the two datasets is not made clear yet.
我们相信,在这一领域,还有许多开放性问题值得深入研究。以下是一些例子:
1.端到端学习对数据的需求很大,我们可能会探索生成和标注高质量数据的新方法,例如利用众包技术或自动化标注技术。
2.目前还不清楚两个数据集之间性能差异的具体原因。
附录
A Openpilot Analysis
A.1 Openpilot: A Real-world Test
In this section, we present the details of how we test Openpilot in real world. These cases are collected in urban, highway, and crosswalks in Shanghai, China. The qualitative and quantitative results, and the typical failure cases are provided below. Full videos can be found in this website https://sites.google.com/view/openpilot-deepdive/home .
在本节中,我们展示了如何在现实世界中测试 Openpilot 的细节。这些案例收集自中国上海的城市街道、高速公路和人行横道。以下是提供的一些定性与定量结果,以及典型的失败案例。完整的视频可以在以下网站找到:https://sites.google.com/view/openpilot-deepdive/home。
A.1.1 Qualitative Results
ACC. For the ACC function, we test three different cases, including car cut-in and cut-out, AEB/FCW and car-following. Figure 12a and Figure 12b shows typical scenarios of vehicle cut-in and cut-out Results show that Openpilot can correctly identify the cut-in and cut-out vehicles and change the speed in time when the car is running in a straight road and the speed keeps in the range of 30 and 90 kph. Also, We test the AEB/FCW function at low speed (< 40 kph). As shown in Figure 12c, when the front car brakes suddenly, Openpilot will slows the car down immediately. Figure 12d shows a typical scenario of a car-following test. We test this function at a full range of speed (from 20 to 120 kph) and under multiple scenarios including straight roads, curves, and intersections. In most cases, Openpilot can successfully follow the leading vehicle.
自适应巡航控制(ACC)功能测试中,我们针对三种不同情况展开了测试:车辆插入和切出、自动紧急制动/前碰撞预警(AEB/FCW)以及跟随前车行驶。图 12a 和图 12b 展示了车辆插入和切出的典型场景。测试结果显示,在车辆保持在 30 至 90 公里/小时的速度范围内沿直线道路行驶时,Openpilot 能够准确识别插入和切出的车辆,并及时调整速度。同时,我们也对低速情况下(低于 40 公里/小时)的 AEB/FCW 功能进行了测试。如图 12c 所示,当前方车辆突然刹车时,Openpilot 能够立即控制车辆减速。图 12d 展示了跟车行驶测试的一个典型场景。我们在 20 至 120 公里/小时的全速度范围内,以及直线道路、弯道和交叉路口等多种场景下对该功能进行了测试。在大多数情况下,Openpilot 都能够成功地跟随前车。

ALC. In terms of ALC, we test it in both scenarios where there are visible lane lines and there are no visible lane lines. Results show that when the vehicle speed is maintained above 50 kph, Openpilot can automatically change the driving lane as long as the human driver turns on the turn signal and applies a small force on the steering wheel. However, Openpilot cannot distinguish the types of lane lines, such as dotted lines and solid lines. In other words, it will still try to change the line when there are solid lines. Figure 13a shows the Openpilot is in an assisted lane change process when there are visible lane lines. Figure 13b shows that Openpilot can still keep the line when there is no visible lane lines in a curved ramp.
自动车道居中(ALC)功能测试中,我们在有清晰可见车道线和没有清晰可见车道线的情况下进行了测试。测试结果表明,只要车速维持在 50 公里/小时以上,驾驶员只要打开转向灯并轻轻转动方向盘,Openpilot 就能够自动完成车道变更。然而,Openpilot 无法识别车道线的类型,比如虚线和实线。换句话说,即使在实线路段,它也会尝试进行变道。图 13a 展示了在有清晰车道线的情况下 Openpilot 正在进行辅助变道的过程。图 13b 则展示了在没有可见车道线的弯曲坡道上,Openpilot 仍能够保持车辆在车道中行驶。

Stop-and-Go. When there is heavy traffic, vehicles may need to start and stop frequently, which may be annoying to human drivers. We test whether Openpilot can well assist human drivers in this case. Figure 14a shows that on a straight road with heavy traffic, Openpilot can tightly follow the leading car when it keeps starting and stopping. The stop-and-go function is also needed when there is an intersection with traffic lights. Figure 14b shows that Openpilot can follow the leading car in an intersection to start and turn left when the red light turns off.
Stop-and-Go. 在交通拥堵的情况下,车辆可能需要频繁地进行启停操作,这可能会给人类驾驶员带来不便。我们对 Openpilot 进行了测试,以查看它是否能够在这种情况下为人类驾驶员提供有效的辅助。图 14a 展示了在交通拥堵的直线道路上,Openpilot 能够紧跟前车,即使它频繁地进行启停。此外,在有交通信号灯的交叉路口,也需要使用到 Stop-and-Go 功能。图 14b 展示了当交通灯变为绿灯时,Openpilot 能够跟随前车在交叉口启动并顺利左转。这表明 Openpilot 在处理交通拥堵和交叉路口启停的复杂场景中具有一定的实用性。

A.1.2 Quantitative Results
We also conduct some quantitative experiments to test how accurately Openpilot measures the distance to the driving lane, the distance to the leading car, and the speed of the leading car.
我们也开展了一系列定量实验,目的是检验 Openpilot 在测量与行驶车道的距离、与前车的距离以及前车速度方面的精确度。通过这些实验,我们可以评估系统在感知周围环境和交通状况方面的性能,这对于自动驾驶系统的安全性和可靠性至关重要。
Distance to Lane Lines. In order to measure the error of the distance to lane lines, we stop the car on a straight road, with different distances to the left lane line. Then, we can compare the model predictions with the actual projected distance between the Comma Two device and the line. The results are shown in Table 4a. We can conclude that Openpilot can accurately predict the position of the lane line.
为了测量车辆与车道线的距离误差,我们将车辆在直线道路上停下,并使其与左侧车道线保持不同的距离。接着,我们将 Openpilot 的预测结果与 Comma Two 设备实际投影到车道线上的距离进行比较。表 4a 展示了这些结果。根据这些数据,我们可以得出结论,Openpilot 能够准确地预测车道线的位置。这表明 Openpilot 在车道识别和车辆定位方面具有较高的精度,这对于自动驾驶系统来说是一个重要的能力。

Distance to the Leading Car. To measure this, we make the vehicle stop on a road. An actor car is placed in different distances to the device. We can then measure the average predicted distances and the standard derivations within a few seconds, and compare with the actual values. The results are reported in Table 4b. We can conclude that Openpilot is capable of accurately measuring the distance to the leading car within 50 meters.
为了测量与前车的距离,我们将车辆停在道路上,并在不同距离处放置一辆参照车辆。接着,我们在几秒钟内测量预测的平均距离和标准差,并将其与实际距离进行比较。这些数据被记录在表 4b 中。根据结果,我们可以得出结论,Openpilot 能够准确地测量与前车的距离,且测量精度在 50 米以内。这表明 Openpilot 在保持安全车距方面具有良好的性能,这对于自动驾驶系统的安全性至关重要。
Speed of the Leading Car. To measure this, we make the vehicle follow an actor car which is moving at a constant speed. Again, we can measure the averaged speed and the standard derivations within a few seconds, and compare with the actual values. The results are reported in Table 4c. We can conclude that Openpilot can accurately measure the speed of the leading car under 60 km/h (16.667 m/s).
为了测量前车的速度,我们让车辆跟随一辆以恒定速度行驶的参照车辆。然后,我们测量几秒钟内的平均速度和标准差,并将其与实际速度值进行比较。这些数据被记录在表 4c 中。根据这些结果,我们可以得出结论,Openpilot 能够准确测量前车的速度,尤其是在速度低于 60 公里/小时(即 16.667 米/秒)的情况下。这表明 Openpilot 在速度监测方面具有较高的精度,对于自动驾驶系统的导航和安全距离控制非常重要。
A.1.3 Failure Cases
Although Openpilot shows relatively good performance in most scenarios, still, it may not be good at coping with complex situations. We summarize some typical failure cases. Take Figure 15a as an example, Openpilot cannot identify objects such as conical barrels, pedestrians, and bicycles on the road. Figure 15b shows that when the vehicle is fast running through a curved road, Openpilot may not handle it well and may alert the human driver to take control of the vehicle. Figure 15c shows that even at low speed, when the other car cuts in at a close distance, Openpilot may not respond quickly on time. Figure 15d shows that Openpilot loses the leading target when following a vehicle to turn, because the leading vehicle quickly vanishes. Figure 15e shows that Openpilot fails to detect the leading vehicle at night.
尽管 Openpilot 在大多数情况下都能展现出相当不错的性能,但它在处理复杂情境时仍可能存在不足。以下是一些典型的失败案例总结:
图 15a 展示了 Openpilot 无法识别道路上的某些物体,例如交通锥标、行人和自行车。
图 15b 显示,在车辆高速通过弯曲道路时,Openpilot 可能处理不当,并可能提示人类驾驶员接管控制。
图 15c 指出,即使在低速行驶时,如果有其他车辆近距离变道插入,Openpilot 也可能无法及时作出反应。
图 15d 展示了在跟随前车转弯时,如果前车迅速从视野中消失,Openpilot 可能会丢失跟踪目标。
图 15e 显示,在夜间行驶时,Openpilot 未能探测到前车。
这些案例表明,尽管 Openpilot 在日常驾驶条件下可以提供辅助,但在某些特定的复杂交通环境中,它仍需要人工干预以确保安全。


 被折叠的 条评论
为什么被折叠?
被折叠的 条评论
为什么被折叠?
 到【灌水乐园】发言


