


目录
系列目录
python数据处理1: 导入数据、片选数据、数据绘图
python数据处理2: 拟合数据、整合数据、导出数据
python数据处理3: 光谱曲线的洛伦兹函数拟合
目标
- 无需关注文件名,直接获得指定文件夹内文件。
- 在文件夹直接执行python文件,使得.py文件可以无需打开编译软件而直接快捷运行。
- 运行结果可以可视化,即matplotlib 嵌入到 PyQt之中。
软件
Anaconda3 + Spyder 3.3.6 + Python 3.7.4
函数
- os.listdir 获得文件列表
- os.path.splitext 获得文件后缀名
- matplotlib.backends.backend_qt5agg 获得FigureCanvasQTAgg类
- PyQt5.QtWidgets 获得QApplication, QWidget类
实现
os文件操作
获得文件列表
.py文件和csv文件在相同文件夹。注意要用双斜杆 \ 。
import os

folderPath = ".\\"
fileNameList = os.listdir(folderPath)
选出指定类型文件
os.path.splitext(file)[-1] 获得后缀,os.path.splitext(file)[0]获得文件名。
fileType = '.csv'
for file in fileNameList:
    if(os.path.splitext(file)[-1]== fileType):
        fileName = folderPath+file

print(fileName)
matplotlib 嵌入到 PyQt
此处参照:https://learndataanalysis.org/embed-matplotlib-graph-in-a-pyqt5-application/
FigureCanvasQTAgg重定义
Canvas里加入figure和axis, 可以使用self.ax 绘图
class Canvas(FigureCanvas):
    def __init__(self, parent):
        fig, self.ax = plt.subplots(figsize=(5, 4), dpi=200)
        super().__init__(fig)
        self.setParent(parent)
QWidget重定义
QWidget中加入自定义的Canvas类。
class AppDemo(QWidget)      :
    def __init__(self):
        super().__init__()
        self.resize(1600, 800)
        self.fig = Canvas(self)
cmd直接执行python文件
runPython.bat
bat文件可以直接改txt的后缀而得。可以直接由txt编辑器编辑。语法参考Microsoft文档cmd。
python testCMD.py
完整的方案
把任意命名的.csv文件,.py 和.bat文件放入同一个文件夹。
结合python数据处理3: 光谱曲线的洛伦兹函数拟合的例子,整体.py代码为:
testCMD.py
import numpy as np
import pandas as pd
from scipy.optimize import curve_fit
import os
import sys
import matplotlib.pyplot as plt
from matplotlib.backends.backend_qt5agg import FigureCanvasQTAgg as FigureCanvas
from PyQt5.QtWidgets import QApplication, QWidget
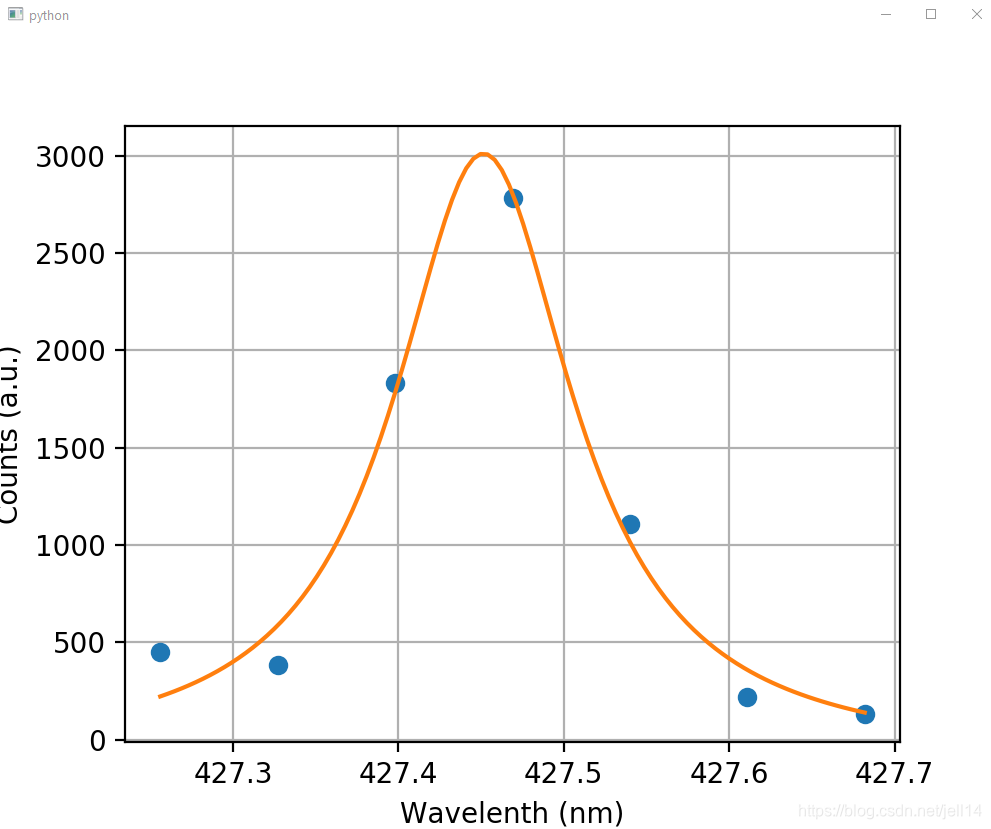
def Lorentz(x,y0,A,xc,w):
y = y0 + (2*A/np.pi)*(w/(4*(x-xc)**2 + w**2))
return y
class Canvas(FigureCanvas):
def __init__(self, parent):
fig, self.ax = plt.subplots(figsize=(5, 4), dpi=200)
super().__init__(fig)
self.setParent(parent)
class AppDemo(QWidget) :
def __init__(self):
super().__init__()
self.resize(1000, 800)
self.fig = Canvas(self)
app = QApplication(sys.argv)
demo = AppDemo()
# get axies
ax = demo.fig.ax
#get file and data
folderPath = ".\\"
fileType='.csv'
for file in os.listdir(folderPath):
if(os.path.splitext(file)[-1]==fileType):
fileName = folderPath+file
print(fileName)
# fileName = 'dataLorentz.csv'
data = pd.read_csv(fileName)
x = data['x']
y = data['y']
# fig, ax = plt.subplots()
ax.plot(x,y,'o')
p,c = curve_fit(Lorentz, x, y,
p0=[-100,500,427.5,0.1],absolute_sigma=True)
y0,A,xc,w=p
xfit = np.linspace(x.min(),x.max(),100)
yfit = Lorentz(xfit,y0,A,xc,w)
ax.plot(xfit,yfit,'-')
ax.set_xlabel('Wavelenth (nm)')
ax.set_ylabel('Counts (a.u.)')
ax.grid()
demo.show()
sys.exit(app.exec_())
效果
无需打开编译器等软件,直接双击执行 .bat文件:
总结
-
–
- 通过对类重定义,嵌入图形到GUI
参考
Embed Matplotlib Graph in a PyQt5 application
https://learndataanalysis.org/embed-matplotlib-graph-in-a-pyqt5-application/
python 获取指定文件夹下所有文件名
https://blog.csdn.net/zhuzuwei/article/details/79925562
十分钟入门 Pandas
https://www.pypandas.cn/docs/getting_started/10min.html
windows批处理(cmd/bat)编程详解
https://blog.csdn.net/bingjie1217/article/details/12947327
如何在CMD中运行Python的.py文件
https://zhuanlan.zhihu.com/p/106983157


 989
989


 被折叠的 条评论
为什么被折叠?
被折叠的 条评论
为什么被折叠?
 到【灌水乐园】发言


