


译者序:
目前的摄像头分辨率的测试,大多遵循ISO 12233标准,最近下载一份英文版的文档,和大家一起分享,仅供学习使用。
目录
ISO 12233 Third Edition (2017-01)
Methods for measuring SFR and resolution — Selection rationale and guidance
Photography — Electronic still picture imaging — Resolution and spatial frequency responses
2 Normative references (规范性引用文件)
3 Terms and definitions(术语和定义)
3.1 addressable photoelements 可寻址光电元件
3.3 cycles per millimetre (cy/mm) 每毫米周期数
3.4 edge spread function(ESF) 边缘扩散函数
3.5 effectively spectrally neutral 有效光谱中性
3.6 electronic still-picture camera 电子图片照相机
3.8 horizontal resolution 水平分辨率
3.12 line pairs per millimetre (lp/mm)每毫米线对
3.13 line spread function (LSF) 线性扩展函数
3.14 line widths per picture height (LW/PH)每幅图片高度的线宽
3.16 lines per millimetre (lines/mm) 线/毫米
3.18 modulation transfer function (MTF) 调制传递函数
3.19 normalized spatial frequency 归一化空间频率
3.20 optical transfer function (OTF) 光学传递函数
3.21 point spread function (PSF)点扩展函数
3.23 sampled imaging system 采样成像系统
3.24 spatial frequency response (SFR)空间频率响应
3.24.1 edge-based spatial frequency response (e-SFR) 基于边缘的空间频率响应
3.24.2 sine wave-based spatial frequency response (s-SFR) 基于正弦波的空间频率响应
3.27.2 hyperbolic wedge test pattern 双曲线楔形试验模式
3.28 vertical resolution 垂直分辨率
4.1 Test chart illumination 测试图照明
4.2 Camera framing and lens focal length setting 摄像机取景和镜头焦距设置
4.6 Luminance and colour measurements 亮度和颜色测量
5 Visual resolution measurement 视觉分辨率测量
5.2.5 Test pattern modulation 测试模式调制
5.2.6 Positional tolerance 位置公差
5.3 Rules of judgement for visual observation 目测判断规则
5.3.2 An example of a correct visual judgement 正确视觉判断示例
6 Edge-based spatial frequency response (e-SFR) 基于边缘的空间频率响应
6.2.1 Selection of the edge region of interest (ROI) 感兴趣的边缘区域(ROI)的选择
6.2.2 Transformation into effective exposure 转化为有效曝光
6.2.3 Estimation of the location of the edge 边缘位置估计
6.2.3.1 Initial estimation of edge location (offset) and slope 边缘位置(偏移)和坡度的初始估计
6.2.3.2 Final estimation of edge location (offset) and slope 边缘位置(偏移)和坡度的最终估算
6.2.3.3 Final estimation of edge location 边缘位置的最终估计
6.2.3.4 Computation of final location of the edge for each line of data 计算每条数据线边缘的最终位置
6.2.3.5 Estimation of final slope and location of the edge 最终坡度和边缘位置的估算
6.2.4 Formation of a super-sampled line spread function array 超采样线扩展函数阵列的形成
6.2.5 Computation of the e-SFR e-SFR的计算
7 Sine-based spatial frequency response (s-SFR) measurement 基于正弦的空间频率响应(s-SFR)测量
8 Presentation of results 结果展示
8.2.3 Representative presentation 代表性展示
8.3 Spatial frequency response (SFR) 空间频率响应
8.3.2 Spatial frequency response 空间频率响应
8.3.3 Report of resolution value derived from the s-SFR s-SFR分辨率值报告
Annex A(informative) CIPA resolution test chart 附录A(资料性附录)CIPA分辨率测试图
A.2 Test chart tolerance 测试图公差
A.3 Dimensional specification of the test chart 试验图的尺寸规格
Annex B (informative) Visual resolution measurement software 附录B(资料性附录)视觉分辨率测量软件
B.1 Background and purpose 背景和目的
B.2 Downloading the software 下载软件
B.3 Measurement procedure 测量程序
B.4 The outline of the software processing 软件处理概述
B.4.2 Black line detection 黑线检测
B.4.3 Image rotation process 图像旋转过程
Annex D (normative) Edge spatial frequency response (e-SFR) algorithm 附录D(规范性附录)边缘空间频率响应(e-SFR)算法
Annex E (normative) Sine wave star test chart 附录E(规范性附录)正弦波星形试验图
Annex G (informative) Colour-filtered resolution measurements 附件G(参考性)彩色过滤分辨率测量
G.2 Choice of colour filters 彩色滤镜的选择
Annex H (informative) Units and summary metrics 附件H(信息性)单位和汇总指标
H.1 Conversions between commonly used units
H.2 Relation between SFR, sharpness, and acutance SFR关系、锋利度和锐度
H.3 Sampling efficiency rating (Es) 采样效率等级
I.2 The original test chart defined in ISO 12233:2000 (ISO 12233:2000中规定的原始试验图表)
I.3 Limiting resolution measurements in ISO 12233:2000 (ISO 12233:2000中的极限分辨率测量)
I.4 Spatial frequency response measurement in ISO 12233:2000 (high contrast edge SFR)
ISO 12233 Third Edition (2017-01)
Photography — Electronic still picture imaging — Resolution and spatial frequency responses
摄影 - 电子静态图像成像 - 分辨率和空间频率响应
Foreword(前言)
ISO (the International Organization for Standardization) is a worldwide federation of national standards bodies (ISO member bodies). The work of preparing International Standards is normally carried out through ISO technical committees. Each member body interested in a subject for which a technical committee has been established has the right to be represented on that committee. International organizations, governmental and non-governmental, in liaison with ISO, also take part in the work. ISO collaborates closely with the International Electrotechnical Commission (IEC) on all matters of electrotechnical standardization.
ISO(国际标准化组织)是由国家标准机构(ISO成员机构)组成的世界性联合会。国际标准的制定工作通常通过ISO技术委员会进行。对已设立技术委员会的主题感兴趣的每个成员机构均有权派代表参加该委员会。与国际标准化组织保持联系的政府和非政府国际组织也参加了这项工作。ISO与国际电工委员会(IEC)在所有电工标准化问题上密切合作。
The procedures used to develop this document and those intended for its further maintenance are described in the ISO/IEC Directives, Part 1. In particular the different approval criteria needed for the different types of ISO documents should be noted. This document was drafted in accordance with the editorial rules of the ISO/IEC Directives, Part 2 (see www.iso.org/directives).
ISO/IEC指令第1部分描述了编制本文件所用的程序及其进一步维护的程序。应特别注意不同类型ISO文件所需的不同评判标准。本文件是根据ISO/IEC指令第2部分的编辑规则起草的(见www.iso.org/directives).
Attention is drawn to the possibility that some of the elements of this document may be the subject of patent rights. ISO shall not be held responsible for identifying any or all such patent rights. Details of any patent rights identified during the development of the document will be in the Introduction and/or on the ISO list of patent declarations received (see www.iso.org/patents).
请注意,本文件的某些部分可能涉及专利权的主题。ISO不负责识别任何或所有此类专利权。文件编制过程中确定的任何专利权的详细信息将在引言和/或收到的ISO专利声明清单中(见www.iso.org/patents).
Any trade name used in this document is information given for the convenience of users and does not constitute an endorsement.
本文件中使用的任何商标名称均为方便用户提供信息,不构成背书。
For an explanation on the meaning of ISO specific terms and expressions related to conformity assessment, as well as information about ISO’s adherence to the World Trade Organization (WTO) principles in the Technical Barriers to Trade (TBT) see the following URL: www.iso.org/iso/foreword.html.
有关与合格评定相关的ISO特定术语和表达含义的解释,以及ISO在技术性贸易壁垒(TBT)中遵守世界贸易组织(WTO)原则的信息,请参见以下网址:www.iso.org/iso/foreword.html.
The committee responsible for this document is ISO/TC 42, Photography.
负责本文件的委员会是ISO/TC 42,摄影。
This third edition cancels and replaces the second edition (ISO 12233:2014), of which it constitutes a minor revision with changes in Annex D.
第三版取消并取代了第二版(ISO 12233:2014),包括附录D中的小修订版。
Introduction(介绍)
Purpose(目的)
The spatial resolution capability is an important attribute of an electronic still-picture camera. Resolution measurement standards allow users to compare and verify spatial resolution measurements. This document defines terminology, test charts, and test methods for performing resolution measurements for analogue and digital electronic still-picture cameras.
空间分辨率是电子静止图像相机的一个重要特性。分辨率测量标准允许用户比较和验证空间分辨率测量。本文件定义了模拟和数字电子静态图像相机执行分辨率测量的术语、测试图表和测试方法。
Technical background(技术背景)
For consumer digital cameras, the term resolution is often incorrectly interpreted as the number of addressable photoelements. While there are existing protocols for determining camera pixel counts, these are not to be confused with the interpretation of resolution as addressed in this document. Qualitatively, resolution is the ability of a camera to optically capture finely spaced detail, and is usually reported as a single valued metric. Spatial frequency response (SFR) is a multi-valued metric that measures contrast loss as a function of spatial frequency. Generally, contrast decreases as a function of spatial frequency to a level where detail is no longer visually resolved. This limiting frequency value is the resolution of the camera. A camera’s resolution and its SFR are determined by a number of factors. These include, but are not limited to, the performance of the camera lens, the number of addressable photoelements in the optical imaging device, and the electrical circuits in the camera, which can include image compression and gamma correction functions.
对于消费者数码相机,分辨率一词通常被错误地解释为可分辨的最小图像元素数。虽然已存的协议能确定相机像素的数目,但这些协议不应与本文件中所述的分辨率解析混淆。从定性上说,分辨率是相机能够光学捕捉精细间隔的细节的能力,通常被报告为一个单值度量。空间频率响应(SFR)是一种多值度量,它是一种测量对比度损失的空间频率函数。通常,对比度随着空间频率的函数而减小到不再视觉上解析细节的水平。这个限制的频率值就是相机的分辨率。相机的分辨率和SFR由许多因素决定。这些包括但不限于照相机镜头的性能、光学成像装置中可寻址光元件的数量以及相机中的电路,这些电路可以包括图像压缩和伽马校正功能。
While resolution and SFR are related metrics, their difference lies in their comprehensiveness and utility. As articulated in this document, resolution is a single frequency parameter that indicates whether the output signal contains a minimum threshold of detail information for visual detection. In other words, resolution is the highest spatial frequency that a candidate camera can usefully capture under cited conditions. It can be very valuable for rapid manufacturing testing, quality control monitoring, or for providing a simple metric that can be easily understood by end users. The algorithm used to determine resolution has been tested with visual experiments using human observers and correlates well with their estimation of high frequency detail loss.
分辨率和SFR是相关的度量标准,它们的区别在于它们的全面性和实用性。如本文所述,分辨率是单个频率参数,表示输出信号是否包含用于视觉检测的细节信息的最小阈值。换句话说,分辨率是待测相机在特定的条件下可以有效捕获的最高空间频率。它对于快速制造测试、质量控制监控或提供终端用户易于理解的简单度量非常有价值。用于确定分辨率的算法已经通过使用人类观察者的视觉实验进行了测试,并且与高频细节损失的估计有很好的相关性。
SFR is a numerical description of how contrast is changed by a camera as a function of the spatial frequencies that describe the contrast. It is very beneficial for engineering, diagnostic, and image evaluation purposes and serves as an umbrella function from which such metrics as sharpness and acutance are derived. Often, practitioners will select the spatial frequency associated with a specified SFR level as a modified non-visual resolution value.
SFR是一种数值描述,描述了对比度是如何随着空间频率的变化而变化的。它是非常有用的,对于工程、调试诊断和图像评估为目的,并作为一个主要(伞)函数,如锐度和锐度等指标的衍生。通常,从业者会选择与特定SFR水平相关联的空间频率作为修改后的非视觉分辨率值。
In a departure from the first edition of this document, two SFR measurements are described. Additionally, the first SFR metrology method, edge-based spatial frequency response, is identical to that described in the first edition, except that a lower contrast edge is used for the test chart. Regions of interest (ROI) near slanted vertical and horizontal edges are digitized and used to compute the SFR levels. The use of a slanted edge allows the edge gradient to be measured at many phases relative to the image sensor photoelements and to yield a phase-averaged SFR response.
与本文件第一版不同,本文描述了两种SFR测量。此外,第一个SFR计量方法,基于边缘的空间频率响应,与第一版中描述的方法相同,只是测试图使用了较低的对比度边缘。在倾斜的垂直和水平边缘附近的感兴趣区域(ROI)被数字化并用于计算SFR水平。倾斜边缘的使用允许在相对于图像传感器光电元件的许多相位处测量边缘梯度,并且产生相位平均的SFR响应。
A second sine wave-based SFR metrology technique is introduced in the second edition. Using a sine wave modulated target in a polar format (e.g. Siemens star), it is intended to provide an SFR response that is more resilient to ill-behaved spatial frequency signatures introduced by the image content driven processing of consumer digital cameras. In this sense, it is intended to enable easier interpretation of SFR levels from such camera sources. Comparing the results of the edge-based SFR and the sine-based SFR might indicate the extent to which nonlinear processing is used.
第二版介绍了第二种基于正弦波的SFR计量技术。使用极坐标格式的正弦波调制目标(例如Siements star),旨在提供SFR响应,该响应对消费类数码相机的图像内容驱动处理引入的不正常空间频率特征更具弹性。从这个意义上说,其目的是使得能够更容易地解析来自此类相机源的SFR值。比较基于边缘的SFR和基于正弦的SFR的结果,可以看出非线性处理的应用程度。
The first step in determining visual resolution or SFR is to capture an image of a suitable test chart with the camera under test. The test chart should include features of sufficiently fine detail and frequency content such as edges, lines, square waves, or sine wave patterns. The test chart defined in this document has been designed specifically to evaluate electronic still-picture cameras. It has not necessarily been designed to evaluate other electronic imaging equipment such as input scanners, CRT displays, hardcopy printers, or electro-photographic copiers, nor individual components of an electronic still-picture camera, such as the lens.
确定视觉分辨率或SFR的第一步是用被测相机捕捉合适测试图的图像。测试图表应包括足够精细的细节和频率内容,如边缘、线条、方波或正弦波模式。本文档中定义的测试图专门用于评估电子静态图像相机。它的设计不一定是为了评估其他电子成像设备,如输入扫描仪、CRT显示器、硬拷贝打印机或电子照相复印机,也不一定是为了评估电子静止图像相机的单个组件,如镜头。
Some of the measurements described in this document are performed using digital analysis techniques. They are also applicable with the analogue outputs of the camera by digitizing the analogue signals if there is adequate digitizing equipment.
本文中描述的一些测量是使用数字分析技术进行的。如果有足够的数字化设备,则也可通过数字化模拟信号,将其用于相机的模拟输出。
Methods for measuring SFR and resolution — Selection rationale and guidance
测量SFR和分辨率的方法.选择原理和指导
This section is intended to provide more detailed rationale and guidance for the selection of the different resolution metrology methods presented in this document. While resolution metrology of analogue optical systems, by way of spatial frequency response, is well established and largely consistent between methodologies (e.g. sine waves, lines, edges), metrology data for such systems are normally captured under well-controlled conditions where the required data linearity and spatial isotropy assumptions hold. Generally, it is not safe to assume these conditions for files from many digital cameras, even under laboratory capture environments. Exposure and image content dependent image processing of the digital image file before it is provided as a finished file to the user prevents this. This processing yields different SFR responses depending on the features in the scene or in the case of this document, the target. For instance, in-camera edge detection algorithms might specifically operate on edge features and selectively enhance or blur them based on complex nonlinear decision rules. Depending on the intent, these algorithms might also be tuned differently for repetitive scene features such as those found in sine waves or bar pattern targets. Even for constrained camera settings recommended in this document, these nonlinear operators can yield differing SFR results depending on the target feature set. Naturally, this causes confusion on which targets to use, either alone or in combination. Guidelines for selection are offered below.
本节旨在为本文件中不同分辨率计量方法的选择提供更详细的原理和指导。虽然通过空间频率响应的方式,模拟光学系统的分辨率计量已经很好地建立,并且方法之间基本一致(例如正弦波、直线、边缘),此类系统的计量数据通常在良好控制的条件下采集,其中所需的数据线性和空间各向同性假设成立。一般来说,对来自众多数码相机文件的这些假设条件是不安全的,即使在实验室捕获环境下也是如此。在将数字图像文件作为最终的文件提供给用户之前,仅对其进行曝光和基于图像内容的图像处理可以防止这种情况。根据不同的场景特征或根据本文档中的(测试)目标,此处理产生不同的SFR响应。例如,在摄像机中,边缘检测算法可能专门针对边缘特征进行操作,并基于复杂的非线性决策规则对其进行选择性增强或模糊。根据不同的意图,这些算法也可能会针对重复的场景特征进行不同的调整,例如那些在正弦波或条形目标中发现的场景特征。即使对于本文档中建议的受限相机设置,这些非线性操作符也可以根据目标特征集产生不同的SFR结果。当然,这会导致混淆使用哪一个目标,无论是单独使用还是组合使用。选择指南如下。
Edges are common features in naturally occurring scenes. They also tend to act as visual acuity cues by which image quality is judged and imaging artefacts are manifested. This logic prescribed their use for SFR metrology in the past and current editions of this document. It is also why edge features are prone to image processing in many consumer digital cameras: they are visually important. All other imaging conditions being equal, camera SFRs using different target contrast edge features can be significantly different, especially with respect to their morphology. This is largely due to nonlinear image processing operators and would not occur for strictly linear imaging systems. To moderate this behaviour, a lower contrast slanted edge feature (Figure C.1) was chosen to replace the higher contrast version of the first edition. This feature choice still allows for acuity-amenable SFR results beyond the half-sampling frequency and helps prevent nonlinear data clipping that can occur with high contrast target features. It is also a more reliable rendering of visually important contrast levels in naturally occurring scenes.
边缘是自然场景中常见的特征。他们也倾向于作为视觉敏锐度的线索,通过图像质量的判断和成像文物的表现。该逻辑规定了本文件过去和当前版本中SFR计量的用途。这也是为什么边缘特征易于在许多消费类数码相机中进行图像处理:它们在视觉上很重要。在所有其他成像条件相同的情况下,使用不同目标对比度边缘特征的相机SFR可以显著不同,特别是在其形态方面。这在很大程度上是由于非线性图像处理操作,不会发生严格的线性成像系统。为了缓和这种情况,我们选择了一个对比度较低的倾斜边缘特征(图C.1)来代替第一版的对比度较高的版本。此功能选择仍允许灵敏度可接受的SFR结果超过半采样频率,并有助于防止高对比度目标功能可能发生的非线性数据剪裁。这也是一个更可靠的渲染视觉上重要的对比度水平在自然发生的场景。
Sine wave features have long been the choice for directly calculating SFR of analogue imaging systems and they are intuitively satisfying. They have been introduced into the second edition based on experiences from the edge-based approach. Because sine waves transition more slowly than edges, they are not prone to being identified as edges in embedded camera processors. As such, the ambiguity that image processing imposes on the SFR can be largely avoided by their use. Alternatively, if the image processing is influenced by the absence of sharp features, more aggressive processing might be used by the camera. A sine wave starburst test pattern (Figure 6) is adopted in the second edition. With the appropriate analysis software, a sine wave-based SFR can be calculated up to the half-sampling frequency. For the same reasons stated above, the sine wave-based target is also of low contrast and consistent with that of the edge-based version. An added benefit of the target’s design over other sine targets is its compactness and bi-directional features.
正弦波特征一直是直接计算模拟成像系统SFR的首选,且直观地满足了这一要求。它们已根据基于边缘的方法的经验被引入第二版。由于正弦波的转换比边慢,所以它们不容易被嵌入式相机处理器识别为边缘。因此,图像处理对SFR的模糊性可以通过它们的使用来避免。或者,如果图像处理受到缺少锐利特征的影响,则相机可能会使用更冒进的处理。第二版采用了正弦波星爆测试模式(图6)。利用适当的分析软件,可以计算出半采样频率的正弦SFR。基于上述相同的原因,正弦波目标的对比度也较低,与基于边缘的目标一致。把正弦波设为目标的另一个好处是它的紧凑性和双向性。
All experience suggests that there is no single SFR for today’s digital cameras. Even under the strict capture constraints suggested in this document, the allowable feature sets that most digital cameras offer prevent such unique characterization. Confusion can be reduced through complete documentation of the capture conditions and camera setting for which the SFR was calculated. It has been suggested that comparing edge-based and sine wave-based SFR results under the same capture conditions could be a good tool in assessing the contribution of spatial image processing in digital cameras.
所有的经验都表明,对于今天的数码相机,(每次计算所得的)SFR值不是唯一的。即使在本文档中建议的严格的捕获限制下,大多数数码相机提供的允许的功能集也阻止了这种独特的特征。通过完整地记录用于计算SFR的拍照条件和摄像机设置,可以减少混淆。有人建议,在相同的捕获条件下比较基于边缘和基于正弦波的SFR结果可以成为评估数字相机空间图像处理贡献的一个好工具。
Finally, at times, a full SFR characterization is simply not required, such as in end of line camera assembly testing. Alternately, SFR might be an intimidating obstacle to those not trained in its utility. For those in need of a simple and intuitive space domain approach to resolution using repeating line patterns, a visual resolution metric is also provided in this third edition of this document.
最后,有时,完整的SFR特性是根本不需要的,例如在生产线末端的相机装配测试。另一方面,SFR对于那些没有接受过实用性培训的人来说可能是一个可怕的障碍。对于需要使用重复线模式的简单直观的空间域方法进行解析的人,本文档的第三版还提供了视觉分辨率度量。
With such a variety of methods available for measuring resolution, there are bound to be differences in measured resolution results. To benchmark the likely variations, the committee has published the results of a pilot study using all of the proposed techniques and how they relate to each other. These results are provided in Reference [20].
由于测量分辨率的方法多种多样,测量结果必然存在差异。为了衡量可能的变化,委员会公布了一项试点研究的结果,使用了所有拟议的技术以及它们之间的关系。这些结果见参考文献[20]。
Photography — Electronic still picture imaging — Resolution and spatial frequency responses
摄影-电子静止图像成像-分辨率和空间频率响应
1 Scope (范围)
This document specifies methods for measuring the resolution and the SFR of electronic still-picture cameras. It is applicable to the measurement of both monochrome and colour cameras which output digital data or analogue video signals.
本文件规定了测量电子静止图像照相机的分辨率和SFR的方法。它适用于输出数字数据或模拟视频信号的单色和彩色照相机的测量。
2 Normative references (规范性引用文件)
The following documents are referred to in the text in such a way that some or all of their content constitutes requirements of this document. For dated references, only the edition cited applies. For undated references, the latest edition of the referenced document (including any amendments) applies.
以下文件在正文中的引用方式使其部分或全部内容构成本文件的要求。凡是注日期的引用文件,仅引用的版本适用。凡是不注日期的引用文件,其最新版本(包括任何修改件)适用。
ISO 14524, Photography — Electronic still-picture cameras — Methods for measuring opto-electronic conversion functions (OECFs)
ISO 14524,摄影-电子静止图像照相机-光电转换功能(OECFs)的测量方法
3 Terms and definitions(术语和定义)
For the purposes of this document, the following terms and definitions apply.
以下术语和定义适用于本文件。
ISO and IEC maintain terminological databases for use in standardization at the following addresses:
ISO和IEC用于维护标准化术语数据库的地址链接如下:
— IEC Electropedia: available at http://www.electropedia.org/
— ISO Online browsing platform(ISO在线浏览平台): available at http://www.iso.org/obp
3.1 addressable photoelements 可寻址光电元件
number of active photoelements in an image sensor (3.11)
图像传感器(3.11)中有源光电元件的数量
Note 1 to entry: This equals the product of the number of active photoelement lines and the number of active photoelements per line.
注1:这等于有效光电元件行数与每行有效光电元件数的乘积。
3.2 aliasing (混叠)
output image artefacts that occur in a sampled imaging system (3.23) due to insufficient sampling
由于采样不足而在采样成像系统(3.23)中出现的输出图像人工制品
3.3 cycles per millimetre (cy/mm) 每毫米周期数
spatial frequency unit defined as the number of spatial periods per millimetre
空间频率单位定义为每毫米的空间周期数
3.4 edge spread function(ESF) 边缘扩散函数
normalized spatial signal distribution in the linearized (3.15) output of an imaging system resulting from imaging a theoretical infinitely sharp edge
成像系统线性化(3.15)输出的归一化空间信号分布,由图像的理论极限锐利的边缘而产生
3.5 effectively spectrally neutral 有效光谱中性
having spectral characteristics which result in a specific imaging system producing the same output as for a spectrally neutral (3.25) object
具有光谱特性,可使特定成像系统产生相同的输出(由于光谱中性(3.25)目标)
3.6 electronic still-picture camera 电子图片照相机
camera incorporating an image sensor (3.11) that outputs an analogue or digital signal representing a still picture
包含图像传感器(3.11)的摄像机,输出模拟或数字信号的静止图像
Note 1 to entry: This camera may also record or store an analogue or digital signal representing a still picture on a removable media, such as a memory card or magnetic disc.
注1:相机可以在可移动介质(如存储卡或磁盘)上记录或存储模拟或数字信号的静态图像。
3.7 gamma correction 伽马校正
signal processing operation that changes the relative signal levels
改变相对信号强度的信号处理操作
Note 1 to entry: Gamma correction is performed, in part, to correct for the nonlinear light output versus signal input characteristics of the display. The relationship between the light input level and the output signal level, called the camera opto-electronic conversion function (OECF), provides the gamma correction curve shape for an image capture device.
注1:伽马校正部分用于校正非线性光输出(与之对应的是显示器的信号输入)。光输入强度和电信号输出强度之间的关系称为相机光电转换函数(OECF),为图像捕获设备提供伽马校正曲线形状。
Note 2 to entry: The gamma correction is usually an algorithm, lookup table, or circuit which operates separately on each colour component of an image.
注2:伽马校正通常是一个算法,查找表,或是可以对图像的每个颜色分量分别进行操作的电路。
3.8 horizontal resolution 水平分辨率
resolution (3.22) value measured in the longer image dimension, corresponding to the horizontal direction for a “landscape” image orientation, typically using a vertical or near vertical oriented testchart feature.
分辨率(3.22)在较长图像尺寸中测量的值,对应于“横向”图像方向的水平方向,通常使用垂直或接近垂直方向的测试图特征。
3.9 image aspect ratio 图像纵横比
ratio of the image width to the image height
图像宽度与图像高度之比
3.10 image compression 图像压缩
process that alters the way digital image data are encoded to reduce the size of an image file
改变数字图像数据编码方式以减小图像文件大小的过程
3.11 image sensor 图像传感器
electronic device that converts incident electromagnetic radiation into an electronic signal
将入射电磁辐射转换成电子信号的电子装置
EXAMPLE:Charge coupled device (CCD) array, complementary metal-oxide semiconductor (CMOS) array
示例:电荷耦合器件(CCD)阵列、互补金属氧化物半导体(CMOS)阵列
3.12 line pairs per millimetre (lp/mm)每毫米线对
spatial frequency unit defined as the number of equal width black and white line pairs per millimetre
空间频率单位定义为每毫米等宽黑白线对的数目
3.13 line spread function (LSF) 线性扩展函数
normalized spatial signal distribution in the linearized (3.15) output of an imaging system resulting from imaging a theoretical infinitely thin line
成像系统线性化(3.15)输出中的归一化空间信号分布,由成像理论上无限细的线而产生
3.14 line widths per picture height (LW/PH)每幅图片高度的线宽
spatial frequency unit for specifying the width of a feature on a test chart (3.26) relative to the height of the active area of the chart
空间频率单位,用于指定测试图表(3.26)上特征相对于图表活动区域高度的宽度
Note 1 to entry: The value in LW/PH indicates the total number of lines of the same width which can be placed edge to edge within the height of a test target or within the vertical field of view of a camera.
注1:LW/PH值表示可在测试目标高度内或摄像机垂直视野内边对边放置的相同宽度的线的总数。
Note 2 to entry: This unit is used whatever the orientation of the “feature” (e.g. line). Specifically, it applies to horizontal, vertical, and diagonal lines.
注2:无论“特征”的方向如何(例如线),都使用该单位。具体来说,它适用于水平线、垂直线和对角线。
EXAMPLE If the height of the active area of the chart equals 20 cm, a black line of 1 000 LW/PH has a width equal to 20/1 000 cm.
例如,如果图表活动区域的高度等于20 cm,则1000 LW/PH的黑线宽度等于20/1000 cm。
3.15 linearized 线性化
digital signal conversion performed to invert the camera opto-electronic conversion function (OECF) to focal plane exposure or scene luminance
将相机光电转换功能(OECF)转换为焦平面曝光或场景亮度的数字信号转换
3.16 lines per millimetre (lines/mm) 线/毫米
spatial frequency unit defined as the number of equal width black and white lines per millimetre
空间频率单位定义为每毫米等宽黑白线的数量
Note 1 to entry: One line pair per millimetre (lp/mm) is equal to 2 lines/mm.
注1:每毫米一对线(lp/mm)等于2线/mm。
3.17 modulation 调制
normalized amplitude of signal levels
信号电平归一化振幅
Note 1 to entry: This is the difference between the minimum and maximum signal levels divided by the average signal level.
注1:这是最小和最大信号电平之差除以平均信号电平。
3.18 modulation transfer function (MTF) 调制传递函数
modulus of the optical transfer function (3.20)
光学传递函数(3.20)的模数
Note 1 to entry: For the MTF to have significance, it is necessary that the imaging system be operating in an isoplanatic region and in its linear range. Because most electronic still-picture cameras (3.6) provide spatial colour sampling and nonlinear processing, a meaningful MTF of the camera can only be approximated through the SFR. See ISO 15529:2010.
注1:为了使MTF具有重要意义,成像系统必须在等平面区域及其线性范围内工作。由于大多数电子静态图像照相机(3.6)提供空间色彩采样和非线性处理,因此照相机的有意义MTF只能通过SFR来近似。见ISO 15529:2010。
3.19 normalized spatial frequency 归一化空间频率
spatial frequency unit for specifying resolution characteristics of an imaging system in terms of cycles per pixel rather than in cycles/millimetre or any other unit of length
空间频率单位,用于以每像素的周期而不是以周期/毫米或任何其他长度单位来指定成像系统的分辨率特性
3.20 optical transfer function (OTF) 光学传递函数
two-dimensional Fourier transform of the imaging system’s point spread function (3.21)
成像系统的点扩展函数(3.21)的二维傅里叶变换
Note 1 to entry: For the OTF to have significance, it is necessary that the imaging system be operating in an isoplanatic region and in its linear range. The OTF is a complex function whose modulus has unity value at zero spatial frequency (see ISO 9334). Because most electronic still-picture cameras (3.6) provide spatial colour sampling and nonlinear processing, a meaningful OTF of the camera can only be approximated through the SFR.
注1:为了使OTF具有重要意义,成像系统必须在等平面区域及其线性范围内工作。OTF是一个复函数,其模在零空间频率下具有单位值(见iso9334)。由于大多数电子静态图像相机(3.6)提供空间色彩采样和非线性处理,相机的有意义OTF只能通过SFR来近似。
3.21 point spread function (PSF)点扩展函数
normalized spatial signal distribution in the linearized (3.15) output of an imaging system resulting from imaging a theoretical infinitely small point source
成像系统线性化(3.15)输出中的归一化空间信号分布,由成像理论上无穷多的小点产生
3.22 resolution 分辨率
measure of the ability of a camera system, or a component of a camera system, to depict picture detail
测量一个照相机系统或照相机系统的一个部件描绘图象细节的能力
3.23 sampled imaging system 采样成像系统
imaging system or device which generates an image signal by sampling an image at an array of discrete points, or along a set of discrete lines, rather than a continuum of points
一种成像系统或装置,它通过在一组离散点上或沿着一组离散线而不是连续的点上对图像进行采样来产生图像信号
3.24 spatial frequency response (SFR)空间频率响应
relative amplitude response of an imaging system as a function of input spatial frequency
作为输入空间频率函数的成像系统的相对振幅响应
Note 1 to entry: The SFR is normally represented by a curve of the output response to an input sinusoidal spatial luminance distribution of unit amplitude, over a range of spatial frequencies. The SFR is divided by its value at the spatial frequency of 0 as normalization to yield a value of 1,0 at a spatial frequency of 0.
注1:SFR通常由单位振幅的输入正弦空间亮度分布在空间频率范围内的输出响应曲线表示。将SFR除以其在0的空间频率处的值作为归一化,得到在0的空间频率处的值(范围在1~0)。
3.24.1 edge-based spatial frequency response (e-SFR) 基于边缘的空间频率响应
measured amplitude response of an imaging system to a slanted-edge input
成像系统对倾斜边缘输入的测量振幅响应
Note 1 to entry: Measurement of e-SFR is as defined in Clause 6.
注1:e-SFR的测量见第6条。
3.24.2 sine wave-based spatial frequency response (s-SFR) 基于正弦波的空间频率响应
measured amplitude response of an imaging system to a range of sine wave inputs
成像系统对一系列正弦波输入的测量振幅响应
Note 1 to entry: Measurement of s-SFR is as defined in Clause 7.
注1:s-SFR的测量见第7条。
3.25 spectrally neutral 光谱中性
exhibiting reflective or transmissive characteristics which are constant over the wavelength range of interest
展现在特定波长范围内恒定的反射或透射特性
3.26 test chart 测试图
arrangement of test patterns (3.27) designed to test particular aspects of an imaging system
用于测试成像系统特定方面的测试图案(3.27)的集合
3.27 test pattern 测试模式
specified arrangement of spectral reflectance or transmittance characteristics used in measuring an image quality attribute
用于测量图像质量属性的光谱反射或透射特性的指定集合
3.27.1 bi-tonal pattern 双调模式
pattern that is spectrally neutral (3.25) or effectively spectrally neutral (3.5), and consists exclusively of two reflectance or transmittance values in a prescribed spatial arrangement
光谱中性(3.25)或有效光谱中性(3.5)的图案,在规定的空间排列中仅由两个反射率或透射率值组成
Note 1 to entry: Bi-tonal patterns are typically used to measure resolution (3.22) by visual resolution method.
注1:双色调模式通常用于通过视觉分辨率方法测量分辨率(3.22)。
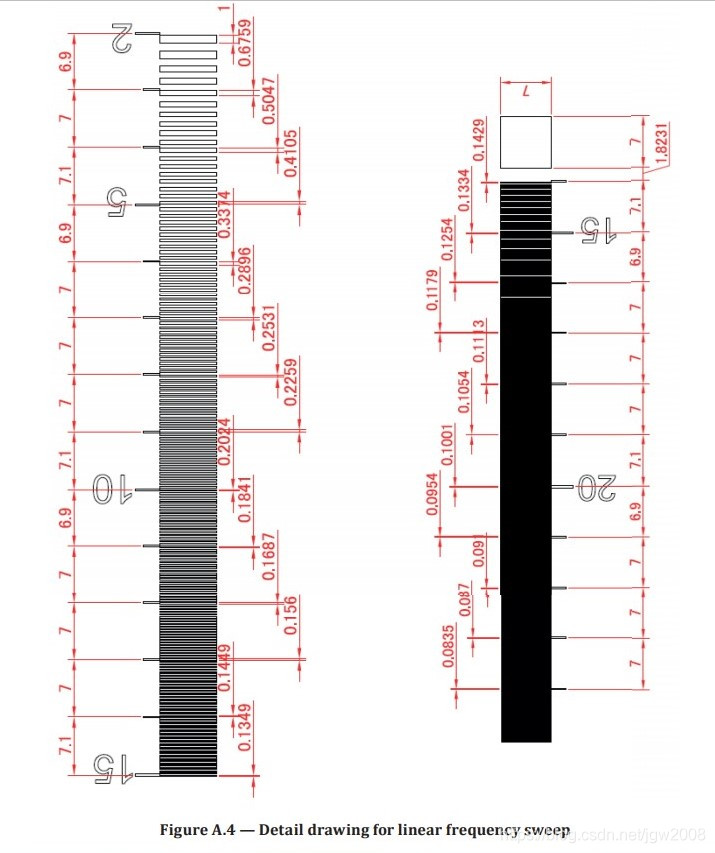
3.27.2 hyperbolic wedge test pattern 双曲线楔形试验模式
bi-tonal pattern (3.27.1) that varies continuously and linearly with spatial frequency
随空间频率连续线性变化的双调模式(3.27.1)
Note 1 to entry: A bi-tonal hyperbolic wedge test pattern is used to measure resolution (3.22) by the visual resolution method in this document.
注1:双色调双曲线楔形测试模式用于通过本文件中的视觉分辨率方法测量分辨率(3.22)。
3.28 vertical resolution 垂直分辨率
resolution (3.22) value measured in the shorter image dimension, corresponding to the vertical direction for a “landscape” image orientation, typically using a horizontal or near horizontal oriented test-chart feature
分辨率(3.22)值,在较短的图像尺寸中测量,与“横向”图像方向的垂直方向相对应,通常使用水平或近水平方向的测试图表特征
3.29 visual resolution 视觉分辨率
spatial frequency at which all of the individual black and white lines of a test pattern frequency can no longer be distinguished by a human observer
一种空间频率,在这种频率下,一个测试模式频率的所有单独的黑白线不再能被人类观察者区分
4 Test conditions 测试条件
4.1 Test chart illumination 测试图照明
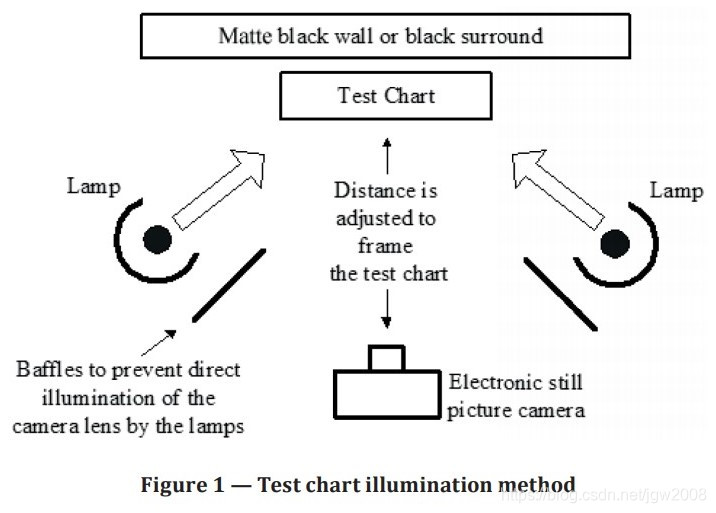
The luminance of the test chart shall be sufficient to provide an acceptable camera output signal level. The test chart shall be uniformly illuminated as shown in Figure 1, so that the illuminance at the chart is within ±10 % of the illuminance in the centre of the chart at any position within the chart. The illumination sources should be baffled to prevent direct illumination of the camera lens by the illumination sources. The area surrounding the test chart should be of low reflectance to minimize flare light. The chart should be shielded from any reflected light. The illuminated test chart shall be effectively spectrally neutral within the visible wavelengths.
测试图的亮度应足以提供可接受的摄像机输出信号水平。试验图表应如图1所示均匀照明,使图表各处的亮度与图表中心亮度相比在±10%范围内。照明源应设置挡板,以防止照明源直接照射相机镜头。测试图表周围的区域应具有低反射率,以尽量减少耀斑。这张图表应该遮住任何反射光。发光测试图应在可见波长范围内具有有效的光谱中性。
4.2 Camera framing and lens focal length setting 摄像机取景和镜头焦距设置
The camera shall be positioned to properly frame the test target. The vertical framing arrows are used to adjust the magnification and the horizontal arrows are used to centre the target horizontally. The tips of the centre vertical black framing arrows should be fully visible and the tips of the centre white framing arrows should not be visible. The target shall be oriented so that the horizontal edge of the chart is approximately parallel to the horizontal camera frame line. The approximate distance between the camera and the test chart should be reported along with the measurement results.
摄像机的位置应能正确地框定测试目标。垂直框架箭头用于调整放大率,水平箭头用于水平居中目标。中心垂直黑色框架箭头的尖端应完全可见,且不应看到中央白色框架箭头的尖端。目标的方向应确保图表的水平边缘与水平摄像机框架线大致平行。测量结果应报告摄像机与测试图之间的近似距离。
4.3 Camera focusing 摄像机对焦
The camera focus should be set either by using the camera autofocusing system, or by performing a series of image captures at varying focus settings, and selecting the focus setting that provides the highest average modulation level at a spatial frequency approximately 1/4 the camera Nyquist frequency. (In the case of a colour camera, the Nyquist frequency is of the conceptual monochrome image sensor without colour filter array). Auto focus accuracy is often limited and this limitation might have an impact on the results.
应通过使用相机自动对焦系统,或通过在不同的对焦设置下执行一系列图像捕获,并选择在空间频率约为相机奈奎斯特频率的1/4处提供最高平均调制电平的对焦设置来设置相机对焦(在彩色照相机的情况下,奈奎斯特频率是概念上的无滤色器阵列的单色图像传感器的频率)。自动对焦精度通常是有限的,这种限制可能会对结果产生影响。
4.4 Camera settings 摄像机设置
The camera lens aperture (if adjustable) and the exposure time should be adjusted to provide a near maximum signal level from the white test target areas. The settings shall not result in signal clipping in either the white or black areas of the test chart, or regions of edge transitions.
应调整相机镜头光圈(如果可调)和曝光时间,以便从白色测试目标区域提供接近最大的信号水平。设置不应在测试图的黑白区域或边缘过渡区域导致信号被剪裁。
Electronic still-picture cameras might include image compression, to reduce the size of the image files and allow more images to be stored. The use of image compression can significantly affect resolution measurements. Some cameras have switches that allow the camera to operate in various compression or resolution modes. The values of all camera settings that might affect the results of the measurement, including lens focal length, aperture and image quality (i.e. recording pixel number or compression) mode (if adjustable), shall be reported along with the measurement results.
电子静态图像照相机可能包括图像压缩,以减小图像文件的大小并允许存储更多图像。使用图像压缩可以显著影响分辨率测量。有些相机有开关允许相机在不同的压缩或分辨率模式下工作。所有可能影响测量结果的相机设置值,包括镜头焦距、光圈和图像质量(即记录像素数或压缩)模式(如果可调),应与测量结果一起报告。
Multiple SFR measurements can be reported for different camera settings, including a setting that uses the maximum lens aperture size (minimum f-number) and maximum camera gain.
可以针对不同的相机设置报告多个SFR测量,包括使用最大镜头光圈大小(最小f数)和最大相机增益的设置。
4.5 White balance (白平衡)
For a colour camera, the camera white balance should be adjusted, if possible, to provide proper white balance [equal red, green, and blue (RGB) signal levels] for the illumination light source, as specified in ISO 14524.
对于彩色相机,应根据ISO 14524的规定,调整相机白平衡,为照明光源提供适当的白平衡[相等的红色、绿色和蓝色(RGB)信号强度。
4.6 Luminance and colour measurements 亮度和颜色测量
Resolution measurements are normally performed on the camera luminance signal. For colour cameras that do not provide a luminance output signal, a luminance signal should be formed from an appropriate combination of the colour records, rather than from a single channel such as green. The reader is referred to ISO 12232 for the luminance signal calculation. Colour-filtered resolution measurements can be performed as described in Annex G.
分辨率测量通常在相机亮度信号上执行。对于不提供亮度输出信号的彩色照相机,亮度信号应该由各种颜色的适当组合形成,而不是来自诸如绿色的单个通道。对于亮度信号计算,读者请参考iso12232。彩色过滤分辨率测量可按附录G所述进行。
4.7 Gamma correction 伽马校正
The signal representing the image from an electronic still-picture camera will probably be a nonlinear function of the scene luminance values. Since the SFR measurement is defined on a linearized output signal and such a nonlinear response can affect SFR values, the signal shall be linearized before the data analysis is performed. Linearization is accomplished by applying the inverse of the camera OECF to the output signal via a lookup table or appropriate equation. The measurement of the OECF shall be as specified in ISO 14524, using the standard reflection camera OECF test chart or using an integrated OECF/resolution chart.
表示来自电子静止图像照相机的图像的信号,可能是场景亮度值的非线性函数。由于SFR测量是在线性化的输出信号上定义的,这种非线性响应会影响SFR值,因此在进行数据分析之前,应将信号线性化。可以使用相机OECF的逆函数通过查找表输出的方式进行线性化,或者使用合适的方程式。OECF的测量应符合ISO 14524的规定,使用标准反射相机OECF测试图或综合OECF/分辨率图。
5 Visual resolution measurement 视觉分辨率测量
5.1 General 概述
The visual resolution is the maximum value of the spatial frequency in LW/PH within a test pattern that is able to be visually distinguished. A black and white hyperbolic wedge is used as the test pattern
视觉分辨率是能够视觉区分的测试模式内空间频率的最大值,单位为LW/PH。黑白双曲线楔形物用作测试图案。
Because of aliasing artefacts in the high frequencies, actual resolution judgements can be ambiguous. The objective visual resolution method cited herein using a hyperbolic wedge test pattern gives more stable results by adopting the visual judgement rules described in 5.3 which have been used by a highly skilled observer.
由于在高频中混淆了人工制品,实际的分辨率判断可能是模糊的。本文引用的使用双曲线楔形测试模式的客观视觉分辨率方法通过采用5.3中所述的视觉判断规则(已由熟练的观察者使用),给出了更稳定的结果。
It can be measured analytically using computer analysis of captured images, as defined in Annex B. The computer analysis method is intended to correlate with the subjective judgement of visual resolution made by a skilled observer but is likely to yield a more consistent and objective result compared to actual visual judgements. However, if there is a discrepancy between the results of the computer analysis method and the judgement of a human observer, the judgement of the human observer takes priority.
如附录B所述,可使用计算机测量分析所拍摄的图像。计算机分析方法旨在与熟练观察者对视觉分辨率的主观判断相关联,但与实际视觉判断相比,可能产生更一致和客观的结果。但是,如果计算机分析方法的结果与人类观察者的判断不一致,则人类观察者的判断优先。
5.2 Test chart 测试图
5.2.1 General 概述
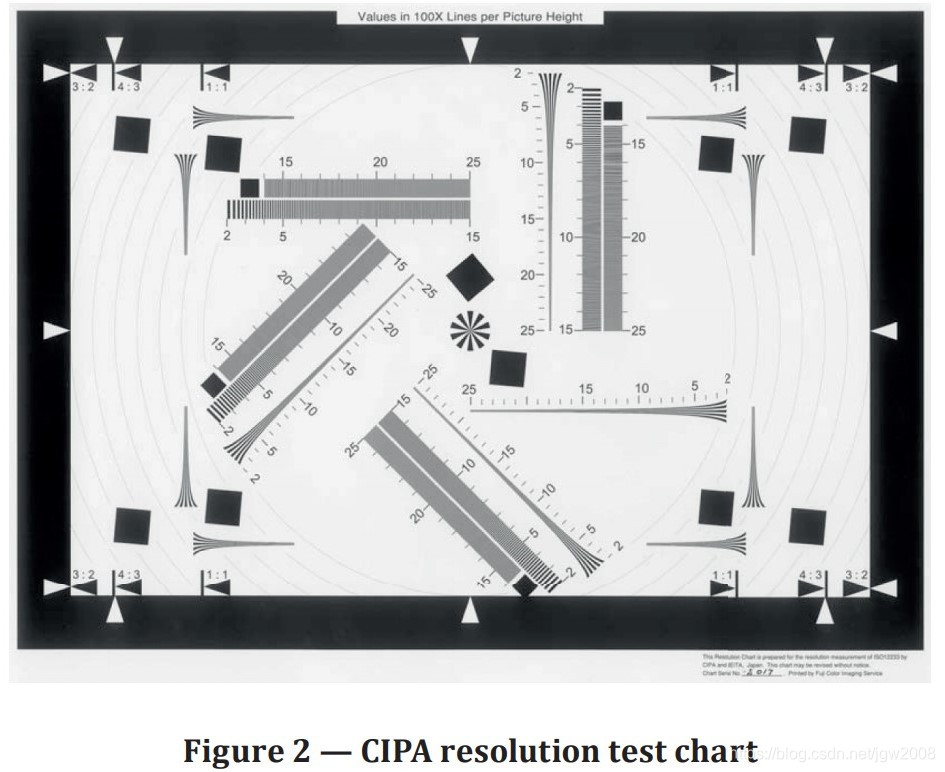
The preferred test chart for measuring the visual resolution is the CIPA resolution chart, which is shown in Figure 2 and specified in Annex A.
测量视觉分辨率的首选测试图是CIPA分辨率图,如图2所示,并在附录A中规定。
The chart shown in Figure 2 is designed to measure cameras having a resolution of less than 2 500 LW/PH. Nevertheless, it is possible to use the chart to measure the resolution of an electronic still camera having a resolution greater than 2 500 LW/PH. This is accomplished by adjusting the camera to target distance, or the focal length of the camera lens, so that the test chart active area fills only a portion of the vertical image height of the camera. This fraction is then measured in the digital image, by dividing the number of image lines in the camera image by the number of lines in the active chart area. The values of all test chart features, in LW/PH, printed on the chart or specified in this document, are multiplied by this fraction, to obtain their correct values. For example, if the chart fills 1/2 of the vertical image height of the camera, then the multiplication factor is equal to 2 and a feature labelled as 2 000 LW/PH on the chart corresponds to 4 000 LW/PH using this chart framing.
图2所示的图表设计用于测量分辨率小于2500 LW/PH的相机。然而,可以使用图表测量分辨率大于2500 LW/PH的电子静态相机的分辨率。这是通过调整相机到目标的距离来实现的,或相机镜头的焦距,以便测试图表活动区域仅填充相机垂直图像高度的一部分。然后,通过将相机图像中的图像行数除以活动图表区中的行数,在数字图像中测量该分数。打印在图表上或本文件中规定的所有试验图表特征值(单位:LW/PH)乘以该分数,以获得其正确值。例如,如果图表填充相机垂直图像高度的1/2,则倍增因子等于2,并且图表上标记为2000 LW/PH的特征对应于使用此图表框架的4000 LW/PH。
NOTE Figure 2 includes an improved version of the test chart features originally defined in ISO 12233:2000. This original test chart defined in ISO 12233:2000 is described in Annex I.
注:图2包括ISO 12233:2000中最初定义的测试图特征的改进版本。ISO 12233:2000中定义的原始试验图表见附录I。
5.2.2 Material 材料
The test chart can be either a transparency that is rear illuminated or a reflection test card that is front illuminated. A reflection chart shall have an approximately Lambertian base material. A transparency chart shall be rear illuminated by a diffuse source.
测试图可以是后发光的透明测试卡,也可以是前发光的反射测试卡。反射图卡应具有近似朗伯基底材料。透明图卡应采用漫反射光源进行背面照明。
5.2.3 Size 尺寸
The active height of reflection test charts should be no less than 20 cm. The active height of transparencies shall be not less than 10 cm.
反射测试图卡的有效高度应不小于20cm。透明胶片的有效高度不得小于10cm。
5.2.4 Test patterns 测试模式
The test chart shall have bi-tonal patterns and should be spectrally neutral.
测试图表应具有双调模式,且应为光谱中性。
NOTE Bi-tonal test charts are easily manufactured and minimize the cost of producing the chart.
注:双调测试图表易于制作,并将制作图表的成本降至最低。
5.2.5 Test pattern modulation 测试模式调制
For reflective charts, the ratio of the maximum chart reflectance, Rmax, to the minimum chart reflectance, Rmin, for large test pattern areas should be not less than 40:1 and not greater than 80:1, and shall be reported if it is outside this range. For transmissive charts, the ratio of the maximum chart transmittance, Tmax, to the minimum chart transmittance, Tmin, for a large test pattern should be not less than 40:1 and not greater than 80:1, and shall be reported if it is outside this range. For a paper base optical density of 0,10, these minimum and maximum numbers translate to optical densities of 1,7 and 2,0, respectively. Modulation ratios for the finer test chart features, relative to the ratio for large test pattern areas, should preferably be reported by the chart manufacturer for reference.
对于反射图卡,最大图表反射率Rmax与最小图表反射率Rmin之比, 对于大的测试图形区域的应不小于40:1且不大于80:1,如果超出此范围,则应报告。对于透射式图卡,对于较大的测试图形,最大图表透射率Tmax与最小图表透射率Tmin之比应不小于40:1且不大于80:1,如果超出此范围,则应报告。对于0,10的纸基光密度,这些最小值和最大值分别转换为1,7和2,0的光密度。较细测试图特征的调制比,相对于较大测试图案区域的调制比,最好由图表制造商提供报告以供参考。
5.2.6 Positional tolerance 位置公差
The position of any test chart feature shall be reproduced with a tolerance of ±1/1 000 picture heights (equivalent to ±1/10 % of the active test chart height). In addition, the width and duty cycle ratio of each feature (white or black line) of the wedge pattern shall be reproduced with a tolerance of ±5 % of the feature width.
任何试验图卡的特征位置应以公差±1/1000再现图片高度(相当于活动测试图表高度的±1/10%)。此外,楔形图案每个特征(白线或黑线)的宽度和占空比应以公差再现特征宽度的±5%。
5.3 Rules of judgement for visual observation 目测判断规则
5.3.1 Rules of judgement 判定规则
The viewer shall observe the following rules when judging the resolution value. These rules are intended to achieve correct measurement value in the presence of unavoidable aliasing artefacts.
观看者在判断分辨率值时应遵守以下规则。这些规则的目的是,在不可避免的混叠伪影存在的情况下,获得正确的测量值。
a) Beginning from the low frequency side, treat a spatial frequency as “Resolved” only when all lower spatial frequencies are also resolved. The resolution limit is achieved at the line just before the first occurrence of unresolved line features.
a) 从低频侧开始,仅当所有较低的空间频率也被解析时,才将空间频率视为“已解析”。分辨率限制出现在第一次未解析到线特征之前。
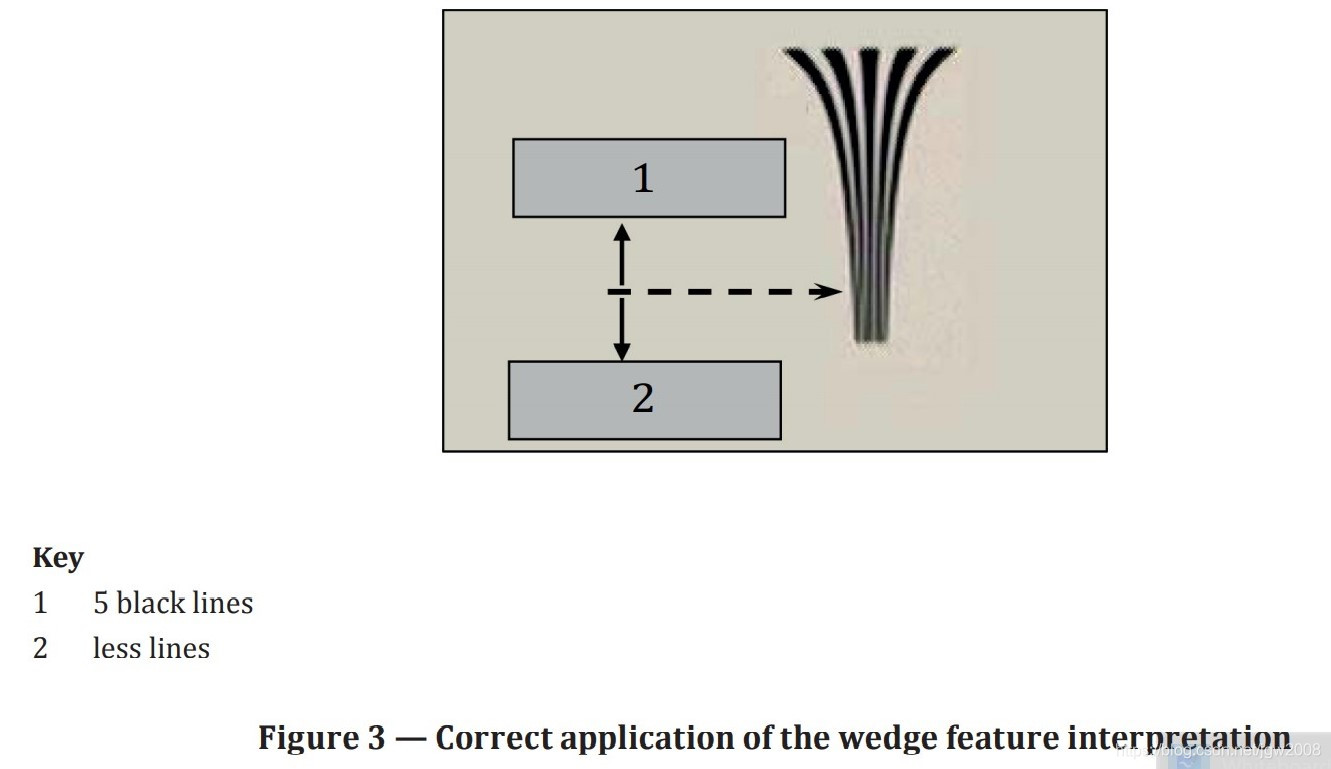
b) Treat a spatial frequency as “Not resolved” when the black and white lines appear to change polarity or lines are blurred together to produce a reduced number of lines, compared to the number in the test chart.
b) 当黑白线出现极性变化或线模糊在一起时,与测试图中的线数相比,产生的线数减少时,将空间频率视为“未解析”。
5.3.2 An example of a correct visual judgement 正确视觉判断示例
As shown in Figure 3, the boundary between the resolved (Key 1) and not resolved (Key 2) regions is indicated by a dashed arrow, which corresponds to resolution value to be measured.
如图3所示,已解析(键1)和未解析(键2)区域之间的边界用虚线箭头表示,虚线箭头对应于要测量的分辨率值。
6 Edge-based spatial frequency response (e-SFR) 基于边缘的空间频率响应
6.1 General 概述
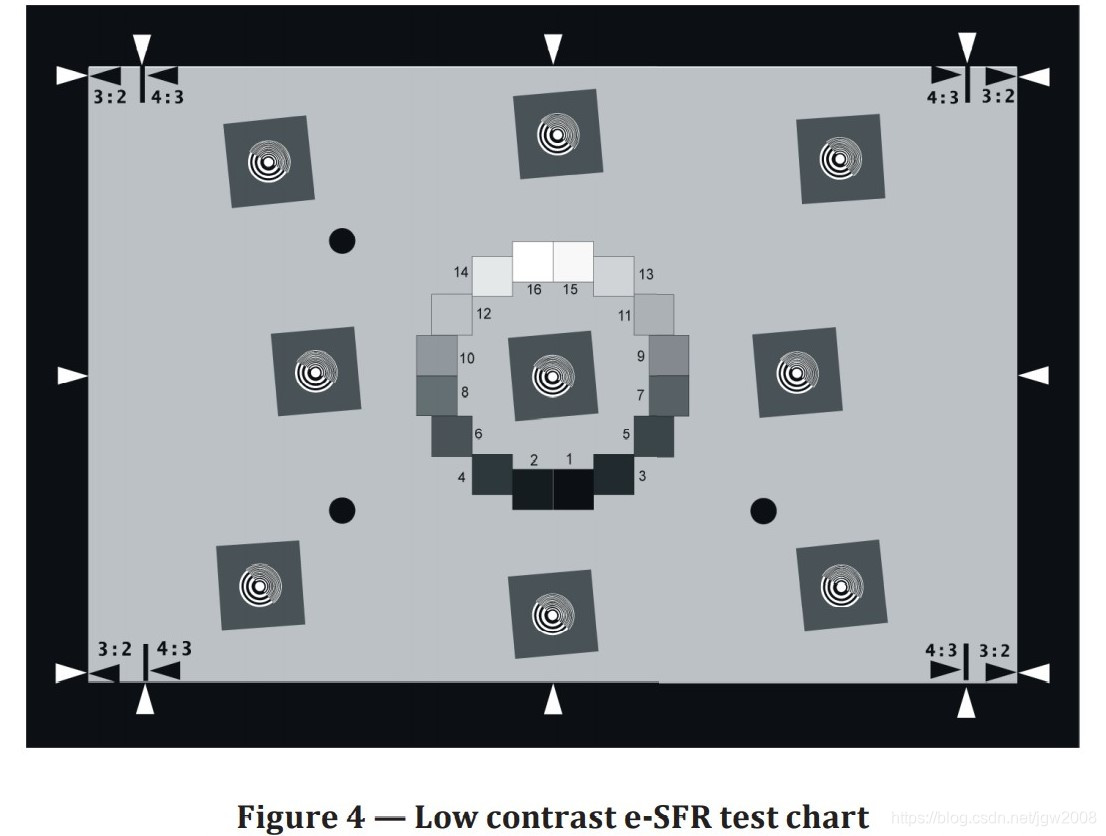
The edge-based spatial frequency response (e-SFR) of an electronic still-picture camera is measured by analysing the camera data near a slanted low contrast neutral edge. The preferred test chart for measuring e-SFR is shown in Figure 4 and specified in Annex C.
通过分析倾斜的低对比度中性边缘附近的相机数据,测量了电子静态图像相机基于边缘的空间频率响应(e-SFR)。测量e-SFR的首选试验图卡如图4所示,并在附录C中规定。
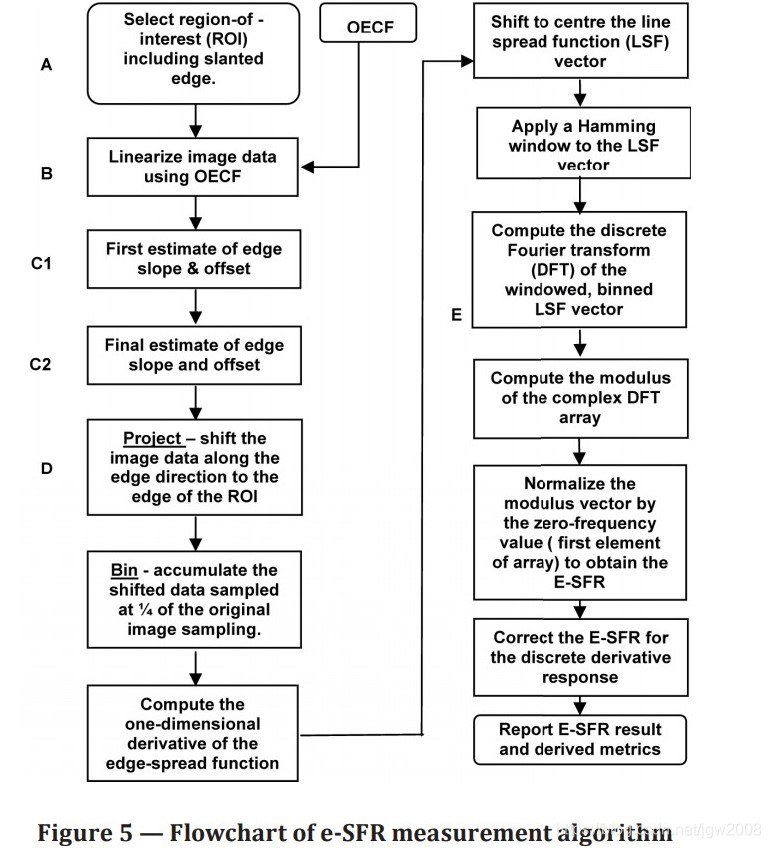
The e-SFR measurement includes the capture of a digital image of the test chart and analysis of the contents of the image file by a software program. This software can be accessed from www.iso.org/12233. The SFR algorithm is defined in Annex D. A diagram depicting the key steps of the SFR algorithm is shown in Figure 5.
e-SFR测量包括捕获测试图卡的数字图像和通过软件程序分析图像内容。此软件可从www.iso.org/12233访问. SFR算法见附录D。图5显示了SFR算法的关键步骤。
The algorithm can automatically compute the e-SFR, using image data from a user-defined rectangular region of the image which represents a near-vertically or near-horizontally oriented dark to light or light to dark edge. The algorithm will be described assuming a near-vertical edge. To measure nearhorizontally, the selected edge image data are rotated 90° before performing the calculation. Note that a near vertical edge is used to measure a horizontal e-SFR, since the e-SFR is a measure of the image transition across the edge, rather than along it. Likewise, a near horizontal edge is used to measure the vertical e-SFR.
该算法利用来自用户定义的矩形区域的图像数据自动计算e-SFR,该矩形区域表示近垂直或近水平方向的暗到亮或亮到暗边缘。该算法将在假设接近垂直边缘的情况下进行描述。若要在水平方向上进行近测量,在执行计算之前请将选定的边缘图像数据旋转90° 。注意,近垂直边缘用于测量水平e-SFR,因为e-SFR是跨边缘而不是沿边缘的图像过渡的测量。同样,近水平边缘用于测量垂直e-SFR。
6.2 Methodology 方法
6.2.1 Selection of the edge region of interest (ROI) 感兴趣的边缘区域(ROI)的选择
The user selects the region containing the slightly slanted edge. If the image is coloured, a luminance record is created before the SFR calculation is performed. The result is a two-dimensional matrix of data of values (n lines, m pixels). See item A in Figure 5.
用户选择包含稍微倾斜的边的区域。如果图像是彩色的,则在执行SFR计算之前创建亮度数据。结果是二维矩阵的数据(n行,m像素)。参见图5中的A项。
6.2.2 Transformation into effective exposure 转化为有效曝光
The image code values shall then be linearized by inverting the opto-electronic conversion function (OECF) of the camera. The OECF shall be measured as specified in ISO 14524. Each pixel value in the ROI is now transformed into an equivalent target reflectance value. See item B in Figure 5.
相机的光电转换函数(OECF)将图像数据线性化。OECF应按照ISO 14524的规定进行测量。ROI中的每个像素值现在都转换为等效的目标反射率值。参见图5中的B项。
6.2.3 Estimation of the location of the edge 边缘位置估计
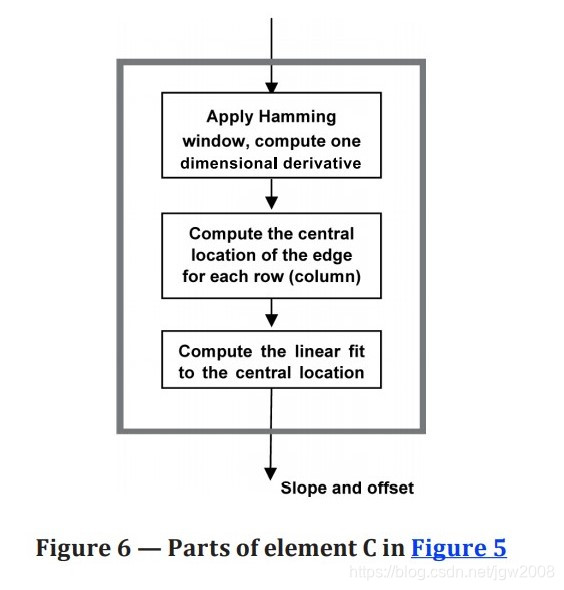
This is done in two steps. See items C1 and C2 in Figure 5.
分两步完成。参见图5中的C1和C2项。
6.2.3.1 Initial estimation of edge location (offset) and slope 边缘位置(偏移)和坡度的初始估计
6.2.3.2 Final estimation of edge location (offset) and slope 边缘位置(偏移)和坡度的最终估算
----Compute one-dimensional derivative 计算一维导数
For each line of pixels perpendicular to the edge, the data are multiplied with a Hamming window vector of the same length (m). For each line of pixels in the resulting array, the derivative of the linearized image data is computed using a [−1/2, +1/2] finite impulse response (FIR) filter. The result is an array which is the same size as the input ROI.
对于垂直于边缘的每一行像素,数据与相同长度(m)的汉明窗向量相乘。对于得到的阵列中的每一行像素,线性化图像数据的导数是使用[−1/2,+1/2]有限冲激响应(FIR)滤波器。结果是一个数组,它的大小与输入ROI大小相同。
----Compute location of the edge for each line of data 计算每行数据的边缘位置
The one-dimensional centroid of this derivative matrix is calculated line by line, to determine the position of the edge on each line. The result is a vector of centroid locations (1, n).
该导数矩阵的一维质心是逐行计算的,以确定每一条线上的边的位置。结果是质心位置的向量(1,n)。
----Estimate slope and location of the edge 估计坡度和边缘位置
A linear best-line fit to the centroid locations as a function of line number is then calculated. That is, from Formula (1)
然后计算出与质心位置的线性最佳拟合线作为线数的函数。也就是说,根据公式(1)
y = mx + b (1)
where y is the set of centroid location and x is the set of line location (1, n), compute the best-fit values for the slope, m, and offset, b. Error messages shall be reported if any centroid is within two pixels of either side of the input image edges, or if the edge does not contain at least 20% modulation.
其中y是质心位置集,x是直线位置集(1,n),计算斜率m和偏移量b的最佳拟合值。如果任何质心位于输入图像边缘两侧的两个像素范围内,或者如果边缘不包含至少20%的调制,则应报告错误消息。
6.2.3.3 Final estimation of edge location 边缘位置的最终估计
For each line of pixels perpendicular to the edge, the location of the centroid of the line is computed from Formula (2)
对于垂直于边缘的每一行像素,根据公式(2)计算该行的质心位置
y1 = m1*x + b1 (2)
where y1 represents the vector of centroid location computed as illustrated in Figure 6. This results in a vector of y’ values.
其中y1表示如图6所示计算的质心位置向量。这将产生y'值的向量。
The transformed image data are multiplied with a Hamming window vector of the same length (n). In this case, the Hamming window function is centred at y’ for each line. For each line of pixels multiplied with thus-centred Hamming window array, the derivative of the image data is computed using a [−1/2, +1/2] finite impulse response (FIR) filter. The result is an array which is the same size as the input ROI.
将变换后的图像数据与相同长度(n)的汉明窗向量相乘。在这种情况下,对于每一行,Hamming窗函数以y'为中心。对于每一行像素乘以如此居中的Hamming窗阵列,使用[−1/2,+1/2]有限冲激响应(FIR)滤波器。结果是一个与输入ROI大小相同的数组。
6.2.3.4 Computation of final location of the edge for each line of data 计算每条数据线边缘的最终位置
The one-dimensional centroid of this derivative matrix is calculated line by line, to determine the position of the edge on each line. The result is a vector of centroid locations (1, n).
该导数矩阵的一维质心是逐行计算的,以确定每一条线上的边的位置。结果是质心位置的向量(1,n)。
6.2.3.5 Estimation of final slope and location of the edge 最终坡度和边缘位置的估算
A linear best-line fit to the centroid locations as a function of line number is then calculated. That is, from Formula (3)
然后计算出与质心位置的线性最佳拟合线作为线性函数。也就是说,根据公式(3)
y = mx +b (3)
where y is the set of centroid location and x is the set of line location (1, n), compute the best-fit values for the slope, m, and offset, b.
其中y是质心位置集,x是直线位置集(1,n),计算斜率m和偏移量b的最佳拟合值。
6.2.4 Formation of a super-sampled line spread function array 超采样线扩展函数阵列的形成
A one-dimensional super-sampled edge spread function shall be formed using the data of the truncated two-dimensional ROI image data. Using the first line as reference points, the data points from all the other lines shall be placed into one of four “bins” between these reference points, according to the distance from the edge for that particular line. This creates a single super-sampled “composite” edge spread function, having four times as many points along the line as the original image data.
应使用截断的二维ROI图像数据形成一维超采样边缘扩展函数。使用第一行作为参考点,根据该特定线的边缘距离,将所有其他线路的数据点放置在这些参考点之间的四个“箱子”之一。这将创建一个超级采样的“复合”边缘扩展函数,沿直线的点数是原始图像数据的四倍。
From this vector, a corresponding line spread function array shall be derived by computing the length-3 discrete derivative. The derivative vector is computed using a [−1/2, 0, +1/2] finite impulse response (FIR) filter, meaning that the derivative value for pixel “X” is equal to −1/2 times the value of the pixel immediately to the left, plus 1/2 times the value of the pixel to the right. The result is a vector which is the same size as the super-sampled edge spread function.
根据该矢量,应通过计算长度3离散导数导出相应的线扩展函数阵列。导数向量是使用[−1/2,0,+1/2]有限冲激响应(FIR)滤波器,意味着像素“X”的导数值等于紧邻左侧的像素值的-1/2倍,加上右侧像素值的1/2倍。结果是一个向量,其大小与超采样边缘扩展函数相同。
6.2.5 Computation of the e-SFR e-SFR的计算
The line spread function array shall be centred by circular rotation, so that the maximum value shall be at location trunk (N/2), where N is the length of the vector (4n). The centred line spread function shall be multiplied by a centred Hamming window. This reduces the effects of noise by reducing the influence of pixels at the extremes of the window, which have response due to noise but little response due to the image edge located at the centre of the window. The discrete Fourier transform (DFT) of the windowed line spread function shall be calculated. The e-SFR is the normalized modulus of the DFT of the centred, windowed line spread function. The final e-SFR is corrected for the bias introduced by the discrete derivative FIR filter. This correction is in the form of a frequency-by-frequency (elementby-element) multiplication by the reciprocal of a sinc function. See References [13], [17] and [20] for supplementary information on the e-SFR method.
线扩展函数阵列应通过环形旋转居中,以便最大值应位于主干位置(N/2),其中N是矢量长度(4n)。中线扩展函数应乘以中心汉明窗。这通过减少窗口极端的像素的影响来减少噪声的影响,这些像素由于噪声而具有响应,但是由于位于窗口中心的图像边缘而几乎没有响应。应计算加窗线扩展函数的离散傅里叶变换(DFT)。e-SFR是中心加窗线扩展函数DFT的归一化模。最后的e-SFR是由离散微分FIR滤波器引入的偏差校正。这种校正的形式是频率乘以频率(元素乘以元素)乘以sinc函数的倒数。关于e-SFR方法的补充信息,参见参考文献[13]、[17]和[20]。
7 Sine-based spatial frequency response (s-SFR) measurement 基于正弦的空间频率响应(s-SFR)测量
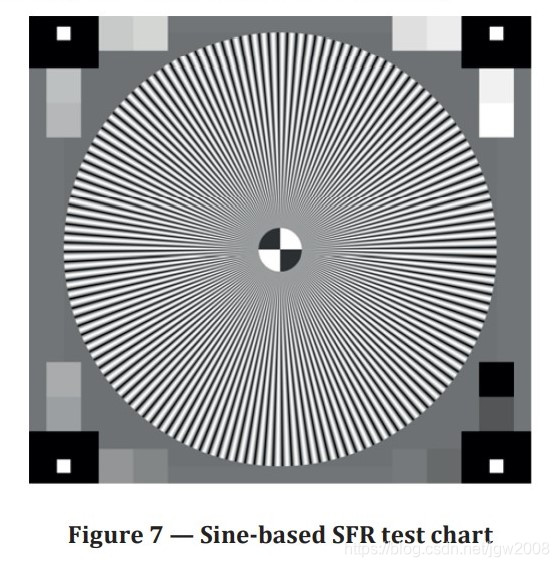
The sine-based spatial frequency response (s-SFR) of an electronic still-picture camera is measured by analysing the camera image taken of a sine wave-modulated starburst pattern. The preferred test chart for measuring the maximum resolution is shown in Figure 7 and will be specified in Annex E.
通过对正弦波调制的星暴图像的分析,测量了电子静止图像相机的正弦空间频率响应(s-SFR)。测量最大分辨率的首选试验图如图7所示,并将在附录E中规定。
An executable version of software has been developed to perform measurements using this test chart. The software, which was created using Matlab®1), can be accessed from www.iso.org/12233.
已经开发了一个可执行版本的软件来使用这个测试图进行测量。该软件是用Matlab编写的®1) ,可从www.iso.org/12233.
The software can report the results from a single image, or can average the results from numerous images. The star is divided into a user-selected number of segments (typically eight segments) for analysis. The user selects the area of the captured image that contains the chart. The Siemens star is surrounded by 16 grey patches used to linearize the image code values by inverting the opto-electronic conversion function (OECF) of the camera. The opto-electronic conversion function shall be measured as specified in ISO 14524. The posted software requires the lightest patch to be in the upper right corner. The result shows the modulation versus frequency [in line pairs/picture height (LP/PH)] for each of the segments.
软件可以报告来自单个图像的结果,也可以平均来自多个图像的结果。星形被分成用户选择的若干段(通常为八段)进行分析。用户选择包含图表的捕获图像区域。Siemens star由16个灰色贴片包围,用于通过反转相机的光电转换函数(OECF)将图像代码值线性化。光电转换功能的测量应符合ISO 14524的规定。发布的软件要求最轻的补丁位于右上角。结果显示了每个片段的调制与频率[线对/图片高度(LP/PH)]。
A detailed description of the algorithm used is specified in Annex F.
所用算法的详细说明见附录F。
1) Matlab is an example of a suitable product available commercially. This information is given for the convenience of users of this document and does not constitute an endorsement by ISO of this product.
1) Matlab是一个合适的商业产品的例子。此信息是为了方便本文档的用户而提供的,并不构成ISO对本产品的认可。
8 Presentation of results 结果展示
8.1 General 概述
The results of the resolution and SFR measurements shall be reported as described below. The following information should be reported along with the measurement results:
分辨率和SFR测量结果应如下所述报告。以下信息应与测量结果一起报告:
a) the values of all camera settings that might affect the results of the measurement, including the sharpness setting, lens focal length and aperture, and resolution or ompression mode (if adjustable);
a) 可能影响测量结果的所有相机设置值,包括锐度设置、镜头焦距和光圈、分辨率或压缩模式(如果可调);
b) whether or not dark-field and flat-field correction was used;
b) 是否采用暗场和平场校正;
c) the illuminating source colour temperature and illumination level;
c) 光源的色温和照明亮度;
d) for cameras equipped with interchangeable lenses, the type and characteristics of the lens used in the tests.
d) 对于装有可互换镜头的摄像机,试验中所用镜头的类型和特性。
If the effect of the lens and the test target can be mathematically removed by using their modulation data (i.e. if the calculated response data can be the same for any interchangeable lens), the calculated camera measurements without a lens can also be reported in the case of SFR.
如果透镜和测试目标的影响可以通过使用它们的调制数据从数学上消除(即,如果计算的响应数据可以与任何可互换透镜相同),那么在SFR的情况下,也可以报告计算的没有透镜的相机测量值。
NOTE 1 Conversion between commonly used units can be performed as described in Annex H.
注1:常用单位之间的换算可按附录H所述进行。
NOTE 2 While reporting all of the above conditions is important for full technical reports, it can make the data collection and reporting complex. Abridged reporting of the capture conditions is acceptable and often preferable for catalogue or casual user information.
注2:尽管报告上述所有情况对完整的技术报告很重要,但这会使数据收集和报告变得复杂。对捕获条件的简略报告是可以接受的,并且通常更适合用于目录或临时用户信息。
8.2 Resolution 分辨率
8.2.1 General 概述
The resolution values acquired by visual resolution measurement shall be reported as spatial frequency values, in LW/PH.
通过视觉分辨率测量获得的分辨率值应报告为空间频率值,单位为LW/PH。
The resolution value derived from the SFR as the spatial frequency value for a given modulation level (see 8.3.1) may also be used as the summary resolution metric, as long as it is consistent with the visual resolution.
从SFR导出的分辨率值作为给定调制电平的空间频率值(见8.3.1)也可用作简要的分辨率度量,只要它与视觉分辨率一致。
The resolution value shall be measured for at least the four basic directions of horizontal, vertical, +45°, and −45° for the presentation of results, and the manner of presentation shall be selected as follows.
应至少在水平、垂直和+45°/−45°四个基本方向上测量分辨率值作为结果的表示,应选择以下表示方式。
8.2.2 Basic presentation 基本展示
The resolution value of each measuring direction shall be reported with its direction for all measured directions.
应报告每个测量方向的分辨率值及其对所有测量的方向。
8.2.3 Representative presentation 代表性展示
The minimum resolution value for all measured directions shall be reported without its direction.
应报告所有测量方向的最小分辨率值,而不报告其方向。
The average resolution value can be reported as a representative value additionally if each of the minimum (with its direction, mentioned above) and average is clearly specified.
如果明确规定了每个最小值(及其方向,如上所述)和平均值,则可以将平均分辨率值报告为代表值。
8.3 Spatial frequency response (SFR) 空间频率响应
8.3.1 General 概述
The SFR result is reported as the modulation level of each spatial frequency. It can also be reported as the frequency value associated with a given modulation level. It shall be reported using a graph plot or a chart diagram.
SFR结果被报告为每个空间频率的调制电平。也可以报告为与给定调制电平相关联的频率值。应使用图像或图表进行报告。
Summary resolution metrics derived from the SFR may also be used. Depending on the use case, the spatial frequency associated with selected SFR response levels (ordinate value) may also be used. The SFR criterion levels and SFR methodology used shall be cited in this case. The reader is referred to Reference [20] for a comparison of SFR results between the two methods.
也可以使用从SFR导出的摘要分辨率度量。根据用例,还可以使用与所选SFR响应水平(纵坐标值)相关联的空间频率。在这种情况下,应引用SFR标准水平和使用的SFR方法。读者可参考参考文献[20]以比较两种方法之间的SFR结果。
8.3.2 Spatial frequency response 空间频率响应
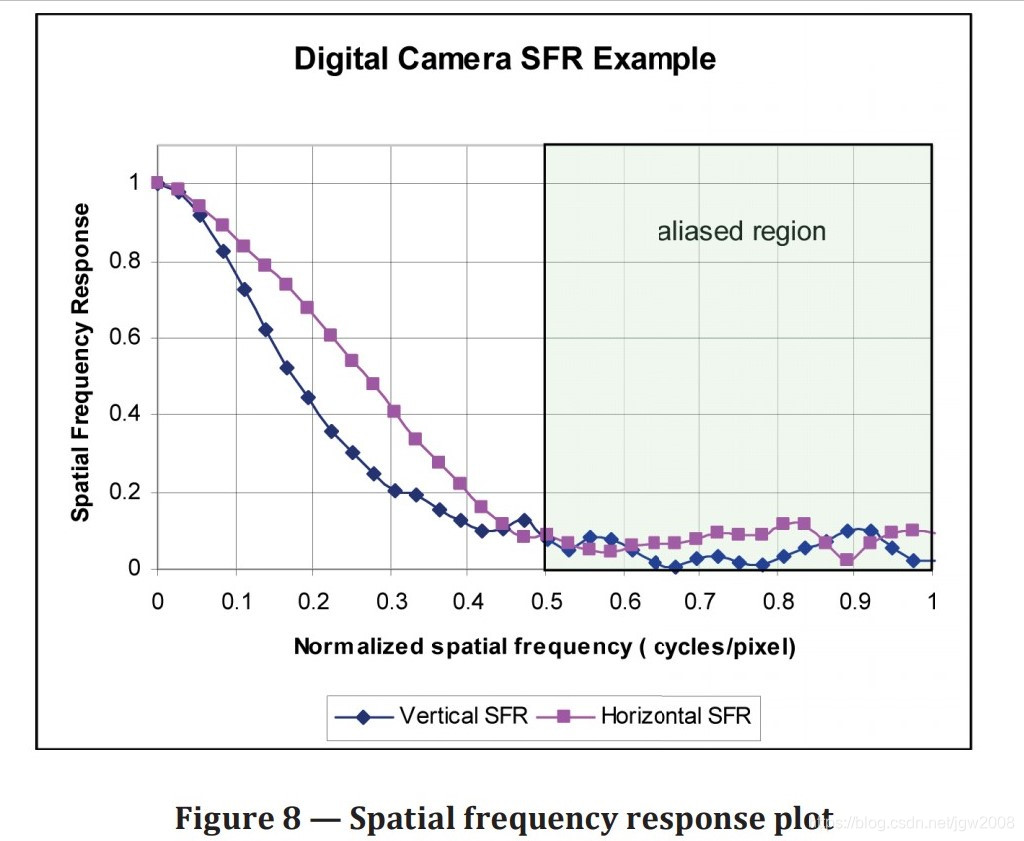
The SFR results shall be reported using a graph plotting the modulation level (having a value of 1 at 0 spatial frequency) versus spatial frequency, or in a list of SFR values versus spatial frequency. The SFR values shall be reported separately for the horizontal and vertical directions. The values shall be the average of four replicate SFR measurements of a low contrast edge. The spatial frequency axis should preferably be labelled with one of three units: frequency relative to the sensor sampling frequency (cycles/pixel), line widths per picture height (LW/PH), or cycles/mm on the sensor, or with equations representing the relationship between these units. There shall be a minimum of 32 equally spaced measurement values for spatial frequencies between 0 and the sensor sampling frequency. The camera half-sampling frequency shall be reported. Values between 1/2 and 1 times the sampling frequency shall be marked to indicate the area of potential aliasing. Figure 8 demonstrates one suitable method of graphically reporting SFR values.
应使用绘制调制电平(在0空间频率处的值为1)与空间频率的关系图或SFR值与空间频率的列表来报告SFR结果。应分别报告水平和垂直方向的SFR值。该值应为低对比度边缘四次重复SFR测量的平均值。空间频率轴最好用三个单位中的一个来标记:相对于传感器采样频率的频率(周期/像素)、每图片高度的线宽(LW/PH)或传感器上的周期/mm,或者用表示这些单位之间关系的方程来标记。对于0和传感器采样频率之间的空间频率,至少应有32个等距测量值。应报告摄像机半采样频率。应标记1/2到1倍采样频率之间的值,以指示潜在混叠区域。图8展示了一种以图形方式报告SFR值的合适方法。
The SFR at angles other than horizontal and vertical positions should also be measured. Typically, tangential and radial direction SFRs are necessary for understanding the influence of the optics on the combined optical and sensor SFR behaviour.
除水平和垂直位置外,还应测量其他角度的SFR。通常,切向和径向SFR是理解光学对光学和传感器SFR组合行为影响的必要条件。
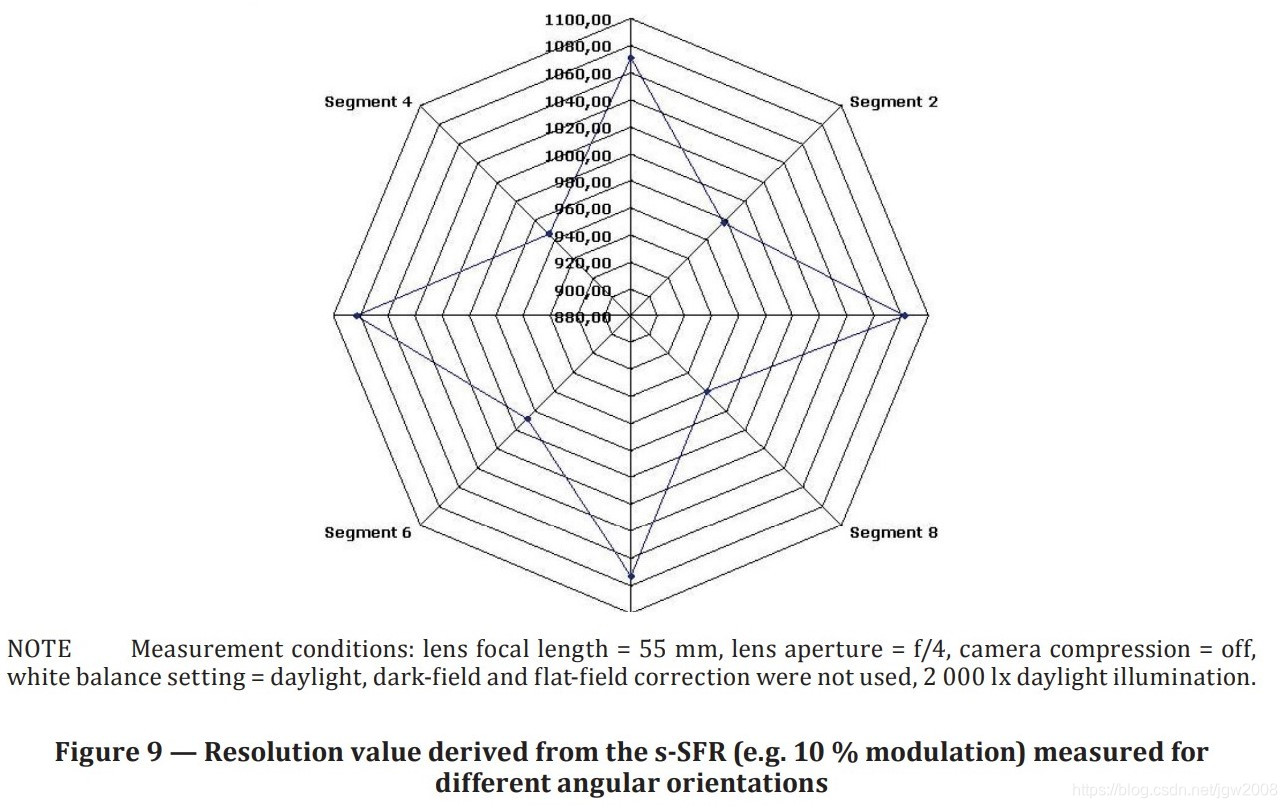
8.3.3 Report of resolution value derived from the s-SFR s-SFR分辨率值报告
The s-SFR values should be reported separately for each measured direction. If the resolution is determined for more than horizontal and vertical orientations, a radar chart diagram is a recommended way to present it. Figure 9 shows an example of a suitable method for reporting the frequency values corresponding to certain modulation levels (e.g. 10 %) in any direction. It indicates the resolution behaviour as a function of angular orientation. Multiple plots may also be graphed on the same chart to show the relationship of differing SFR modulations to one another.
应分别报告每个测量方向的s-SFR值。如果确定的分辨率不止水平和垂直方向,建议使用雷达图来表示。图9显示了用于报告与任何方向上的特定调制电平(例如10%)对应的频率值的合适方法的示例。它表明分辨率行为是角方向的函数。也可以在同一图表上绘制多个图,以显示不同SFR调制彼此之间的关系。
Annex A(informative) CIPA resolution test chart 附录A(资料性附录)CIPA分辨率测试图
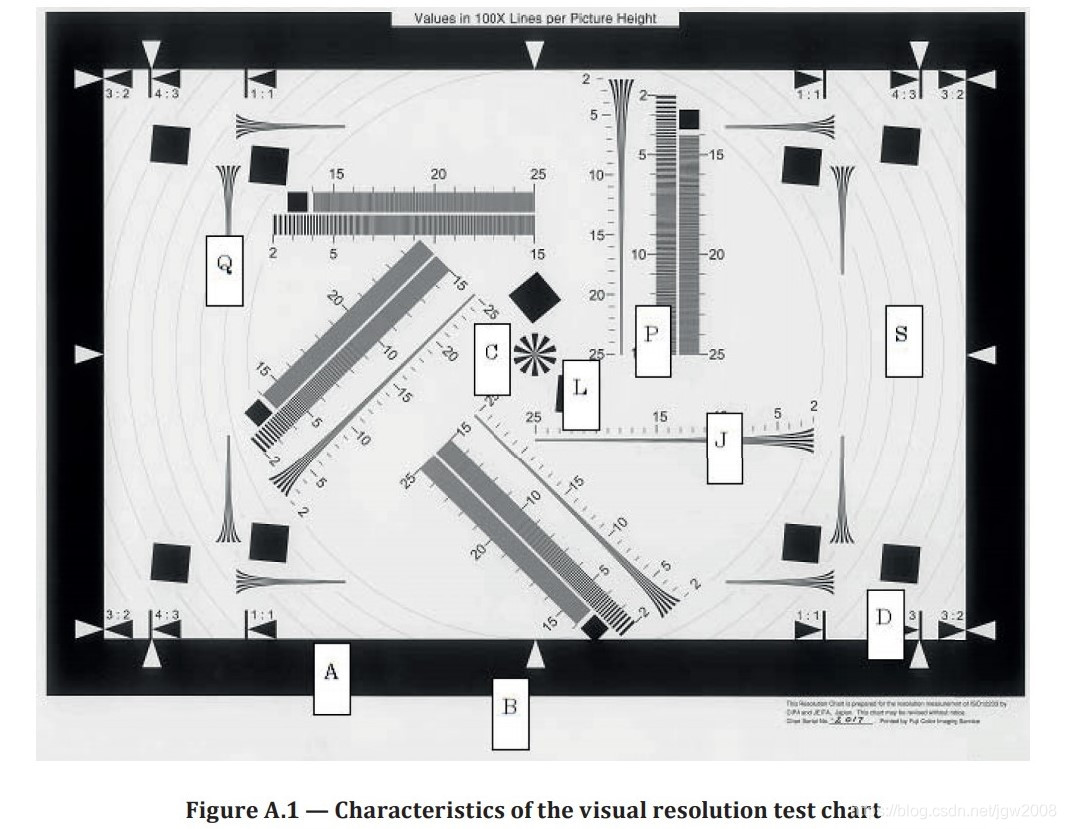
A.1 Test chart features 测试图特征
The CIPA test chart includes the features listed in Table A.1, which are located as shown in Figures A.1 to A.5.
CIPA测试图包括表A.1中列出的特性,如图A.1至A.5所示。
| Code 编号 | Characteristics and application 特点及应用 |
| A | Black border with inner edge which defines active target area 带内边缘的黑色边框,用于定义活动目标区域 |
| B | White framing arrows used to frame target vertically 白色框架箭头用于垂直框架目标 |
| C | Centre pattern used to set focus 用于设置焦点的中心模式 |
| D | Framing lines and arrows that define 1:1, 4:3, and 3:2 aspect ratios 定义1:1、4:3和3:2纵横比的框架线和箭头 |
| J | 200 LW/PH to 2 500 LW/PH hyperbolic zone plates used to measure visual resolution 用于测量视觉分辨率的200 LW/PH至2500 LW/PH双曲线波带片 |
| L | Slightly slanted (approx. 5° or 50°) small black squares used to measure SFR 略微倾斜(约5° 或50°) 用于测量SFR的黑色小方块 |
| P | 200 LW/PH to 2 500 LW/PH square wave sweep 200 LW/PH至2500 LW/PH方波扫描 |
| Q | For checking whether the peripheral portions are in focus 用于检查外围部分是否对焦 |
| S | Concentric circles for reference when other patterns are added 添加其他图案时参考的同心圆 |
A.2 Test chart tolerance 测试图公差
This chart satisfies the following requirements.
此图表满足以下要求。
a) The ratio of the reflectance of the white background, Rmax, and the reflectance of the large black areas, Rmin, shall satisfy the following: 80 > Rmax/Rmin > 40.
a) 白色背景的反射率Rmax和大块黑色区域的反射率Rmin之比应满足以下要求:80>Rmax/Rmin>40。
b) The positional tolerance of the test patterns shall be within 0,2 mm of the specified location (±0,1 % of the image height).
b) 试验图案的位置公差应在规定位置的0,2 mm范围内(图像高度的±0.1%)。
c) The line width tolerance shall be within ±5 %.
c) 线宽公差应在±5 %.
d) The reflectance ratio, Rmax/Rmin, for the finest features of the hyperbolic patterns J and Q should be 18 or greater.
d) 双曲线模式J和Q的最佳特征的反射比Rmax/Rmin应为18或更大。
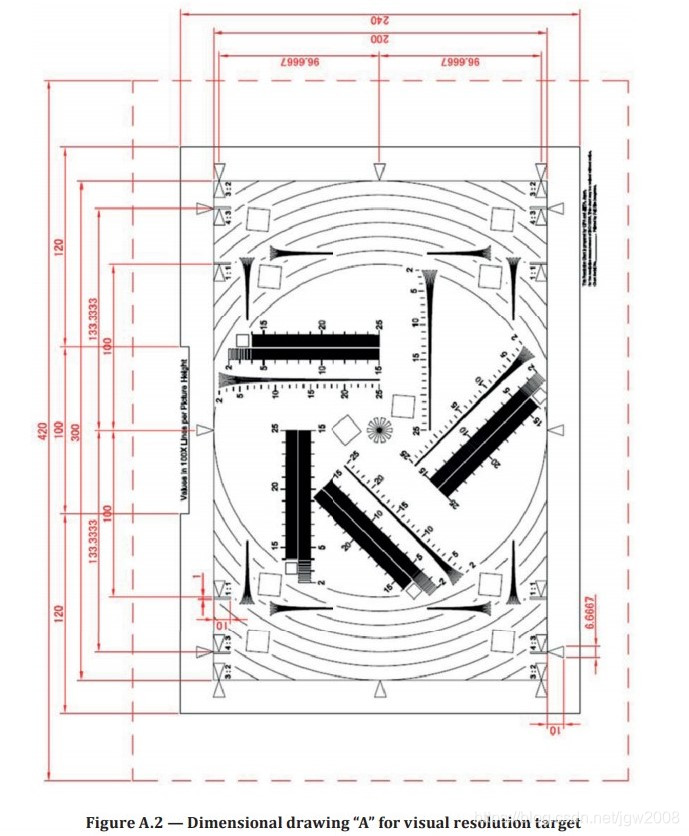
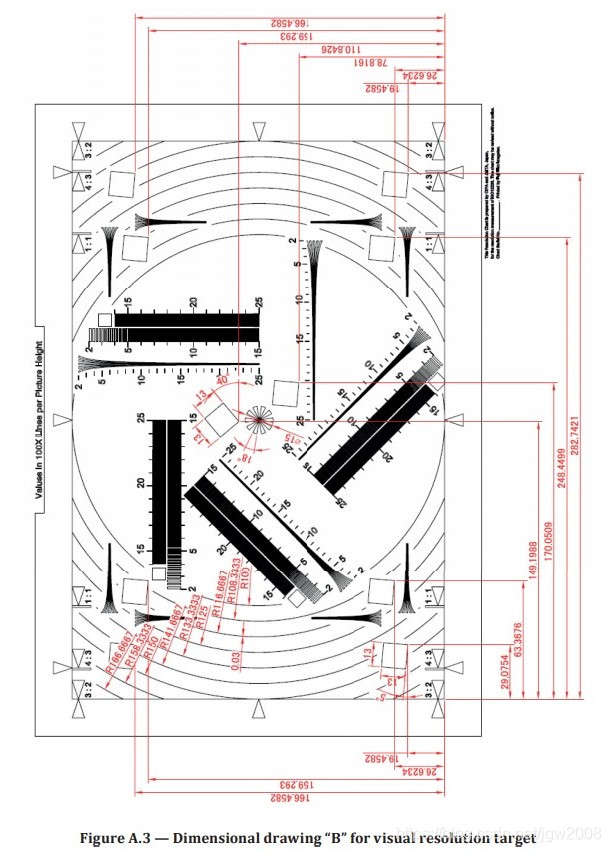
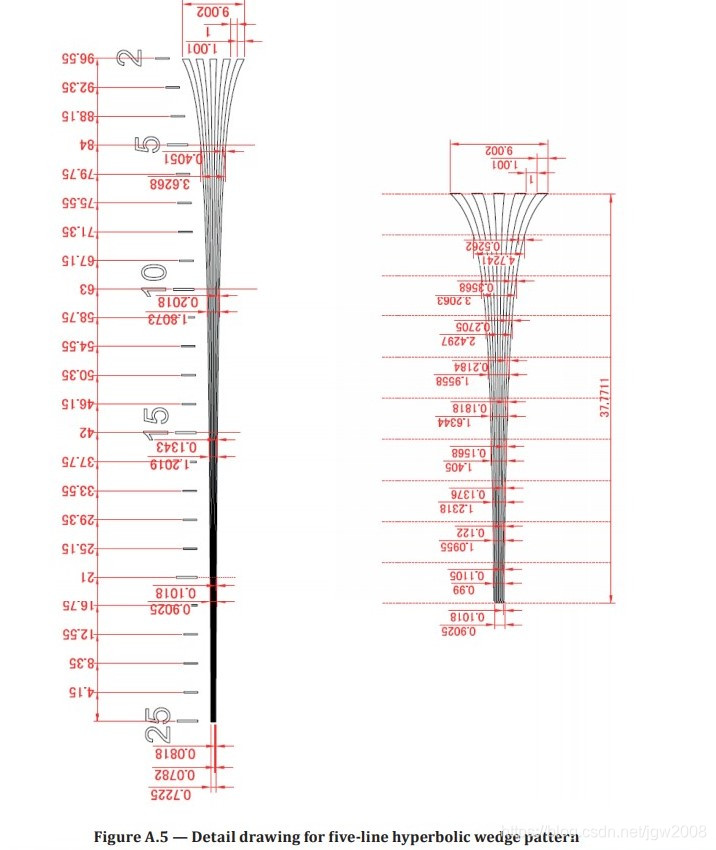
A.3 Dimensional specification of the test chart 试验图的尺寸规格
Annex B (informative) Visual resolution measurement software 附录B(资料性附录)视觉分辨率测量软件
B.1 Background and purpose 背景和目的
The HYResACE(2) measurement software correlates well with visual resolution measurements while avoiding some of the problems of using visual observations. It is also automatic, highly repeatable, and does not depend on an image display device. It supports both JPEG and BMP image file formats.
HYResACE(2)测量软件与视觉分辨率测量有很好的相关性,同时避免了使用视觉观察的一些问题。它也是自动的、高度可重复的,并且不依赖于图像显示设备。它支持JPEG和BMP图像文件格式。
The HYResACE also avoids visual observation errors due to aliasing, by determining when the number of lines in the captured image of a resolution wedge decreases below that in the test chart. Once this condition occurs, the spatial frequency is considered to be “not resolved”. In other words, the measurement software uses the same judging rules as described in 5.3 of this document to remove the influence of artefacts.
HYResACE还通过确定分辨率楔块捕获图像中的线数何时减少到测试图中的线数以下,避免了由于混叠而导致的视觉观察错误。一旦出现这种情况,空间频率被认为是“未解析”。换言之,测量软件使用与本文件5.3所述相同的判断规则来消除人为的影响。
B.2 Downloading the software 下载软件
The HYResACE measurement software that performs this measurement and the document “CIPA standard DC-003”, which contains a more detailed description of the software algorithm, can be downloaded (at no cost) from the following URL:
执行此测量的HYResACE测量软件和文件“CIPA标准DC-003”(包含软件算法的更详细说明)可从以下URL下载(免费):
https://www.cipa.jp/std/std-sec_e.html#cipa-list
This web page is labelled “List of new or revised standards” under CIPA’s homepage, and the link to HYResACE download page is added at the bottom in the column of DC-003.
本网页在CIPA主页下标注“新标准或修订标准清单”,并在DC-003栏底部添加HYResACE下载页面链接。
The document includes some annexes for HYRes (the original HYResACE software that uses the same algorithm) and a flowchart that completely describes the corresponding source code. There is also an annex report that describes the experiment and results used to validate HYRes. The objective results provided by the HYRes software were in good agreement with judged visual resolution by human observers.
该文档包括HYRes(使用相同算法的原始HYResACE软件)的一些附件和完整描述相应源代码的流程图。还有一份附件报告描述了用于验证HYRes的实验和结果。由HYRes软件提供的客观结果与人类观察者判断的视觉分辨率一致。
B.3 Measurement procedure 测量程序
The following is a step-by-step description of the visual resolution measurement procedure.
以下是视觉分辨率测量程序的逐步说明。
1) Capture a digital image of the visual resolution test chart shown in Figure 1 under the test conditions specified in Clause 4.
1) 在第4条规定的试验条件下,拍摄图1所示视觉分辨率试验图的数字图像。
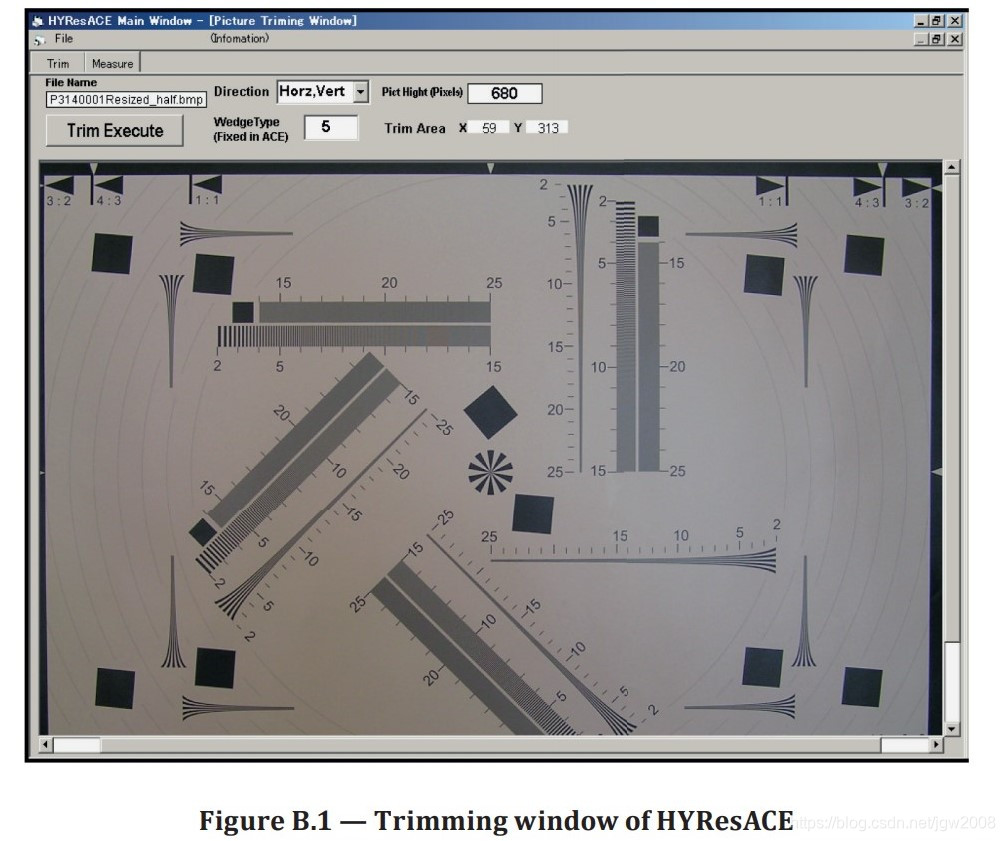
2) Read in the image file to the HYResACE software in the image trimming mode. Manually select the type of wedge (the black line number of the wedge, etc.) to be measured. Then, define the rectangular region of interest (ROI) which includes the wedge pattern from this test chart image by using the image trimming function of HYResACE, as shown in Figure B.1.
2) 在图像修剪模式下,将图像文件读入HYResACE软件。手动选择要测量的楔块类型(楔块的黑线号等)。然后,通过使用HYResACE的图像修剪功能,定义矩形感兴趣区域(ROI),其中包括来自该测试图图像的楔形图案,如图B.1所示。
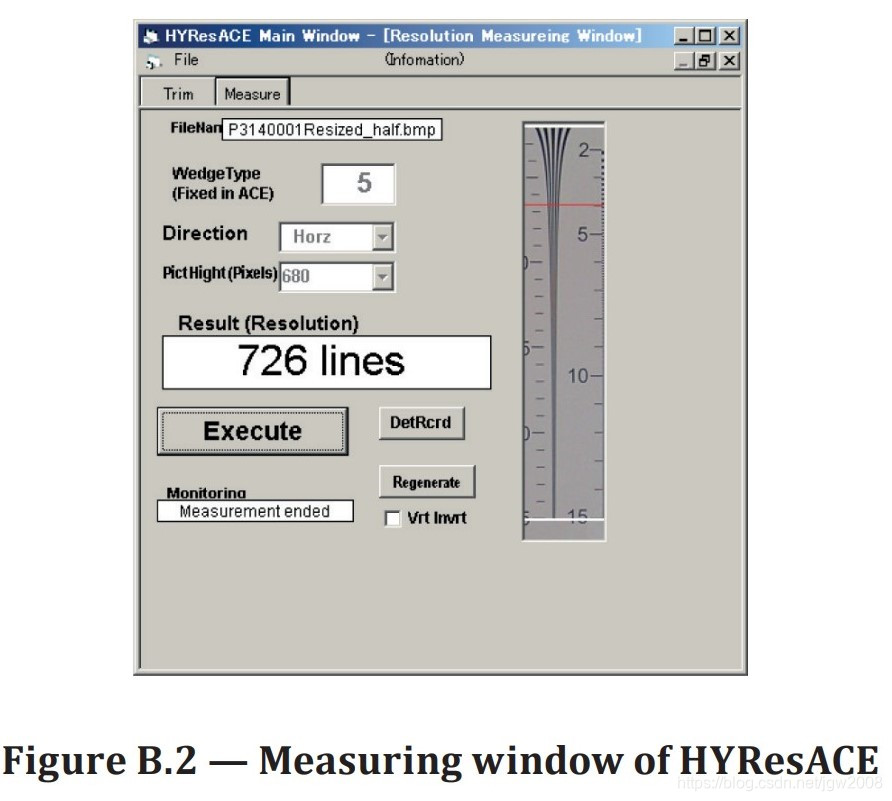
3) HYResACE automatically opens the “Measuring window”, which is a mode for calculating the visual resolution, and displays the selected ROI. The visual resolution limit is then calculated and the measured value is displayed when the operator clicks the “Execute” button, as shown in Figure B.2.
3) HYResACE会自动打开“测量窗口”,这是一种计算视觉分辨率的模式,并显示选定的ROI。然后计算视觉分辨率极限,当操作员单击“执行”按钮时显示测量值,如图B.2所示。
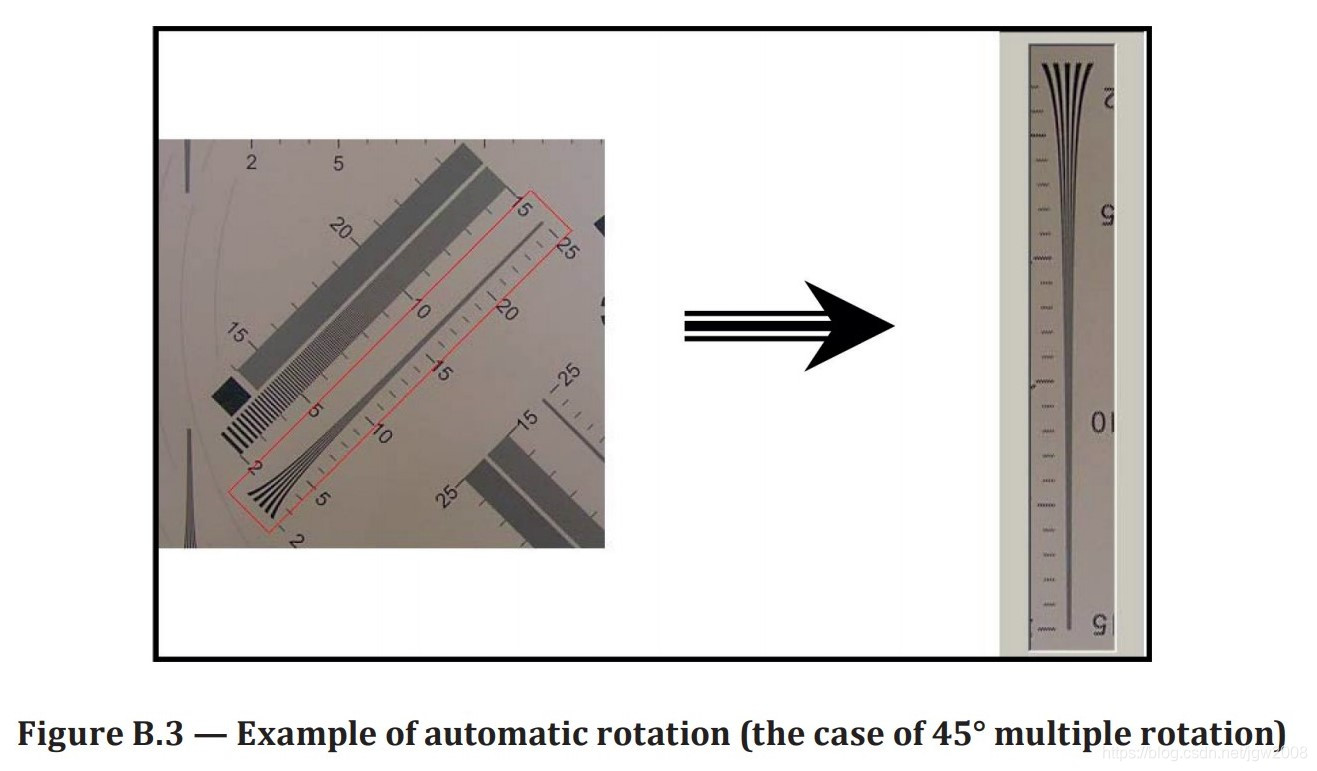
4) HYResACE measures the visual resolution in four directions: horizontal, vertical, +45°, and –45°. The user only needs to specify the direction of the wedge when executing the image trimming process, as shown in Figure B.3.
4) HYResACE在四个方向上测量视觉分辨率:水平、垂直、+45°, 和–45°. 用户只需在执行图像修剪过程时指定楔块的方向,如图B.3所示。
B.4 The outline of the software processing 软件处理概述
B.4.1 Main process 主要流程
HYResACE detects the length of the wedge from the selected ROI and the position of the visual resolution limit line on the wedge in integer pixel units. To find these, a subprocess named “black line detection”, described below, is applied to each scan line sequentially. “Black line detection” is a process which simulates human visual perception of the wedge pattern.
HYResACE从选定的ROI中检测楔块的长度,并以整数像素为单位检测楔块上视觉分辨率限制线的位置。为了找到这些,将下面描述的名为“黑线检测”的子进程依次应用于每个扫描线。“黑线检测”是一个模拟人类视觉感知楔形图案的过程。
NOTE This “line” is a horizontal raster scan line, not a black or white line of the wedge.
注:这条“线”是水平光栅扫描线,不是楔形的黑白线。
The reported visual resolution is easily calculated by taking the ratio of the calculated position of the resolution limit line to the overall wedge length. The correct absolute value is calculated by correcting the ratio to the actual magnification by using the wedge length and the image height (vertical pixel number) data of the original image before trimming. In this way, the magnification of the process is not required.
通过计算分辨率限制线的计算位置与整个楔形长度的比值,可以很容易地计算出报告的视觉分辨率。通过在修剪之前使用原始图像的楔形长度和图像高度(垂直像素数)数据来校正与实际放大率的比率,从而计算出正确的绝对值。这样,放大过程就不需要了。
B.4.2 Black line detection 黑线检测
One’s ability to visually distinguish white spaces from the black lines of the hyperbolic resolution wedges in Figure B.1 relies on sophisticated and complex processing in the visual cortex. This processing accommodates and adapts to low frequency luminance differences and treats them as though they are effectively uniform. For example, in the high frequency regions of the wedge, near the visual resolution limit, the signal amplitude becomes very small, and any local amplitude change in luminance at the black/white lines can be smaller than the changes in luminance at lower frequencies across the entire wedge due to the spatial frequency behaviours of the camera and/or light shading and falloff. In such cases, there is a possibility that the minimum luminance value of a pixel on a black line is greater than the value of a pixel on a white line. This could be due to either stochastic noise or shading effects. Regardless, human vision will still distinguish the black and white lines of the wedge in response to their actual line luminance changes without being affected by changes unrelated to the line detection task at hand.
一个人在视觉上区分图B.1中双曲线分辨率楔形的空白和黑线的能力依赖于视觉皮层复杂的处理。此处理适应低频亮度差异,并将其视为有效均匀的。例如,在楔形物的高频区域,接近视觉分辨率极限时,信号振幅变得非常小,并且,由于相机的空间频率行为和/或光的阴影和衰减,在黑/白线处的亮度的任何局部振幅变化可以小于在穿过整个楔形的较低频率处的亮度变化。在这种情况下,存在黑线上的像素的最小亮度值大于白线上的像素的值的可能性。这可能是由于随机噪声或阴影效应造成的。不管怎样,人类视觉仍然会根据楔块的实际线亮度变化来区分黑白线,而不会受到与手边的线检测任务无关的变化的影响。
Also, in the low frequency range of the wedge, sharpening effects can often introduce “ringing” near the black/white edges that are interpreted as luminance changes. Often, such localized changes in luminance are much larger than the amplitude of the wedge image near the high frequency portion where the visual resolution limit is measured. In such cases, as long as the amplitude due to ringing is sufficiently small compared to the luminance amplitude of the wedge image at the low frequencies, human perception will filter and ignore it. In addition, human vision often ignores other noise sources (e.g. stochastic noise, etc.) in the image when they are sufficiently small. In summary, human vision often ignores luminance changes due to low and high frequency noise when a particular task, like line detection, is required. It is as though a spatially matched filter is imposed that allows the viewer to ignore absolute luminance changes that are irrelevant to the task at hand, namely line detection. The
black line detection algorithm is able to simulate this process.
此外,在楔形的低频范围内,锐化效果通常会在被解释为亮度变化的黑白边缘附近引入“振铃”。通常,这种局部亮度变化远大于测量视觉分辨率极限的高频部分附近楔形图像的振幅。在这种情况下,只要振铃引起的振幅与低频时楔形图像的亮度振幅相比足够小,人类的感知就会过滤并忽略它。此外,当图像中的其他噪声源(如随机噪声等)足够小时,人类视觉往往会忽略它们。综上所述,当一个特定的任务,如直线检测,需要时,人类视觉常常忽略由于低频和高频噪声引起的亮度变化。就好像施加了空间匹配滤波器,使得观看者能够忽略与手头任务无关的绝对亮度变化,即线检测。这个黑线检测算法能够模拟这一过程。
It does so in two important ways.
这有两个重要的方面。
a) Detection of a black line at a locally minimum point in the scanning line is done by inflection point detection through analysis of neighbouring point differences.
a) 通过分析相邻点的差异,通过拐点检测在扫描线的局部最小点处检测黑线。
b) Significant signal differences are judged based on a variable threshold technique that is line frequency adaptive.
b) 基于一种自适应的可变阈值技术,判断显著的信号差异。
At the start of the algorithm’s line scanning process, a suitably high threshold level is chosen to accommodate the relatively large signal levels of the low frequency portions of the wedge. This threshold is decremented as higher frequency lines are probed in an attempt to detect the specified number of black lines (i.e. five). After the specified number of black lines is detected, the process continues onto the next scan lines until all five lines can no longer be detected using the same threshold level. At this point, the threshold level is decremented and the scan line under consideration is again analysed with the new threshold. If all five lines can still not be detected with this new threshold, the processing ceases and the visual resolution limit is reached.
在算法的线扫描过程开始时,选择适当的高阈值电平来适应楔形的低频部分的相对较大信号电平。当探测到更高频率线以检测指定的黑线数(例如5)时,该阈值将被减小。检测到指定的黑线数后,该过程将继续到下一个扫描行,直到无法使用相同的阈值级别检测到所有五行。此时,阈值电平被降低,并用新的阈值再次分析所考虑的扫描线。如果仍然无法使用此新阈值检测到所有五行,则处理停止,并且达到视觉分辨率限制。
B.4.3 Image rotation process 图像旋转过程
HYResACE operates on the data assuming that the main scanning direction crosses a hyperbolic wedge perpendicularly. In other words, the basic measurement process operates on the horizontal resolution wedge. The vertical and 45° slanted resolution measurements are performed by rotating the captured wedge images before performing the measurement.
假设主扫描方向与双曲楔体垂直相交,HYResACE对数据进行操作。换句话说,基本的测量过程是在水平分辨率上进行的。垂直和45° 倾斜分辨率测量是通过在执行测量之前旋转捕获的楔形图像来执行的。
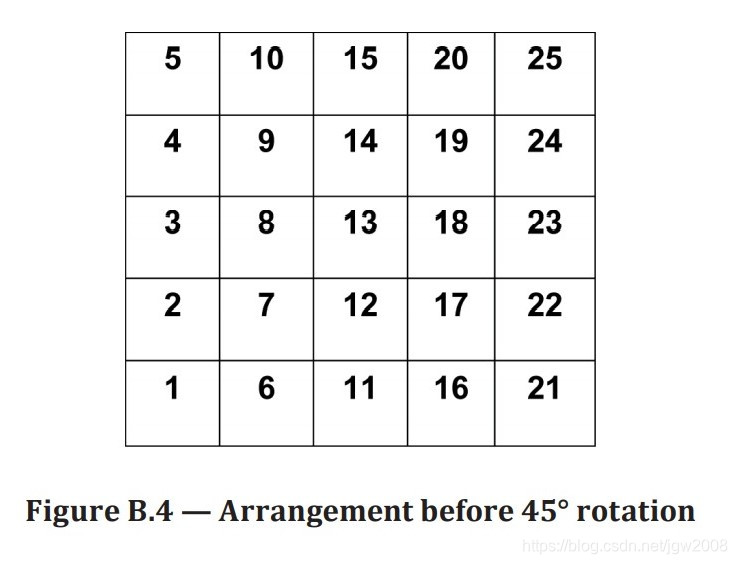
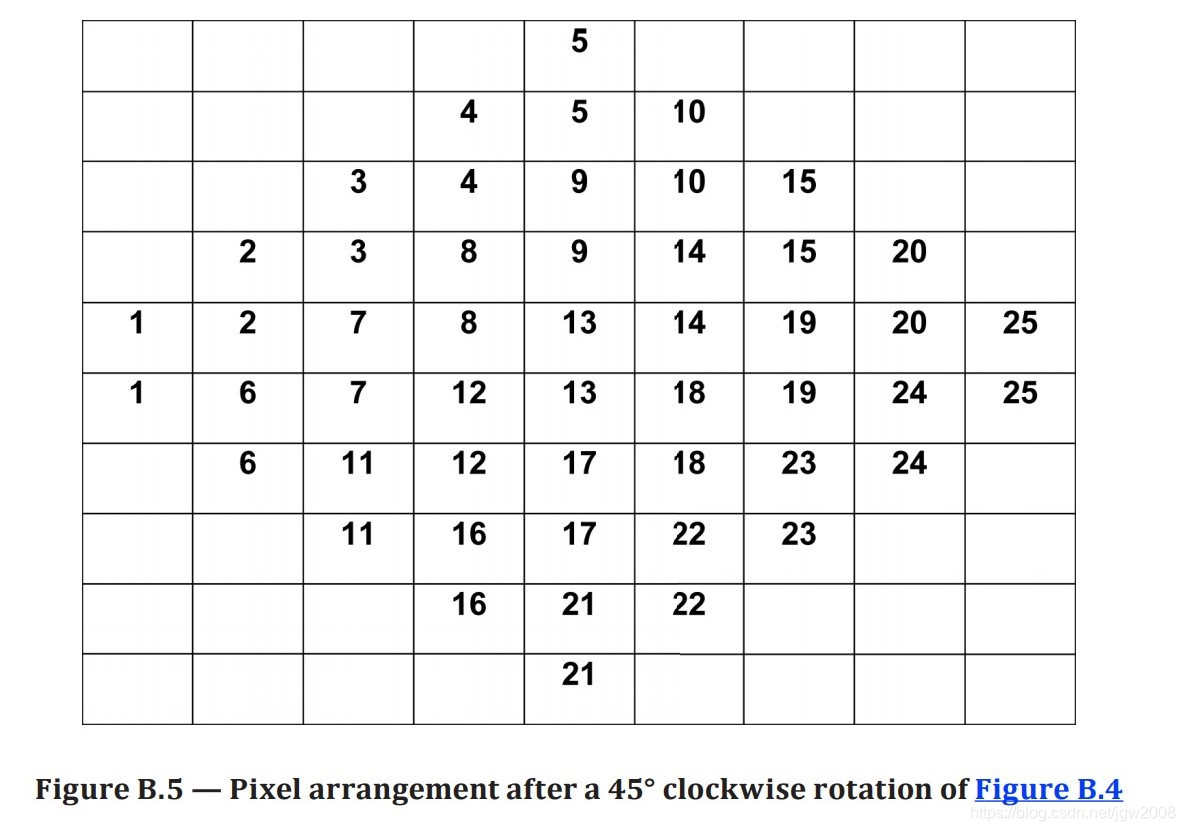
The 90° rotation is a simple coordinate change and does not apply interpolation to generate new pixel values. Nearest neighbour interpolation is applied to fill vacant pixels with existing pixel values without creating new numerical values for the 45° (or its multiple) rotation. This is shown in Figures B.4 and B.5.
90° 旋转是一个简单的坐标更改,不应用插值来生成新的像素值。45°旋转(或它的倍数),最近邻插值使用现有像素值填充空白像素,而不应为像素创建新的数值 。如图B.4和B.5所示。
Because a 45° rotation increases the relative size of the image (as shown in Figure B.5), compensation for this factor is necessary in calculating resolution. HYResACE automatically compensates for this factor as required.
因为45° 旋转会增加图像的相对大小(如图B.5所示),在计算分辨率时需要对该因素进行补偿。HYResACE会根据需要自动补偿此因素。
Annex C(informative) Low contrast edge SFR test chart with OECF patches 附录C(资料性附录)带OECF补丁的低对比度边缘SFR测试图
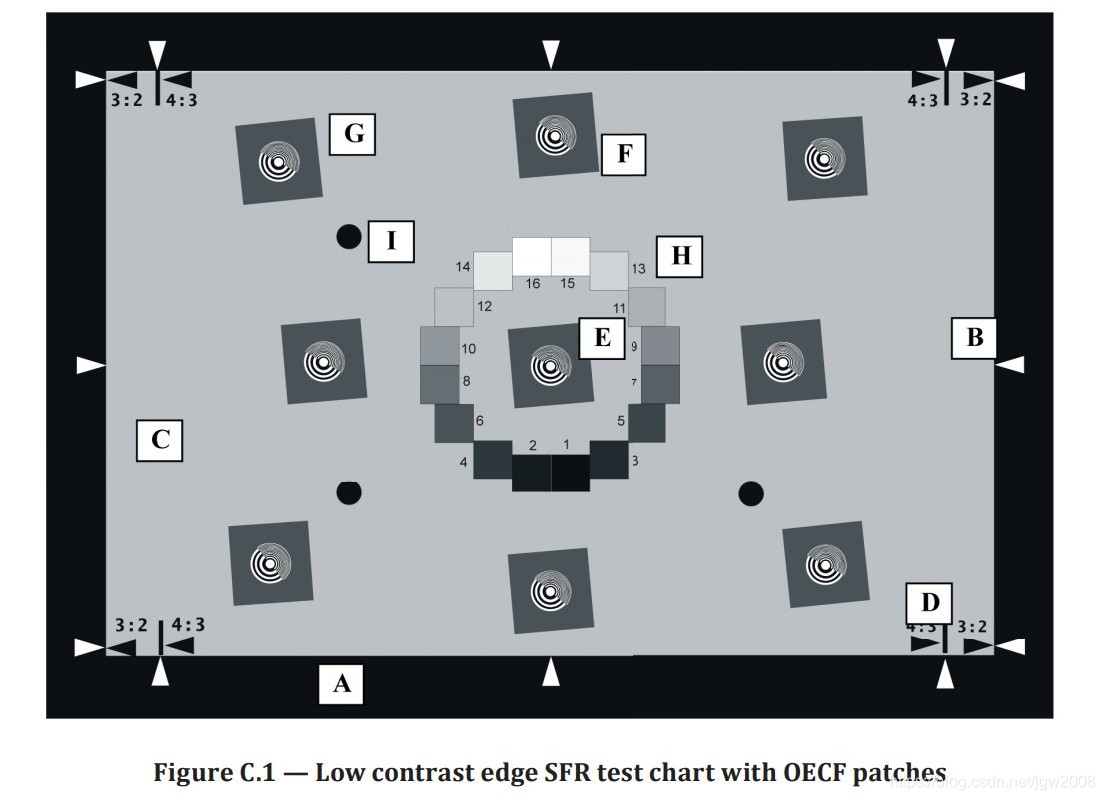
A lower contrast SFR test chart is used based on experiences from ISO 12233:2000 target shown in Figure I.1. The high contrast edge features of ISO 12233:2000 target often yielded clipped count values in the final image file, especially for processed image files. This led to corrupted and variable SFR results. The lack of OECF patches in the original target also made it inconvenient to account for the OECF response without a separate capture. The revised test chart is shown in Figure C.1 and defined in Table C.1. It is a grey scale test chart which includes a low modulation slanted edge. The test chart also includes grey scale patches which are used to determine the OECF. While the example chart in Figure C.1 uses 16 OECF test patches, a 20 patch version as described in ISO 14524 may also be substituted.
根据图I.1所示ISO 12233:2000目标的经验,使用低对比度SFR测试图。iso12233:2000目标中的高对比度边缘特征通常会在最终图像文件中产生处理的记录,特别是对于处理过的图像文件。这导致SFR结果损坏和可变。原始目标中缺少OECF补丁也使得在没有单独捕获的情况下很难解释OECF响应。修改后的试验图表如图C.1所示,并在表C.1中进行了定义。这是一个灰度测试图,其中包括一个低调制斜边。测试图还包括用于确定组织环境足迹的灰度图。虽然图C.1中的示例图表使用16个OECF测试补丁,但也可以替换ISO 14524中描述的20个补丁版本。
| Code 编号 | Characteristics and application 特点及应用 |
| A | Black border with inner edge which defines active target area 带内边缘的黑色边框,用于定义活动目标区域 |
| B | White framing arrows used to frame target horizontally or vertically 用于水平或垂直框定目标的白色框架箭头 |
| C | Active target area. The integrated reflectance (or transmittance) of the area within the 4:3 aspect ratio bounds (RL) shall be between 0,15 and 0,25. 活动目标区域。4:3纵横比界限(RL)内区域的综合反射率(或透射率)应在0.15和0.25之间。 |
| D | Framing lines and arrows that define 4:3 and 3:2 aspect ratios 定义4:3和3:2纵横比的框架线和箭头 |
| E | Centre slanted edge square (5°) with focusing aid to provide on-axis SFR metrology. This feature shall be of sufficient size to satisfy the 32 frequency sample requirement of 8.3.2 for a 640 × 480 pixel dimension of the active area. It shall be centred within the active area. The modulation contrast shall be between 0,55 and 0,65. 中心斜边正方形(5°) 借助聚焦辅助装置提供轴上SFR计量。该特征应具有足够的尺寸,以满足8.3.2中针对640x480像素尺寸活动区域的32倍频率样本的要求。它应位于活动区域的中心。调制对比度应在0.55和0.65之间。 |
| F | Slanted edge squares used to measure SFR at 50 % field position for 4:3 aspect ratio. This feature shall be of sufficient size to satisfy the 32 frequency sample requirement of 8.3.2 for a 640 × 480 pixel dimension of the active area. There shall be four of these features, two centred horizontally and two centred vertically on either side of the feature E. A 5 % positional tolerance relative to the 50 % field position is allowed. The modulation contrast shall be between 0,55 and 0,65. 斜边正方形用于在50%视场位置测量SFR,宽高比为4:3。该特征应具有足够的尺寸,以满足8.3.2中针对640x480像素尺寸活动区域的32倍频率样本的要求。这些特征应有四个,两个水平居中,两个垂直居中,位于特征E的两侧。相对于50%的现场位置,允许有5%的位置公差。调制对比度应在0.55和0.65之间。 |
| G | Slanted edge squares used to measure SFR at 70 % field position for 4:3 aspect ratio. This feature shall be of sufficient size to satisfy the 32 frequency sample requirement of 8.3.2 for a 640 × 480 pixel dimension of the active area. There shall be four of these features positioned on the active area diagonals as shown in Figure C.1. A 5 % positional tolerance relative to the 70 % field position is allowed. The modulation contrast shall be between 0,55 and 0,65. 斜边正方形用于在70%视场位置测量SFR,宽高比为4:3。该特征应具有足够的尺寸,以满足8.3.2中针对640x480像素尺寸活动区域的32倍频率样本的要求。如图C.1所示,活动区域对角线上应有四个这些特征。相对于70%的现场位置,允许有5%的位置公差。调制对比度应在0.55和0.65之间。 |
| H | OECF patches whose reflectances, circular symmetry, and geometric order are consistent with the requirements in ISO 14524. Due to space limitations, the patch sizes should be scaled to fit within the active area without interfering with the slanted edge features. The OECF patches should be numbered as indicated in Figure C.1. 反射、圆对称性和几何顺序符合ISO 14524要求的OECF补丁。由于空间限制,应缩放补丁大小以适应活动区域,而不干扰斜边特征。OECF补丁应按图C.1所示进行编号。 |
| I | Asymmetric features for automatic target detection. These features should be placed within the 4:3 active area aspect ratio, but can be placed for convenience as dictated by use cases. 自动目标检测的不对称特征。这些特性应该放置在4:3的活动区域宽高比范围内,但是可以根据用例的要求方便地放置。 |
Annex D (normative) Edge spatial frequency response (e-SFR) algorithm 附录D(规范性附录)边缘空间频率响应(e-SFR)算法
The software that performs this measurement can be accessed from www.iso.org/12233.
执行此测量的软件可以从www.iso.org/12233访问.
The edge-based SFR (e-SFR) measurement algorithm used in this document for analysis of the low contrast tilted edge uses the normalized discrete Fourier transform (DFT) of a single line spread function (LSF):
本文中用于分析低对比度倾斜边缘的基于边缘的SFR(e-SFR)测量算法使用单线扩展函数(LSF)的归一化离散傅里叶变换(DFT):
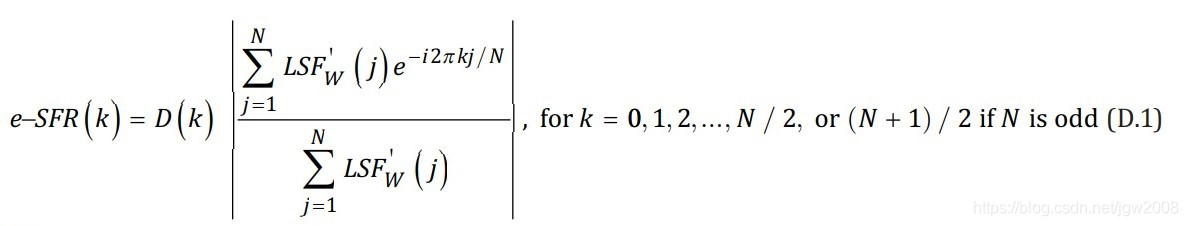
k is the index for spatial frequency;
k是空间频率的指数;
LSF'w is the windowed, average, centred, super-sampled line spread function formed from the selected region of the chart image; much of the data processing in the algorithm and employed in the SFR measurement algorithm is involved in preparing LSF'w for the DFT;
LSF'w是从图表图像的选定区域形成的加窗、平均、居中、超采样线扩展函数;该算法和SFR测量算法中的大部分数据处理都涉及到DFT的LSF'w的准备;
D ( k) is the correction for the frequency response of the discrete derivative used to derive the point spread function from the edge spread function,
D ( k)是对离散导数频率响应的校正,用于从边缘扩展函数导出点扩展函数,
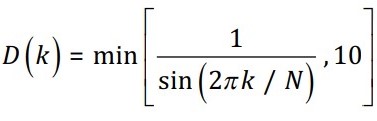
The SFR measurement algorithm does not constrain the selection region to be an even number of pixels (P) and rows (R). The selected region is converted from digital code values to an edge spread image of normalized photopic intensities via the OECF and colour weighting coefficients a, b, and c [see Formula (D.2)].
SFR测量算法不限制选择区域为偶数像素(P)和行(R)。通过OECF和颜色加权系数a、b和c[参见公式(D.2)],将所选区域从数字码值转换为归一化明视强度的边缘扩展图像。

DN is the digital output level;
DN是数字输出电平;
(p, r) is the index of each pixel.
(p,r)是每个像素的索引。
Each row (r) of the edge spread image is an estimate of the camera edge spread function (ESF). Each of these ESFs is differentiated to form its discrete line spread function (LSF). The position of the centroid (C) of each r LSF is determined along the continuous variable x, where x has the range (1, X) [see Formula (D.3)].
边缘扩展图像的每一行(r)是相机边缘扩展函数(ESF)的估计。每一个ESF被区分形成它的离散线扩展函数(LSF)。每个r LSF的质心(C)的位置沿连续变量x确定,其中x具有范围(1,x)[见公式(D.3)]。
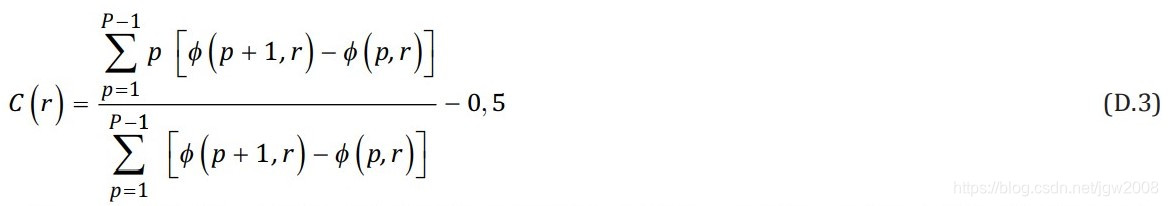
The slope, m, of the best-fit line relating the x positions of the centroids to the r index of each row is computed as follows
将质心的x位置与每行的r索引相关的最佳拟合线的斜率m计算如下

where the bar indicates the average, and Δr = 1 row.
其中条形图表示平均值,以及Δr=1行。
This slope, m, is used to compute a shift, S(r), to be applied to each row to bring each ESF to coincidence around a common origin at x = 0. It effectively takes the tilt out of the edge.
这个斜率m用于计算位移S(r),该位移S(r)将应用于每一行,以使每个ESF在x=0的公共原点附近重合。它有效地消除了边缘的倾斜。

The next step is the super sampling and averaging. This step forms a composite requantized edge spread function (ESF) over the discrete variable j, where j is four times more finely sampled than p but is not a continuous variable like x. The super sampling factor is 4, so 4PX bins are created, each with a width of 1/4 pixels.
下一步是超级采样和平均。该步骤在离散变量j上形成复合的重新标定边扩展函数(ESF),其中j比p采样精细4倍,但不是像x那样的连续变量。超级采样因子是4,因此创建了4PX箱子图,每个箱子图的宽度为1/4像素。
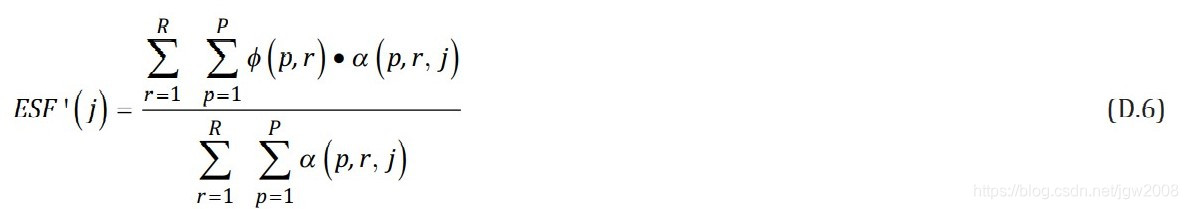
The function alpha (α) is simply a counter and a switch to include or exclude a value in any bin.
函数alpha(α) 只是一个计数器和一个开关,用于包含或排除任何bin中的值。
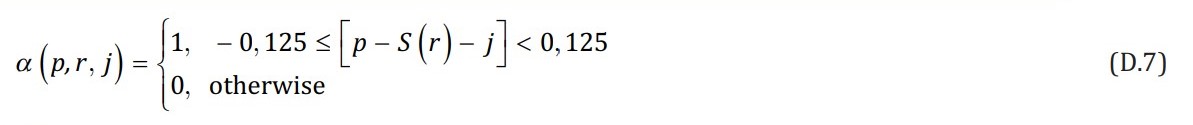
j is an integer.
j是一个整数。
The average super-sampled edge spread function is then differentiated and windowed.
然后对平均超采样边缘扩展函数进行微分和加窗。

The first and last values of the computed LSF are then repeated, so the LSF vector has a length N = 4P (4X)
然后重复计算的LSF的第一个和最后一个值,因此LSF向量的长度N=4P(4X)

Substitution of Formula (D.8) into Formula (D.1) produces SFR(f), where f = k/X, so that the data are reported in cycles/pixel.
将公式(D.8)代入公式(D.1)产生SFR(f),其中f=k/X,因此以周期/像素报告数据。
To report the data in frequency units of LW/PH, multiply the frequency values by the number of rows of pixels per image height (for vertical SFR measurements) or by the number of columns of pixels within a horizontal distance equal to the image height (for horizontal SFR measurements).
要以LW/PH为频率单位报告数据,请将频率值乘以每个图像高度的像素行数(对于垂直SFR测量)或等于图像高度的水平距离内的像素列数(对于水平SFR测量)。
To report the data in frequency units of cycles per millimetre on the image sensor, the frequency values are multiplied by 1/2 times the number of rows of photosites per millimetre on the sensor (for vertical SFR measurements) or 1/2 times the number of columns of pixels per millimetre on the sensor (for horizontal SFR measurements).
为了在图像传感器上以每毫米周期的频率单位报告数据,频率值乘以传感器上每毫米照片行数的1/2倍(对于垂直SFR测量)或传感器上每毫米像素列数的1/2倍(对于水平SFR测量)。
To report the data in frequency units of cycles per millimetre on the test chart, the frequency values are multiplied by the number of rows of photosites on the sensor divided by the height of the active area of the test chart (for vertical SFR measurements) or by the number of columns of pixels on the sensor divided by the width of the active area of the test chart (for horizontal SFR measurements).
在试验图表上以每毫米周期的频率单位报告数据,频率值乘以传感器上的照片行数除以测试图的活动区域高度(对于垂直SFR测量),或乘以传感器上的像素列数除以测试图的活动区域宽度(对于水平SFR测量)。
A diagram depicting the key steps of the e-SFR algorithm is shown in Figure D.1.
图D.1显示了e-SFR算法的关键步骤。
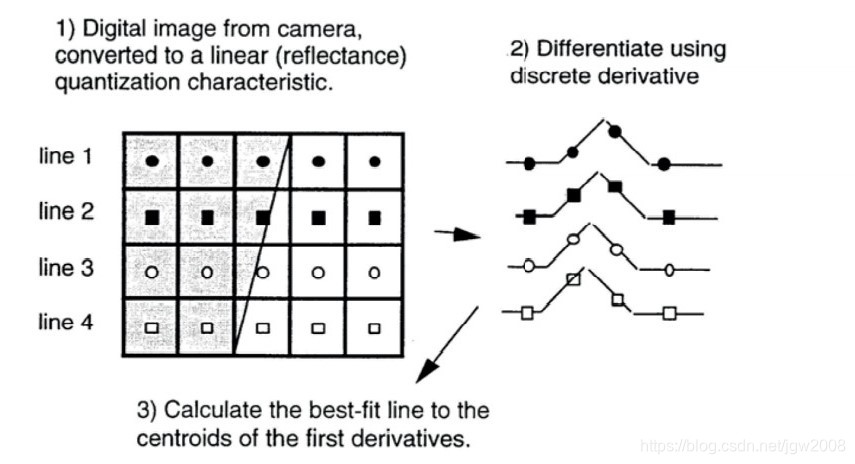
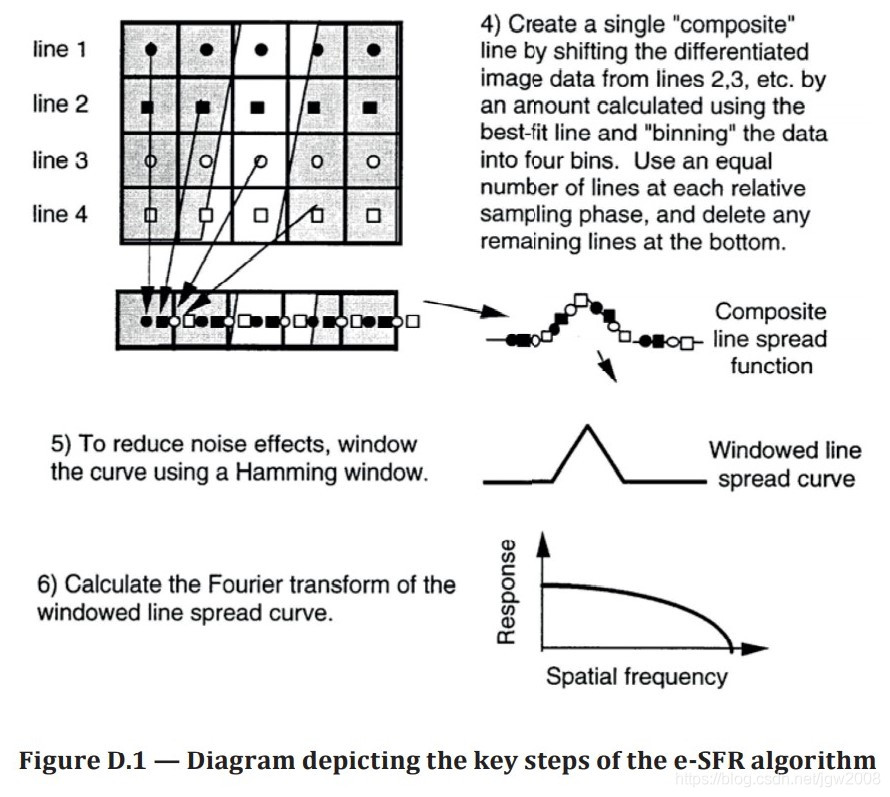
Annex E (normative) Sine wave star test chart 附录E(规范性附录)正弦波星形试验图
The sine wave star test chart shown in Figure E.1 can be used as a single chart or multiple charts can be arranged in one image. The chart should be grey. The camera should be white balanced prior to the measurement.
图E.1中所示的正弦波星形测试图可以作为一个图表使用,也可以在一个图像中排列多个图表。图表应该是灰色的。在测量之前,摄像机应该是白平衡的。
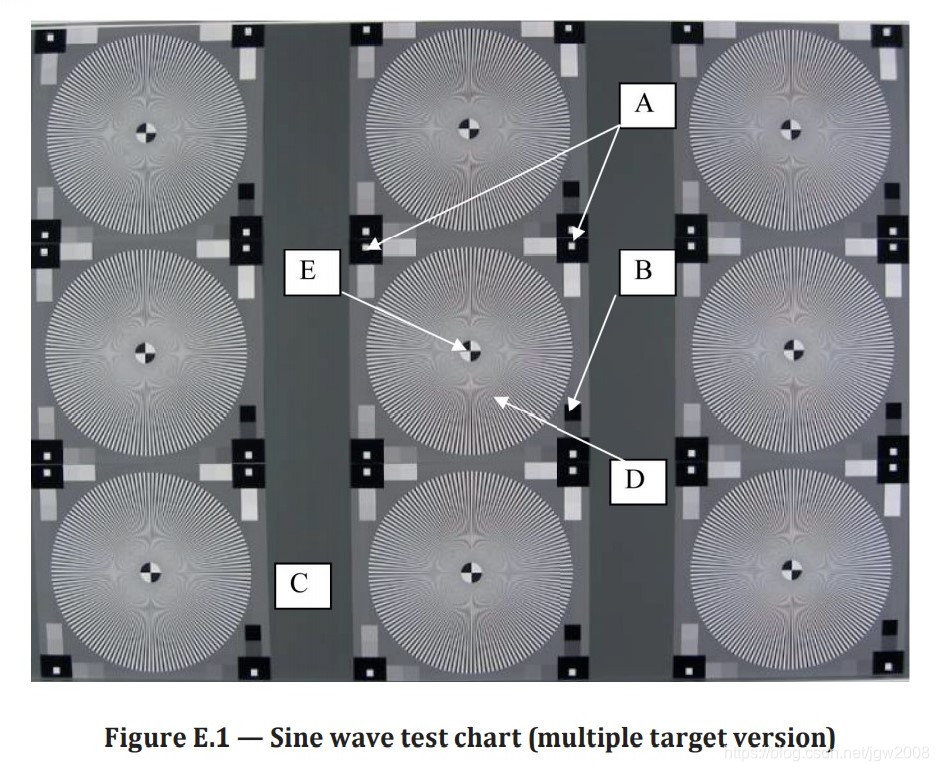
The chart includes the features listed in Table E.1.
图表包括表E.1中列出的特性。
| Code 编号 | Application 应用 | 特点 |
| A | Markers for the region of interest 感兴趣区域的标记 | Black squares with a smaller white square inside 内有较小的白色正方形的黑色正方形 |
| B | 16 grey patches for linearization 16个灰色图卡用于线性化 | Squares aligned along the ROI markers equally spaced in reflection from white to max. black 沿ROI标记对齐的正方形,在反射中从白色到最大黑色等距排列 |
| C | Background 背景 | The background should have a reflection of 18 %. 背景应具有18%的反射。 |
| D | Sine wave star 正弦波星 | The star should be a sine wave (in reflection) modulated starburst pattern with a frequency of typically 144 cycles. For lower resolution cameras, a 72-cycle star can be used. 星图应该是正弦波(反射)调制的星暴模式,频率通常为144个周期。对于低分辨率相机,可以使用72周期的星。 |
| E | Centre marker for the exact positioning of the star 用于精确定位星图的中心标记 | A circle with two white and two black segments opposite to each other. The size of the circle should be chosen to cover the area that should not be used due to the lack of resolution of the output system used to produce the star. 两个白色和两个黑色部分相对的圆。选择圆的大小应该覆盖不使用的区域,因为用于产生星图的输出系统缺乏分辨率。 |
The charts are limited in their application because of the production method used to generate the chart. Therefore, the manufacturer should report the maximum number of pixels the chart shall cover in an image.
由于生成图表所用的生产方法,图表的应用受到限制。因此,制造商应报告图表在图像中应覆盖的最大像素数。
The given sizes are scaled to a chart width of 29 cm and a height of 27 cm. The diameter of the starburst pattern is 25 cm. If the design is carried out in a vector-based software, it is possible to scale the chart to any size required, keeping production and application limits in mind. The contrast of the structures should be above 50:1 and below 250:1 reflectance ratio. A listing of the design features of the sine wave star test chart can be found in Table E.2.
给定的尺寸被缩放成29厘米宽和27厘米高的图表。星暴图的直径是25厘米。如果设计是在基于矢量的软件中进行的,则可以将图表缩放到所需的任何大小,同时牢记生产和应用限制。结构的对比度应在50:1以上,反射率比应在250:1以下。正弦波星形测试图的设计特征列表见表E.2。
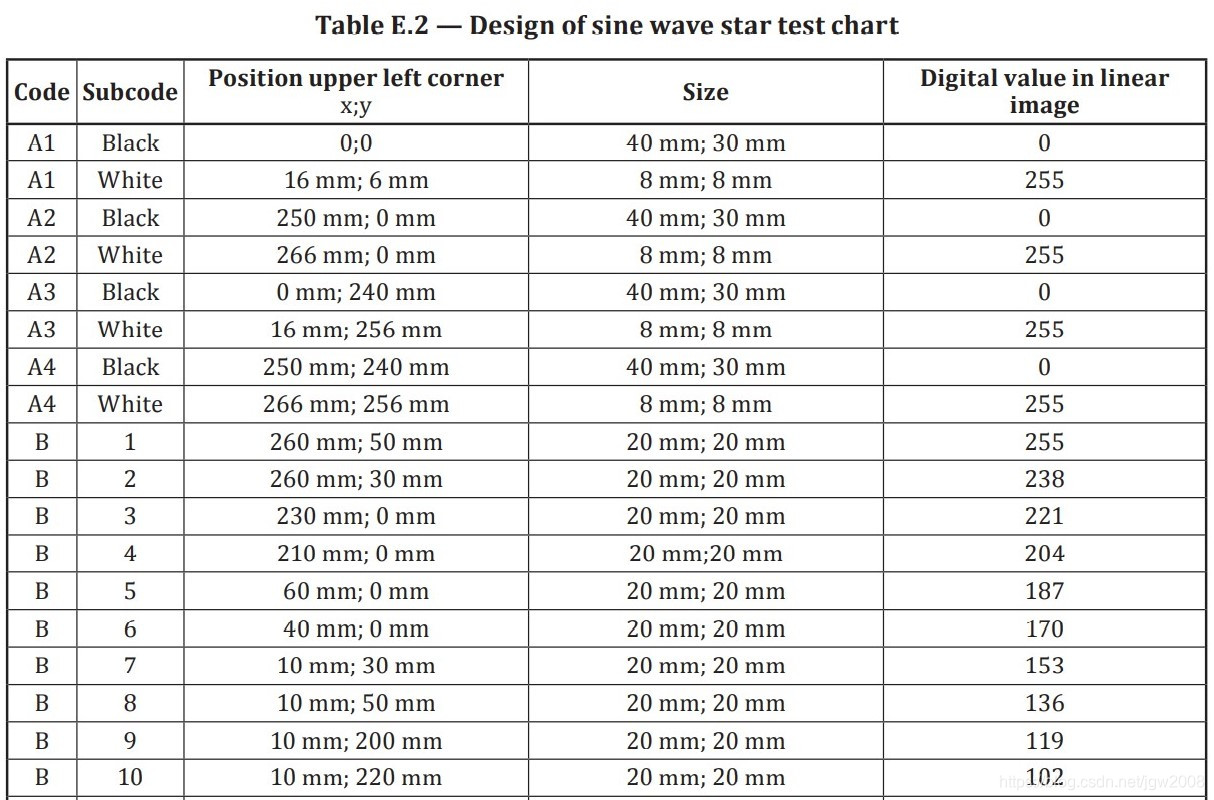
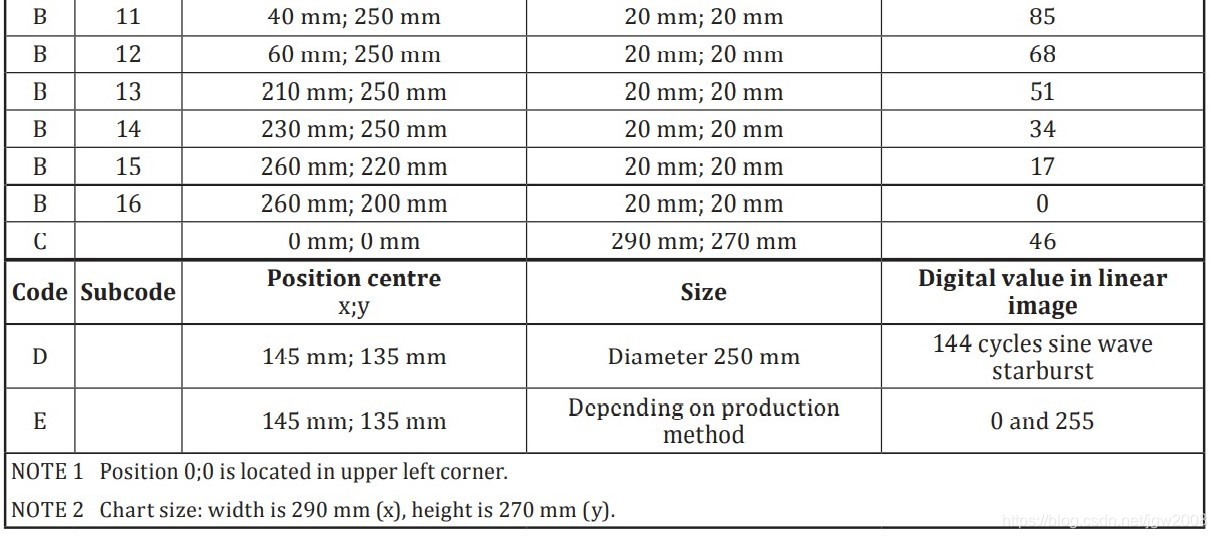
Annex F (normative) Sine wave spatial frequency response (s-SFR) analysis algorithm 附录F(规范性附录)正弦波空间频率响应(s-SFR)分析算法
An executable version of software has been developed to perform measurements using this test chart. The software, which was created using Matlab®3), can be accessed from www.iso.org/12233. The software can report the results from a single image or can average the results from numerous images. The star is divided into a user-selected number of segments (typically eight segments) for analysis. The user selects the area of the captured image that contains the chart, with the lightest patch in the upper right corner. The result shows the modulation versus frequency (in LP/PH) for each of the segments.
一个可执行版本的软件已经开发,以执行测量使用这个测试图表。该软件使用Matlab®3)创建,可以从www.iso.org/12233访问。该软件可以报告单个图像的结果,也可以对多个图像的结果进行平均。星形被划分为用户选择的若干段(通常为8段)以供分析。用户选择包含图表的捕获图像区域,最轻的补丁位于右上角。结果显示了每个片段对频率的调制(在LP/PH)。
The Siemens star elements are identified using the marks in the corners and the centre of each star. Then, the OECF of the camera is determined using the 16 grey patches of the central star. The image is linearized using the inverse of the OECF. See Figure F.1.
西门子星形元件是用每个星形的角和中心的标记来识别的。然后,利用中心星的16个灰度斑块确定相机的OECF。利用OECF的逆将图像线性化。参见图F.1。
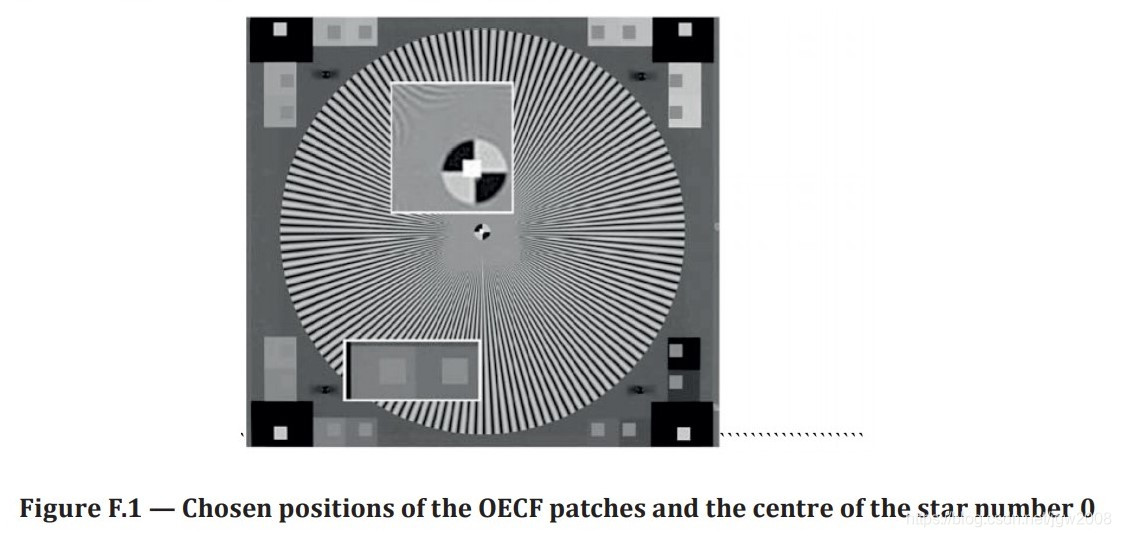
From the diameter of the stars and the image height, the scale is determined to translate the star frequency into line pairs per picture height (LP/PH). See Table H.1 for conversion between different resolution metrics.
从星状图的直径和图像高度确定尺度,将星状图的频率转换为每幅图像高度的线对(LP/PH)。不同分辨率指标之间的转换见表H.1。
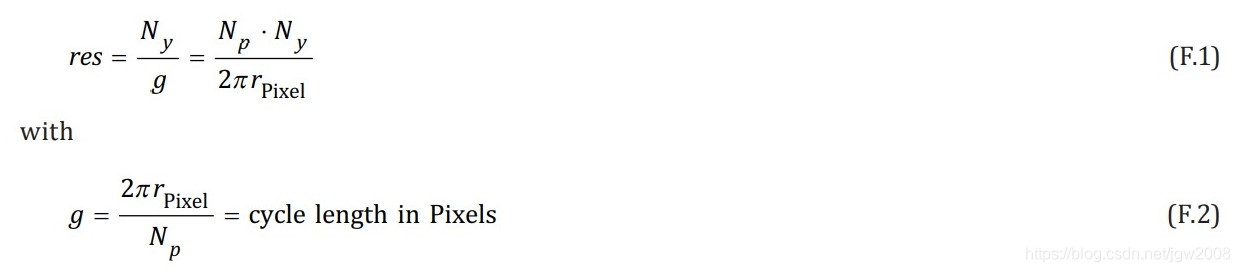
res is the resolution, in LP/PH;
res 为分辨率,单位LP/PH;
Np is the number of cycles for the Siemens star;
Np 是Siemens星内的圆圈数;
Ny is the image height in pixel;
Ny 为图像高度,以像素为单位;
rPixel is the radius of the circle (from the centre of the star).
rPixel是圆的半径(距离星状图中心)。
NOTE To get LW/PH, the above result needs to be multiplied by 2. See Table I.1.
注:LW/PH需要乘以2。见表I.1。
To correct for a possible distortion, the star is divided into 24 segments, and for each segment, the boundary of the star is detected. The appropriate radii for the evaluation (Figure F.2) of the stars are calculated. These calculated radii are corrected with a factor depending on the irregular circular shape which was found for the single star. This way, a distortion can be corrected without modification of the image itself.
为了纠正可能出现的失真,星状图被分成24个部分,每个部分都检测到恒星的边界。计算出合适的评价半径(图F.2)。这些计算出的半径被修正为一个因子,这个因子依赖于单星发现的不规则圆形形状。这样,失真就可以在不修改图像本身的情况下得到纠正。
Then, the star is divided into 24 segments. In one segment on one single radius, the nearest pixels to that radius are searched, and the digital value and the angle under which the pixel was found are stored. There is no interpolation for pixel values on the radius. Instead of using interpolation methods, the nearest pixel beside the correct radius position is used, if there is no pixel in the exact place (Figure F.3). This leads to lower errors in the result than pixel value interpolation. The mean value of the data of three segments is calculated. So finally, data of eight segments are obtained. This provides information on vertical, horizontal, and diagonal contrast behaviour of the cameras.
然后,星状图被分成24个部分。在单个半径上的一个段中,搜索最接近该半径的像素,并存储该像素被发现时的数字值和角度。半径上的像素值没有插值。如果在正确的位置上没有像素,则使用离正确半径位置最近的像素,而不是使用插值方法(图F.3)。这将导致比像素值插值更低的结果误差。计算三段数据的平均值。最后得到八个分段的数据。这提供了有关相机的垂直、水平和对角对比行为的信息。
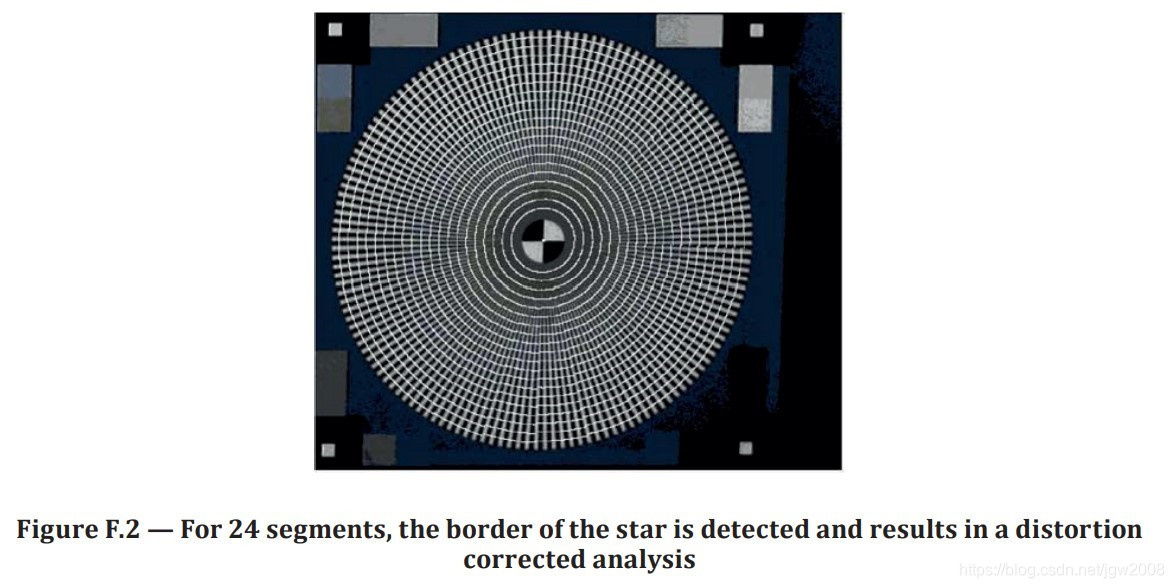
For the s-SFR measurement, a minimum of four images of the test chart described in Annex E shall be evaluated and averaged. Using the software which can be accessed from www.iso.org/12233, the star can be divided into a user-selected number of segments (typically eight). For each segment, a minimum of 32 equally spaced radii should be analysed.
对于s-SFR测量,应对附录E中描述的测试图表的至少四幅图像进行评估并取平均值。使用可以从www.iso.org/12233访问的软件,星星可以被分成用户选择的部分(通常是8个)。对于每一段,应分析最少32个等间距半径。
The following is a detailed description of the steps taken by the analysis.
下面是分析所采取的步骤的详细描述。
Step 1: The star is located using the four surrounding markers for the region of interest.
步骤1:用四个周围的标记来定位感兴趣的区域。
Step 2: The image is linearized using the 16 grey patches around the star.
步骤2:使用星状图周围的16个灰色斑块对图像进行线性化。
Step 3: A user-selectable segmentation of the star is made.
步骤3:对星状图进行用户可选择的分割。
Step 4: A minimum of 32 radii are analysed by localizing the pixels along the radius and selecting the digital code values for the linearized image as a function of the angle (see Figure F.4).
步骤4:最小的32个半径分析,沿着半径定位像素,并选择线性化图像的数字编码值作为角度的函数(见图F.4)。
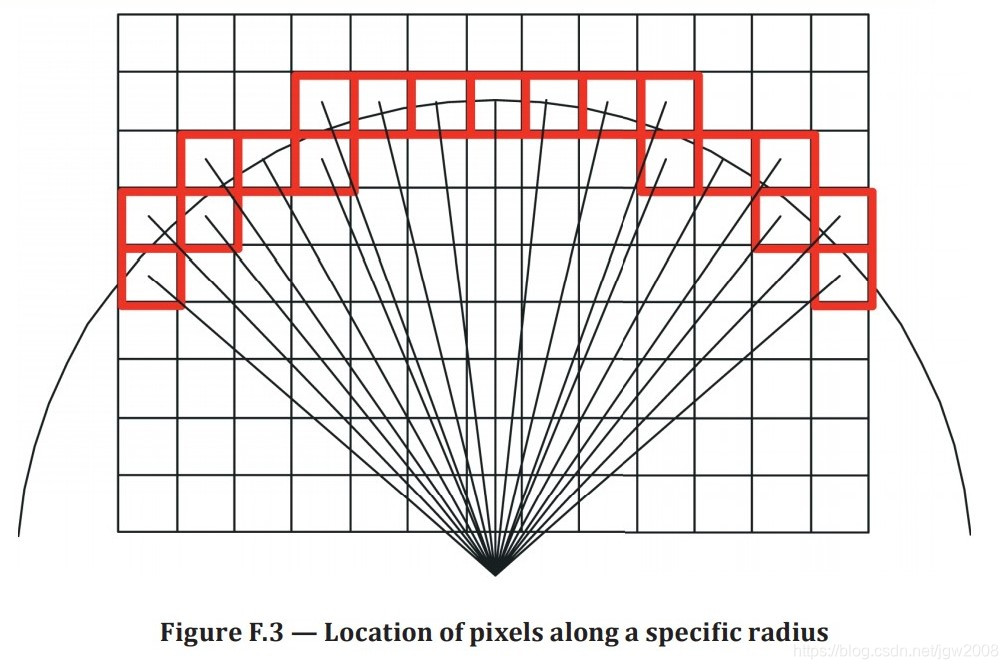
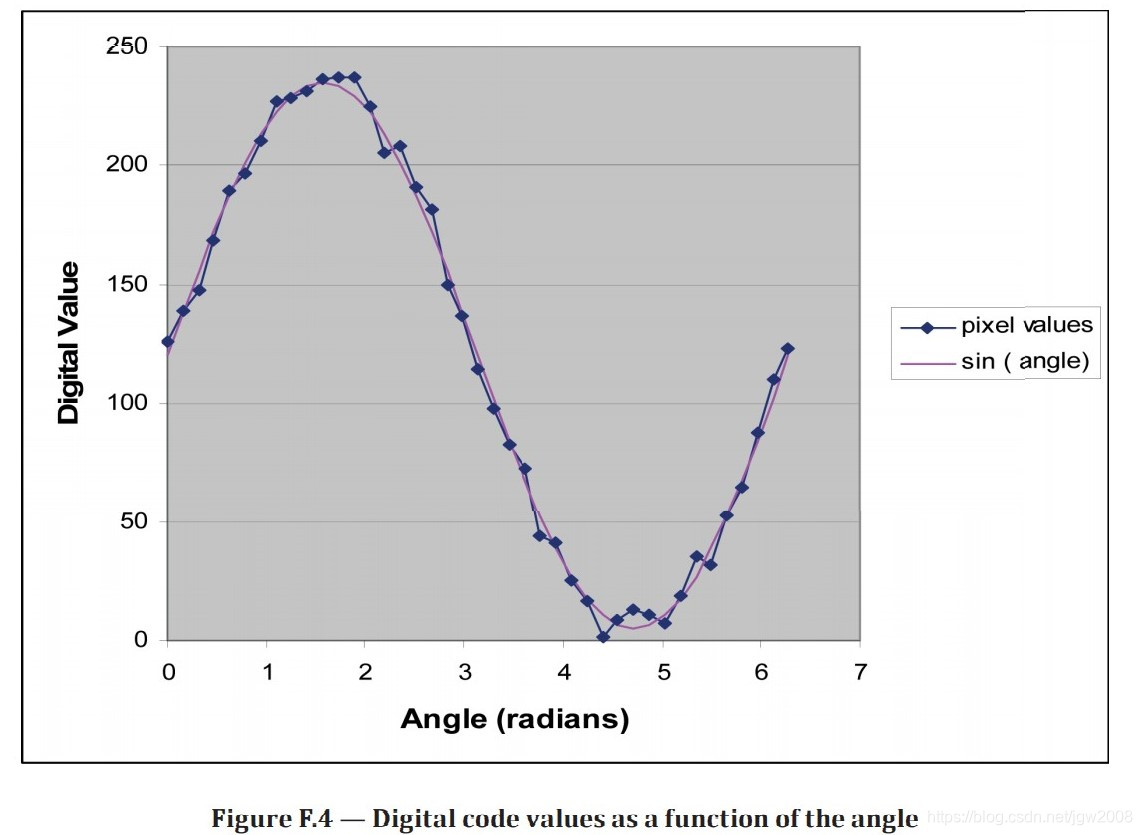
For a harmonic Siemens star, the intensity is given as:
对于谐波西门子星,其强度为:

The angle for each pixel can be calculated using
每个像素的角度可以使用

with x = 0 and y = 0 as the centre of the star. Since the phase of the signal, ϕ0 , is not known, Formula (F.5) has to be used instead of Formula (F.3).
以x = 0 y = 0为中心。由于信号的相位ϕ0不知道,因此用公式(F.5)代替公式(F.3)。
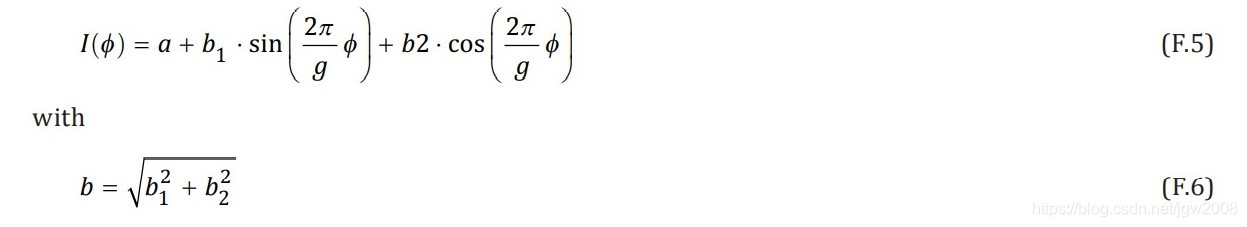
Step 5: A sine curve with the expected frequency is fitted into the measured values by minimizing the square error.
步骤5:通过最小化平方误差,将期望频率的正弦曲线拟合到测量值中。
Step 6: The contrast of the sine curve is determined by calculating the contrast from Figure F.5.
步骤6:通过计算图F.5的对比度来确定正弦曲线的对比度。
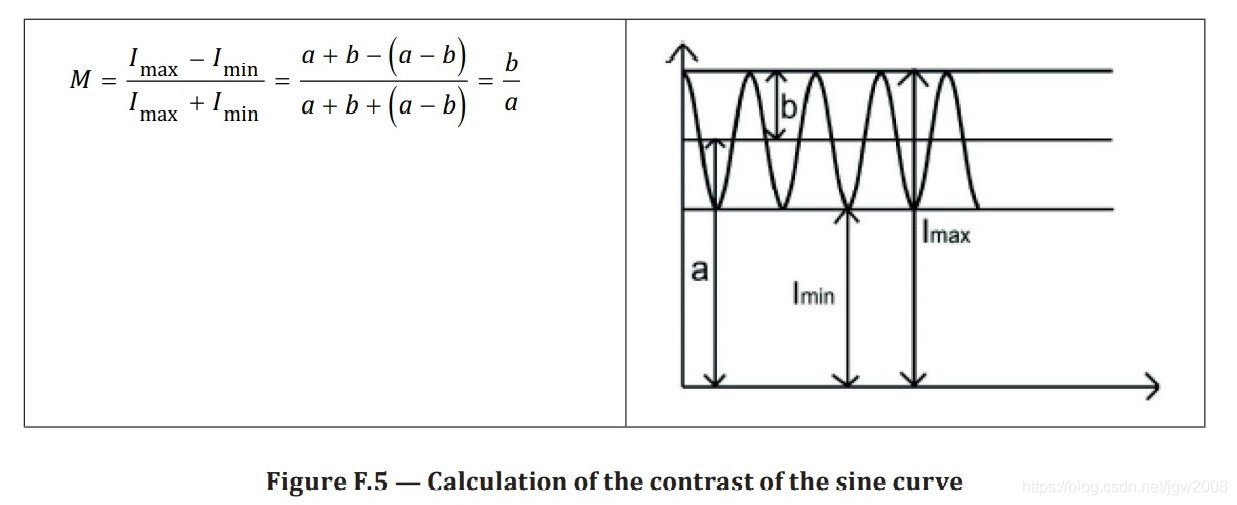
Step 7: The modulation as a function of the frequency is the result of the analysis and shall be reported as stated in 8.3.2 or 8.3.3.
步骤7:调制作为频率的函数是分析的结果,应按8.3.2或8.3.3所述报告。
Annex G (informative) Colour-filtered resolution measurements 附件G(参考性)彩色过滤分辨率测量
G.1 General 概述
Although it is well known that luminance resolution is most important, the ability to accurately render coloured details, colour textures, and coloured fabrics cannot be overlooked. This includes the ability to accurately render single-pixel colour details, as well as avoiding colour aliasing. All consumer digital cameras on the market today record in colour and the scenes people are photographing are usually in colour. In this annex, a technique for measuring how well a camera can reproduce the details of a test scene that includes saturated colours is recommended.
虽然众所周知,亮度分辨率是最重要的,但准确渲染彩色细节、彩色纹理和彩色织物的能力也不能被忽视。这包括精确渲染单像素颜色细节的能力,以及避免颜色混叠。现在市场上所有的消费数码相机都是彩色的,人们拍摄的场景通常也是彩色的。在本附件中,建议使用一种技术来测量摄像机如何能够再现包含饱和颜色的测试场景的细节。
The proposed method is to use the standard black and white targets and their existing analysis methods (as described in this document), but have these photographed through colour separation filters. This method is easily implemented and controlled and is an easy way to isolate a camera’s ability to render modulation of patterns formed by coloured objects. By simple specification of the appropriate colour separation filters, a method is suggested that avoids the problems and variation involved in fabricating a coloured resolution target. The red colour filter, for example, produces a scene which includes saturated red patterns on a black background.
提出的方法是使用标准的黑白目标及其现有的分析方法(如本文档所述),但通过分色滤片进行拍摄。这种方法易于实现和控制,是一种简单的方法,以隔离相机的能力渲染调制模式形成的有色物体。通过简单地说明适当的分色滤光片,提出了一种避免制造彩色分辨目标所涉及的问题和变化的方法。例如,红色滤镜会在黑色背景上产生包含饱和红色图案的场景。
G.2 Choice of colour filters 彩色滤镜的选择
One set of colour filters proposed is the “Status T” filters specified in ISO 5-3:2009. Kodak Wratten4) filter sets could also be used for this application, such as numbers 29 (red), 61 (green), and 47B (blue) or the less aggressive colour separation set numbers 25 (red), 58 (green), and 47 (blue). Although these filters provide a better analysis of a camera’s ability to resolve coloured details, other filters could be used either to avoid an overly sensitive interaction with a particular camera’s internal filters or as an additional comparison aimed at increasing the range of colours considered. The colour filters used in the measurements should be reported with the results. Because these filters are chosen to separate the red, green, and blue components employed in most camera implementations, the Nyquist frequencies of the colour components can be estimated depending on the results and the particular sensor configuration.
提出的一套颜色滤镜是ISO 5-3:2009中规定的“状态T”滤镜。柯达Wratten4)滤镜组也可用于此应用,如数字29(红色)、61(绿色)和47B(蓝色),或较弱的分色组数字25(红色)、58(绿色)和47(蓝色)。虽然这些滤镜可以更好地分析相机分辨彩色细节的能力,但其他滤镜可以用于避免与特定相机内部滤镜的过度敏感交互,或者用于增加考虑的颜色范围的额外比较。测量中使用的滤色片应与测量结果一起报告。由于在大多数相机实现中,选择这些滤波器来分离红色、绿色和蓝色成分,颜色成分的奈奎斯特频率可以根据结果和特定的传感器配置进行估计。
G.3 Camera settings 摄像机设置
In these measurements, it is important to make sure that the camera’s settings are consistent. We recommend that the camera be adjusted as described in Clause 4 and the illumination used as described in 4.1. In particular, the camera should be focused on the target before the colour filters are placed in front of the camera lens either by the auto-focusing system or by selecting the focus position as described in 4.3. Using this method, the chromatic properties of the camera lens are integrated into the measurement, in addition to the sensor design and the processing algorithms. This technique best represents the typical photographic scene where a range of coloured scene content exists. White balance should also be either manually set to the illumination conditions (without the coloured filter) or set to the test chart before the filter is added to the optical path (if a pre-shutter release position is used in the camera for this function). In order to obtain sufficient signal-to-noise ratio of the test image, the exposure energy and/or camera ISO speed can be adjusted for each filter so long as the camera’s aperture does not change and the shutter speed and ISO speed settings are noted.
在这些测量中,重要的是要确保相机的设置是一致的。我们建议按第4条所述调整相机,按4.1条所述使用照明。特别是,在滤色镜被置于相机镜头前面之前,相机应该聚焦在目标上,无论是通过自动对焦系统,还是通过选择4.3中描述的聚焦位置。利用该方法,除了传感器的设计和处理算法之外,还将相机镜头的色度特性集成到测量中。这种技术最好地代表了典型的摄影场景,其中存在一系列彩色场景内容。白平衡也应该手动设置为照明条件(没有彩色滤光片),或者在滤光片添加到光路之前设置为测试图表(如果相机使用了预快门释放位置用于此功能)。为了获得测试图像足够的信噪比,只要相机的光圈不改变,并且记录快门速度和ISO速度设置,每个滤镜的曝光能量和/或相机ISO速度都可以调整。
Another option, applicable for some applications, would be to focus the camera lens on the target separately for each filter being used in the study. This method segregates the effects of the sensor and processing algorithms from the optical properties of the camera lens (by providing image signals that are optimally focused for each exposure).
另一种适用于某些应用的选择是,将相机镜头分别对准研究中使用的每个滤镜的目标。这种方法将传感器和处理算法的影响从相机镜头的光学特性中分离出来(通过提供每次曝光时最佳聚焦的图像信号)。
Annex H (informative) Units and summary metrics 附件H(信息性)单位和汇总指标
H.1 Conversions between commonly used units
LW/PH Line width per picture height 每幅图片高度的线宽
LP/mm Line pairs per millimetre 每毫米线对数
L/mm Lines per millimetre 每毫米线数
To convert from left column units to top row units, use the operation at their row/column intersection.
要将左列单位转换为顶行单位,可以使用行/列相交处的操作。
EXAMPLE 实例 5 LP/mm × 2,0 = 10,0 L/mm.
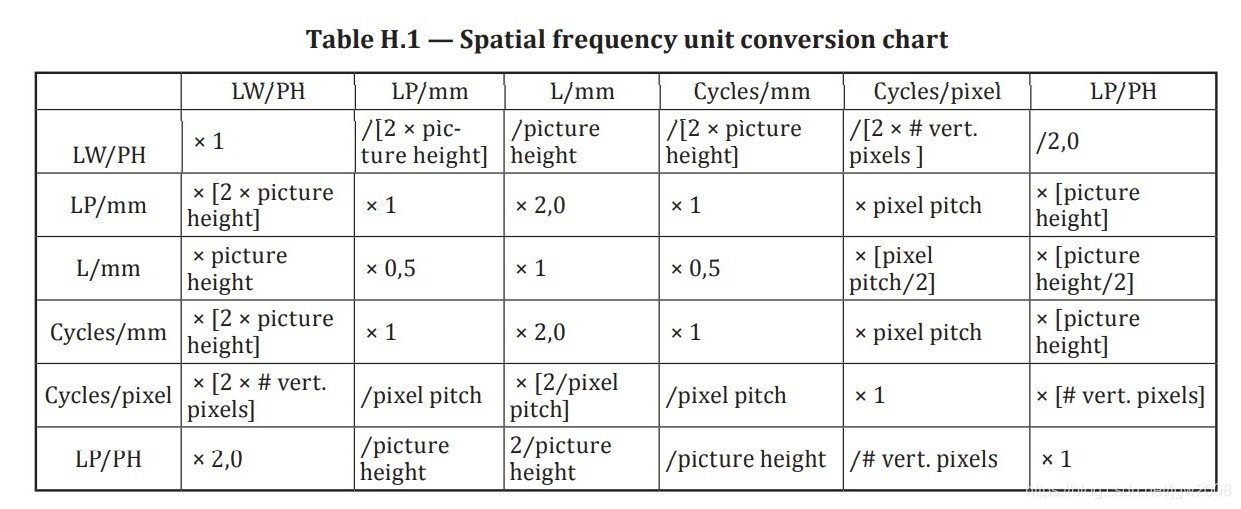
NOTE 1 The pixel pitch in the 45° diagonal direction is not the same as in the vertical and horizontal directions. Therefore, the diagonal pixel pitch is used when applying this table to measurements in the diagonal directions.
注1:45°对角线方向的像素间距与垂直、水平方向的像素间距不相同。因此,当将该表应用于对角线方向的测量时,使用对角线像素间距。
NOTE 2 The pixel pitch is the pitch of pixels in the image file. The picture height and pixel pitch used, in millimetres, are for the same magnification at which the lines per millimetre was determined, or vice versa.
注2:像素间距是指图像文件中像素的间距。所使用的图像高度和像素间距(以毫米为单位)与每毫米线条确定时的放大倍数相同,反之亦然。
H.2 Relation between SFR, sharpness, and acutance SFR关系、锋利度和锐度
It is important to note the relation between spatial resolution and image sharpness. Spatial resolution, as defined in this document, is an objective analytical measure of a digital capture device’s ability to maintain the optical contrast or modulation of increasingly finer spaced details in a scene. This is what the SFR characterizes. Image sharpness is the subjective impression of visually detecting finely spaced detail or edge transitions. The higher the contrast of visually important details (i.e. the greater the SFR over a wide range of details), the greater the likelihood of visually judging a rendered image of those details as sharp. While image noise and tone reproduction are also influential in the perception of image sharpness, the SFR of the imaging system (e.g. camera plus print) has proven to be the strongest correlate to image sharpness and is the basis for all acutance-type image sharpness predictors. A number of sharpness or acutance metrics based on SFR metrology have been proposed and demonstrated over the years. An excellent review of early metrics can be found in References [19] and [25].
注意空间分辨率和图像清晰度之间的关系是很重要的。空间分辨率,如本文所定义的,是一种客观的分析方法,用于衡量数字捕捉设备在场景中保持光学对比度或调制的能力。这就是SFR的特征。图像清晰度是视觉上检测精细间隔的细节或边缘过渡的主观印象。视觉上重要的细节的对比度越高(即在大范围的细节中SFR越大),就越有可能从视觉上判断这些细节的渲染图像是清晰的。虽然图像噪声和色调再现对图像清晰度的感知也有影响,但成像系统(例如相机加打印)的SFR已被证明是与图像清晰度最强的相关因素,是所有锐度类型的图像清晰度预测器的基础。多年来,基于SFR计量的锐度或锐度指标已被提出和论证。在参考文献[19]和[25]中可以找到早期指标的优秀综述。
H.3 Sampling efficiency rating (Es) 采样效率等级
For digital imaging, there are primarily two items that determine true optical resolution.
对于数字成像,主要有两个项目决定真正的光学分辨率。
a) Sampling frequency: usually referred to in terms of the number of addressable photoelements.
a) 取样频率:通常指可寻址光电元件的数目。
EXAMPLE: 5 megapixels on a sensor.
例如: 传感器上的500万像素。
b) Optical effects: factors such as focus, lens f-number, optical glass quality, and assembly.
b) 光学效果:诸如焦点、透镜f值、光学玻璃质量和装配等因素。
Most users consider sampling frequency as the only variable in determining resolution. Optical effects need to be considered also. If the sampling frequency (i.e. number of megapixels) is low, one cannot compensate by using high quality optics. Similarly, a high number of megapixels cannot compensate for low quality optics. It is the latter case for which the sampling efficiency rating is intended. Ideally, one would like the sampling, or number of photoelements, to take full advantage of a camera’s optical quality. If not, a single number, or efficiency, indicating the extent of such a shortcoming, would be helpful in assessing the effective number of claimed photoelements[21].
大多数用户认为采样频率是决定分辨率的唯一变量。还需要考虑光学效应。如果采样频率(即百万像素数)较低,则无法使用高质量光学也无法进行补偿。同样,高像素也无法补偿低质量光学。这是后者的情况下,抽样效率评级的目的。理想情况下,人们希望取样(或光元件的数量)可以充分利用相机的光学质量。如果没有,那么使用一个数字或效率值来表明这种缺陷的程度,将有助于评估所要求的光电元件的有效数量[21]。
The calculation of Formula (H.1) would yield the number of optically resolved photoelements using the sampling efficiency value, Es.
公式(H.1)的计算将使用采样效率值Es得出光学分辨光元件的数量。

Po is the number of optically resolved photoelements;
Po 是光学分辨光电元件的数量;
Es is the sampling efficiency;
Es 是采样效率;
Pc is the number of claimed photoelements.
Pc 是声称的光电元件数量。
The sampling efficiency rating ranges from 0% to 100% and uses a two-dimensional SFR area-normalized approach in its formulation. The reader is referred to Figure H.1 for clarity. It depicts a circular quadrant area. The perimeter of the quadrant is the locus of maximum sampling efficiency (100 %) for any angular direction. Ideally, if the sampling efficiency in all angular directions was characterized as 100, then a number of points would lie on that locus. A step-by-step procedure for calculating sampling efficiency is provided below when using horizontal, vertical, and 45° resolution values.
采样效率等级在0%到100%之间,在其公式中采用二维SFR区域归一化方法。为了清楚起见,读者可参考图H.1。它描绘了一个圆形象限区域。象限周长是任意角度采样效率最大值(100%)的轨迹。理想情况下,如果所有角度方向的采样效率被表征为100,那么该轨迹上会有若干点。以下提供了一个计算取样效率的逐步程序,用于使用水平、垂直和45° 分辨率值。
1) Determine the visual resolution in LW/PH for the horizontal (RH), vertical (RV), and ±45° (R+45, R-45) directions. Alternately, equivalent frequency units of cycle/pixel derived from the 0,10 SFR response levels of either of the SFR methods can also be used.
1) 确定水平(RH)、垂直(RV)和垂直方向的视觉分辨率(LW/PH)±45° (R+45,R-45)方向。或者,也可以使用从任一SFR方法的0,10 SFR响应电平导出的周期/像素的等效频率单位。
2) Calculate individual directional efficiencies for EH, EV, E+45, and E-45 by normalizing the visual resolutions of item #1 by the captured image’s picture height. When using cycles/pixel frequency units, normalize by 0,5 cycle/pixel. Any normalized value greater than 1,0 shall be assigned the value of 1,0.
2) 通过将项目#1的视觉分辨率标准化为捕获图像的图片高度,计算EH、EV、E+45和E-45的单个方向效率。使用周期/像素频率单位时,按0.5周期/像素进行规格化。任何大于1.0的标准化值应指定为1.0。
3) Combine E+45 and E-45 efficiencies into an equally weighted average diagonal value, ED.
3) 将E+45和E-45效率合并为一个相等加权平均对角线值ED。
4) Calculate the sampling efficiency rating (ER) as the product of 100, ED, and the average of EH and EV.
4) 将采样效率等级(ER)计算为100、ED和EH和EV平均值的乘积。

EXAMPLE 2 048 pixel high × 3 072 pixel wide = 6,0 MPixel camera file.
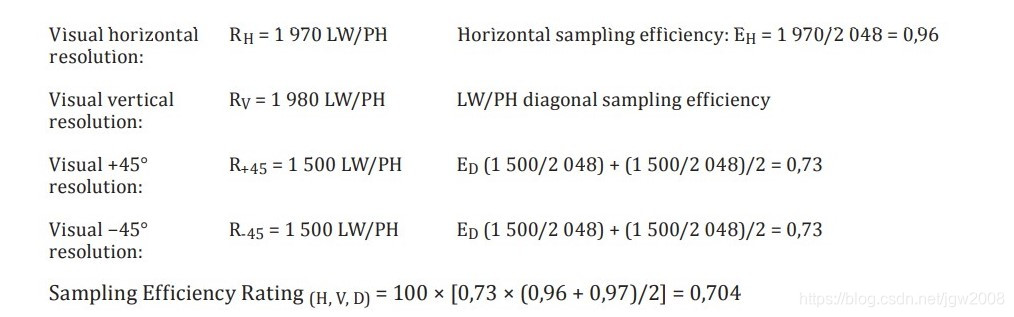
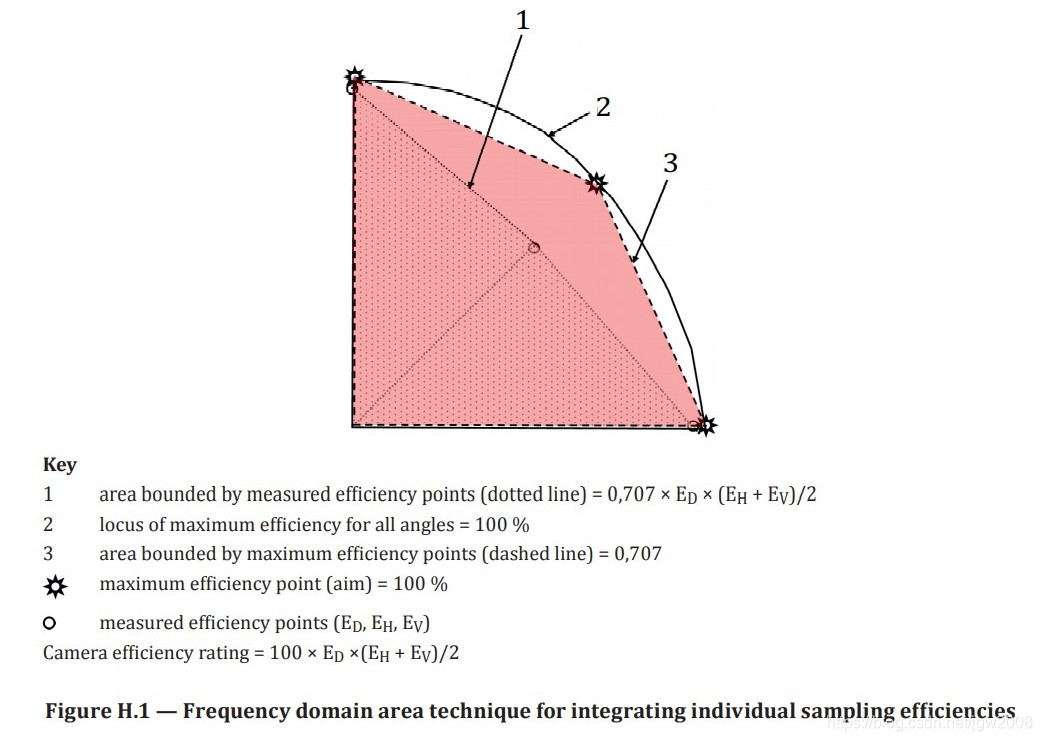
If only EH and EV are known, the formula for sampling efficiency is
如果只知道EH和EV,则采样效率公式为

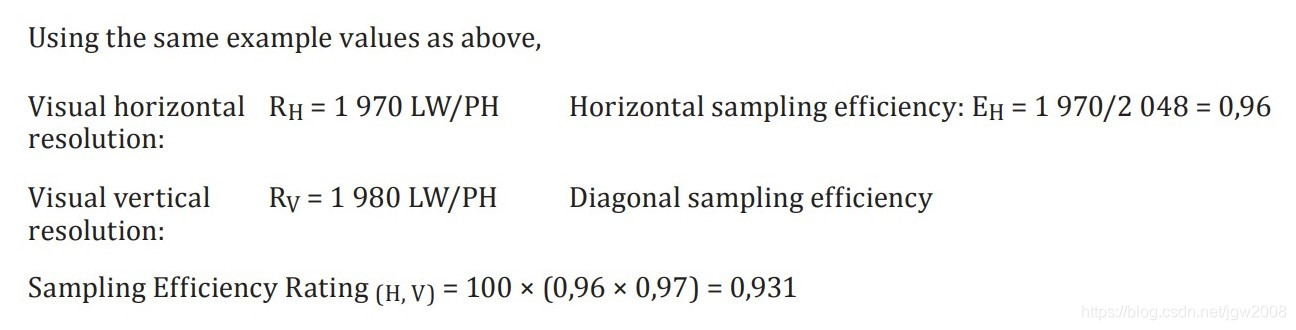
Annex I (informative) Original test chart defined in ISO 12233:2000 附录I(资料性附录)ISO 12233:2000中定义的原始试验图
I.1 General 概述
This third edition of ISO 12233 cancels and replaces the second edition, ISO 12233:2014, which had previously cancelled and replaced the first edition, ISO 12233:2000. However, users are allowed to use the test chart defined in ISO 12233:2000 to perform some of the measurements defined in this third edition of ISO 12233. For this reason, this annex describes the test chart originally defined in ISO 12233:2000.
ISO 12233第三版取消并替换了第二版ISO 12233:2014,该版本先前已取消并替换了第一版ISO 12233:2000。但是,用户可以使用ISO 12233:2000中定义的测试图来执行ISO 12233第三版中定义的一些测量。因此,本附录描述了中最初定义的试验图表ISO 12233:2000。
I.2 The original test chart defined in ISO 12233:2000 (ISO 12233:2000中规定的原始试验图表)
A reproduction of the original test chart defined in ISO 12233:2000 is shown in Figure I.1. Figure I.2 is a diagram showing the locations of particular features of the test chart, which may be either a reflective or transmissive chart. The purpose of each test pattern element is listed in Table I.1.
ISO 12233:2000中规定的原始试验图表的复制品如图I.1所示。图I.2是示出试验图的特定特征位置的图,试验图可以是反射图或透射图。表I.1列出了每个测试模式元素的用途。
The requirement to both of test pattern modulation and the positional tolerance is the same as described in 5.2.4 and 5.2.5 in this document because there are no fundamental changes in the revision.
对试验模式调制和位置公差的要求与本文件5.2.4和5.2.5中所述的要求相同,因为修订版中没有根本性的变化。
All test chart features are specified in units of line widths per picture height (LW/PH), where the height is the active image distance in the shorter test chart dimension. The finest features are 2 000 LW/PH, which is equivalent to 1 000 line pairs per picture height.
所有测试图特征均以每幅图片高度的线宽(LW/PH)为单位指定,其中高度是较短测试图维度中的活动图像距离。最精细的特征是2000lw/PH,相当于每幅图片高度1000个线对。
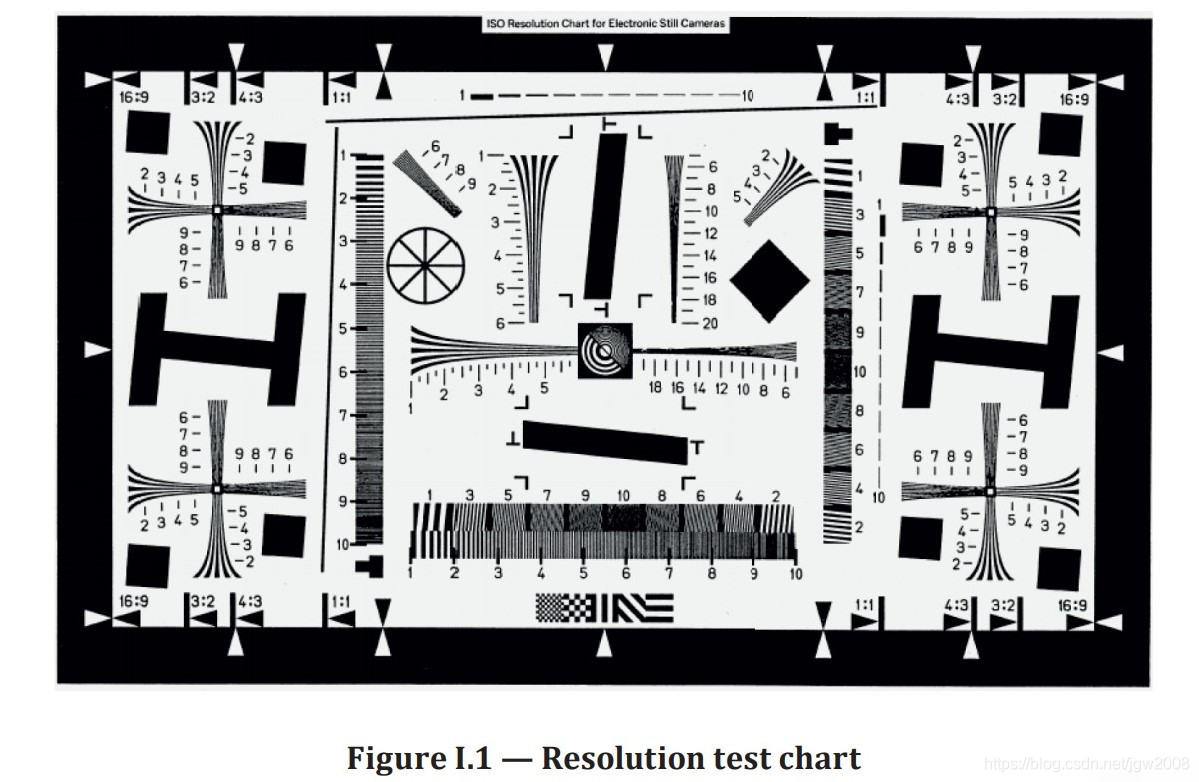
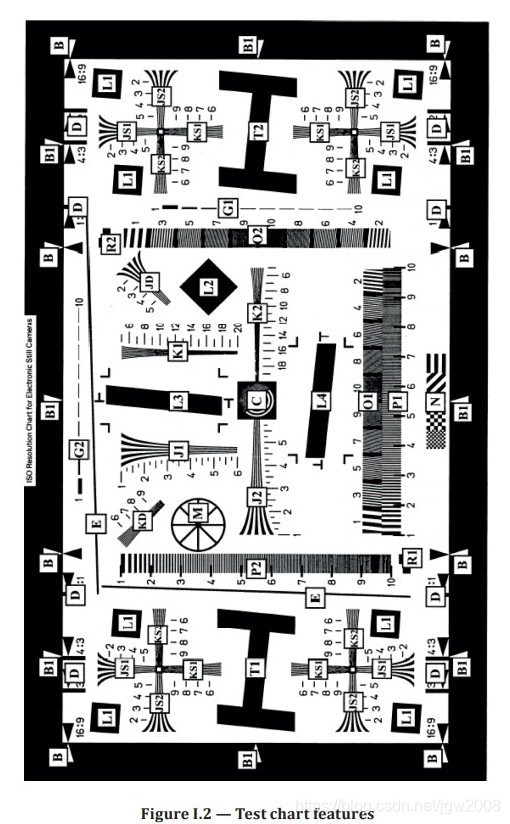
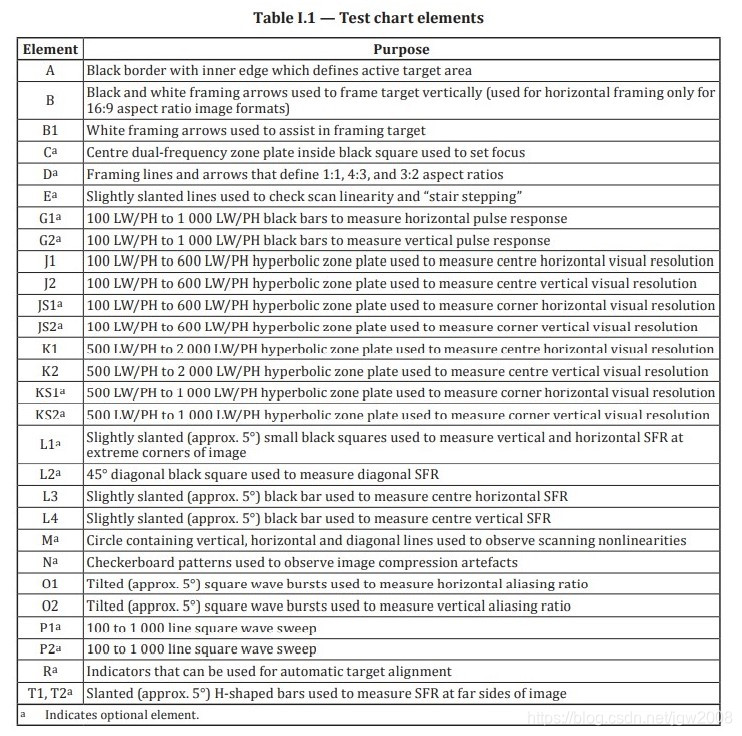
I.3 Limiting resolution measurements in ISO 12233:2000 (ISO 12233:2000中的极限分辨率测量)
The limiting resolution in ISO 12233:2000 was defined as the value, in LW/PH, of that portion of a specified resolution test pattern that corresponds to an average modulation value equal to some specified SFR value (specifically 10 % SFR value). The test chart includes vertical, horizontal, and two diagonal square wave sweeps, labelled as P in Figure I.2, which are used to perform this measurement. For all four patterns, the reference response is defined as the difference between the signal values from the black squares at the end of the square wave sweeps and the white region around the square wave sweeps.
ISO 12233:2000中的极限分辨率定义为特定分辨率试验模式部分的值,单位为LW/PH,该部分对应于等于某些特定SFR值(特别是10%SFR值)的平均调制值。测试图包括垂直、水平和两个对角线方波扫描,在图I.2中标记为P,用于执行此测量。对于所有四种模式,参考响应被定义为方波扫描结束时黑色正方形和方波扫描周围白色区域的信号值之间的差值。
Some patterns placed on ISO 12233:2000 chart shown in Figure I.1 are provided for limiting resolution measurement as shown in Table I.1.
图I.1所示的ISO 12233:2000图表上的一些模式用于限制分辨率测量,如表I.1所示。
I.4 Spatial frequency response measurement in ISO 12233:2000 (high contrast edge SFR)
ISO 12233:2000(高对比度边缘SFR)中的空间频率响应测量
The spatial frequency response (SFR) measurement in ISO 12233:2000 was defined as the value measured by analysing the camera data near a slanted black to white edge. For the target shown in Figure I.2, the black L and T patterns are to be used to measure the horizontal, vertical, and two diagonal SFR.
在iso12233:2000中,空间频率响应(SFR)测量被定义为通过分析倾斜黑白边缘附近的相机数据而测量的值。对于图I.2所示的目标,黑色L和T图案用于测量水平、垂直和两对角线SFR。
This method is an edge-based spatial frequency response (e-SFR) measurement using high contrast edge pattern, and replaced by the method using low contrast edge pattern described in Clause 6 and Annexes C and D.
该方法是使用高对比度边缘模式进行的基于边缘的空间频率响应(e-SFR)测量,并由第6条和附录C和D中描述的使用低对比度边缘模式的方法代替。
Bibliography 参考文献
[1] ISO 6328, Photography — Photographic materials — Determination of ISO resolving power
[1] ISO 6328,摄影-摄影材料-ISO分辨率的测定
[2] ISO 9334, Optics and photonics — Optical transfer function — Definitions and mathematical relationships
[2] ISO 9334,光学和光子学-光学传递函数-定义和数学关系
[3] ISO 9335, Optics and photonics — Optical transfer function — Principles and procedures of measurement
[3] ISO 9335,光学和光子学-光学传递函数-测量原理和程序
[4] ISO 9336-1, Optics and photonics — Optical transfer function — Application — Part 1: Interchangeable lenses for 35 mm still cameras
[4] ISO 9336-1,光学和光子学-光学传递函数-应用-第1部分:35mm静态相机的可互换镜头
[5] ISO 12231, Photography — Electronic still picture imaging — Vocabulary
[5] ISO 12231,摄影-电子静态图像成像-词汇
[6] IEC 61146-1, Video cameras (PAL/SECAM/NTSC) — Methods of measurement — Part 1: Nonbroadcast single-sensor cameras
[6] IEC 61146-1,摄像机(PAL/SECAM/NTSC)-测量方法-第1部分:非广播单传感器摄像机
[7] IEC 61146-2, Video cameras (PAL/SECAM/NTSC) — Methods of measurement — Part 2: Two- and three-sensor professional cameras
[7] IEC 61146-2,摄像机(PAL/SECAM/NTSC)-测量方法-第2部分:双传感器和三传感器专业摄像机
[8] ANSI PH2.39-1977 (R1990), Method of measuring the photographic modulation transfer function of continuous-tone, black-and-white photographic films
[8] ANSI PH2.39-1977(R1990),连续色调黑白照相胶片的照相调制传递函数的测量方法
[9] ITU-R BT.709, Basic parameter values for the HDTV standard for the studio and for international programme exchange
[9] ITU-R BT.709,演播室和国际节目交换用HDTV标准的基本参数值
[10] Baker L. Optical transfer function: measurement. SPIE Milestone Series, Vol. Ms. 1992, p. 60
[10] Baker L.光学传递函数:测量。SPIE里程碑系列,第1992卷,第60页
[11] Fischer T.A., & Holm J. Electronic still-picture camera spatial frequency response measurement, IS & T’s 47th Annual Conference/ICPS 1994, vol. II, pp. 626–630
[11] Fischer T.A.和Holm J. 电子静止图像相机空间频率响应测量,IS&T第47届年会/ICPS 1994,第二卷,第626-630页
[12] Okano Y. MTF Analysis and its Measurements for Digital Still Camera, IS & T’s 50th Annual Conference, pp. 383–387
[12] Okano Y. 数码相机MTF分析及其测量,IS&T第50届年会,第383-387页
[13] Reichenbach S.E. Characterizing digital image acquisition devices. Opt. Eng. 1991 Feb., 30 (2), pp. 170–17
[13] Reichenbach S.E.描述数字图像采集设备.选择.工程。1991年2月30日(2),第170-17页
[14] Schulz M. Measurement technique for the characterization of electronic still-picture cameras, EUROPT0. Proc. SPIE 2950, Advanced Focal Plane Arrays and Electronic Cameras, 1996 Dec., p. 208
[14] Schulz M. 电子静止图像照相机特性的测量技术,欧洲标准. 过程。SPIE 2950,高级焦平面阵列和电子相机,1996年12月,第208页
[15] Williams D. Benchmarking of the ISO/TC 42/WG 18 slanted-edge spatial frequency response Photoshop plug-in, IS & T’s 51st Annual Conference 1998
[15] Williams D. ISO/TC 42/WG 18斜边空间频率响应Photoshop插件的基准测试,IS&T 1998年第51届年会
[16] CIPA DC-003(2003) Resolution Measurement Methods for Digital Cameras
[16] CIPA DC-003(2003)《数码相机分辨率测量方法》
[17] Williams D. Debunking of Specsmanship: Progress on ISO/TC42 Standards for Digital Imaging Performance. PIC, 2004
[17] Williams D. 规格揭秘:数字成像性能ISO/TC42标准的进展。PIC,2004
[18] ISO 15529:2010, Optics and photonics — Optical transfer function — Principles of measurement of modulation transfer function (MTF) of sampled imaging systems
[18] ISO 15529:2010,光学和光子学-光学传递函数-取样成像系统调制传递函数(MTF)的测量原理
[19] Higgins G.C. Image quality criteria. J. Appl. Photogr. Eng. 1977, 3 (2), pp. 53–60
[19] Higgins G.C. 图像质量标准。J. Appl. Photogr. Eng. 1977年,3(2),第53-60页
[20] Williams D. A Pilot Study of Digital Camera Resolution Metrology Protocols Proposed under ISO 12233, Second Edition, Proc. SPIE Vol. 6808, 2008
[20] Williams D. 根据ISO 12233(第二版)提出的数码相机分辨率计量协议的初步研究。SPIE第6808卷,2008年
[21] Burns P., & Williams D. Sampling Efficiency in Digital Camera Performance Standards, Proc. SPIE-IS&T Electronic Imaging Symposium, 2008
[21]Burns P.和Williams D。数码相机性能标准中的采样效率。2008年SPIE-IS&T电子成像研讨会
[22] Loebich C., Wueller D., Klingen B., Jaeger A. Digital Camera Resolution Measurement Using Sinusoidal Siemens Stars, IS+T,SPIE Electronic Imaging Conference 2007
[22]Loebich C.,Wueller D.,Klingen B.,Jaeger A。利用西门子正弦星测量数码相机分辨率,IS+T,2007年SPIE电子成像会议
[23] Neumann A. Method for Resolution Measurement, Diploma thesis at the University of Applied Sciences in Cologne, 2003
[23] Neumann A. 《分辨率测量方法》,科隆应用科学大学毕业论文,2003年
[24] Artmann U. Noise Reduction vs Spatial Resolution, Diploma thesis at the University of Applied Sciences in Cologne, 2007
[24] Artmann U. 降噪与空间分辨率,科隆应用科学大学毕业论文,2007年
[25] Barten P.G.J. Contrast Sensitivity of the Human Eye and Its Effects on Image Quality, SPIE Press, Dec. 1999, ISBN: 9780819434968
[25]Barten P.G.J.人眼对比度敏感性及其对图像质量的影响,SPIE出版社,1999年12月,ISBN:9780819434968
[26] ISO 7589, Photography — Illuminants for sensitometry — Specifications for daylight, incandescent tungsten and printer
[26]ISO 7589,摄影-感光测定用光源-日光、白炽钨和打印机规范
[27] ISO 12232, Photography — Digital still cameras — Determination of exposure index, ISO speed ratings, standard output sensitivity, and recommended exposure index
[27]ISO 12232,摄影-数码相机-曝光指数、ISO速度等级、标准输出灵敏度和推荐曝光指数的测定
[28] ISO 5-3:2009, Photography and graphic technology — Density measurements — Part 3: Spectral conditions
[28]ISO 5-3:2009,摄影和图形技术-密度测量-第3部分:光谱条件


 3740
3740

 被折叠的 条评论
为什么被折叠?
被折叠的 条评论
为什么被折叠?
 到【灌水乐园】发言


