


来源
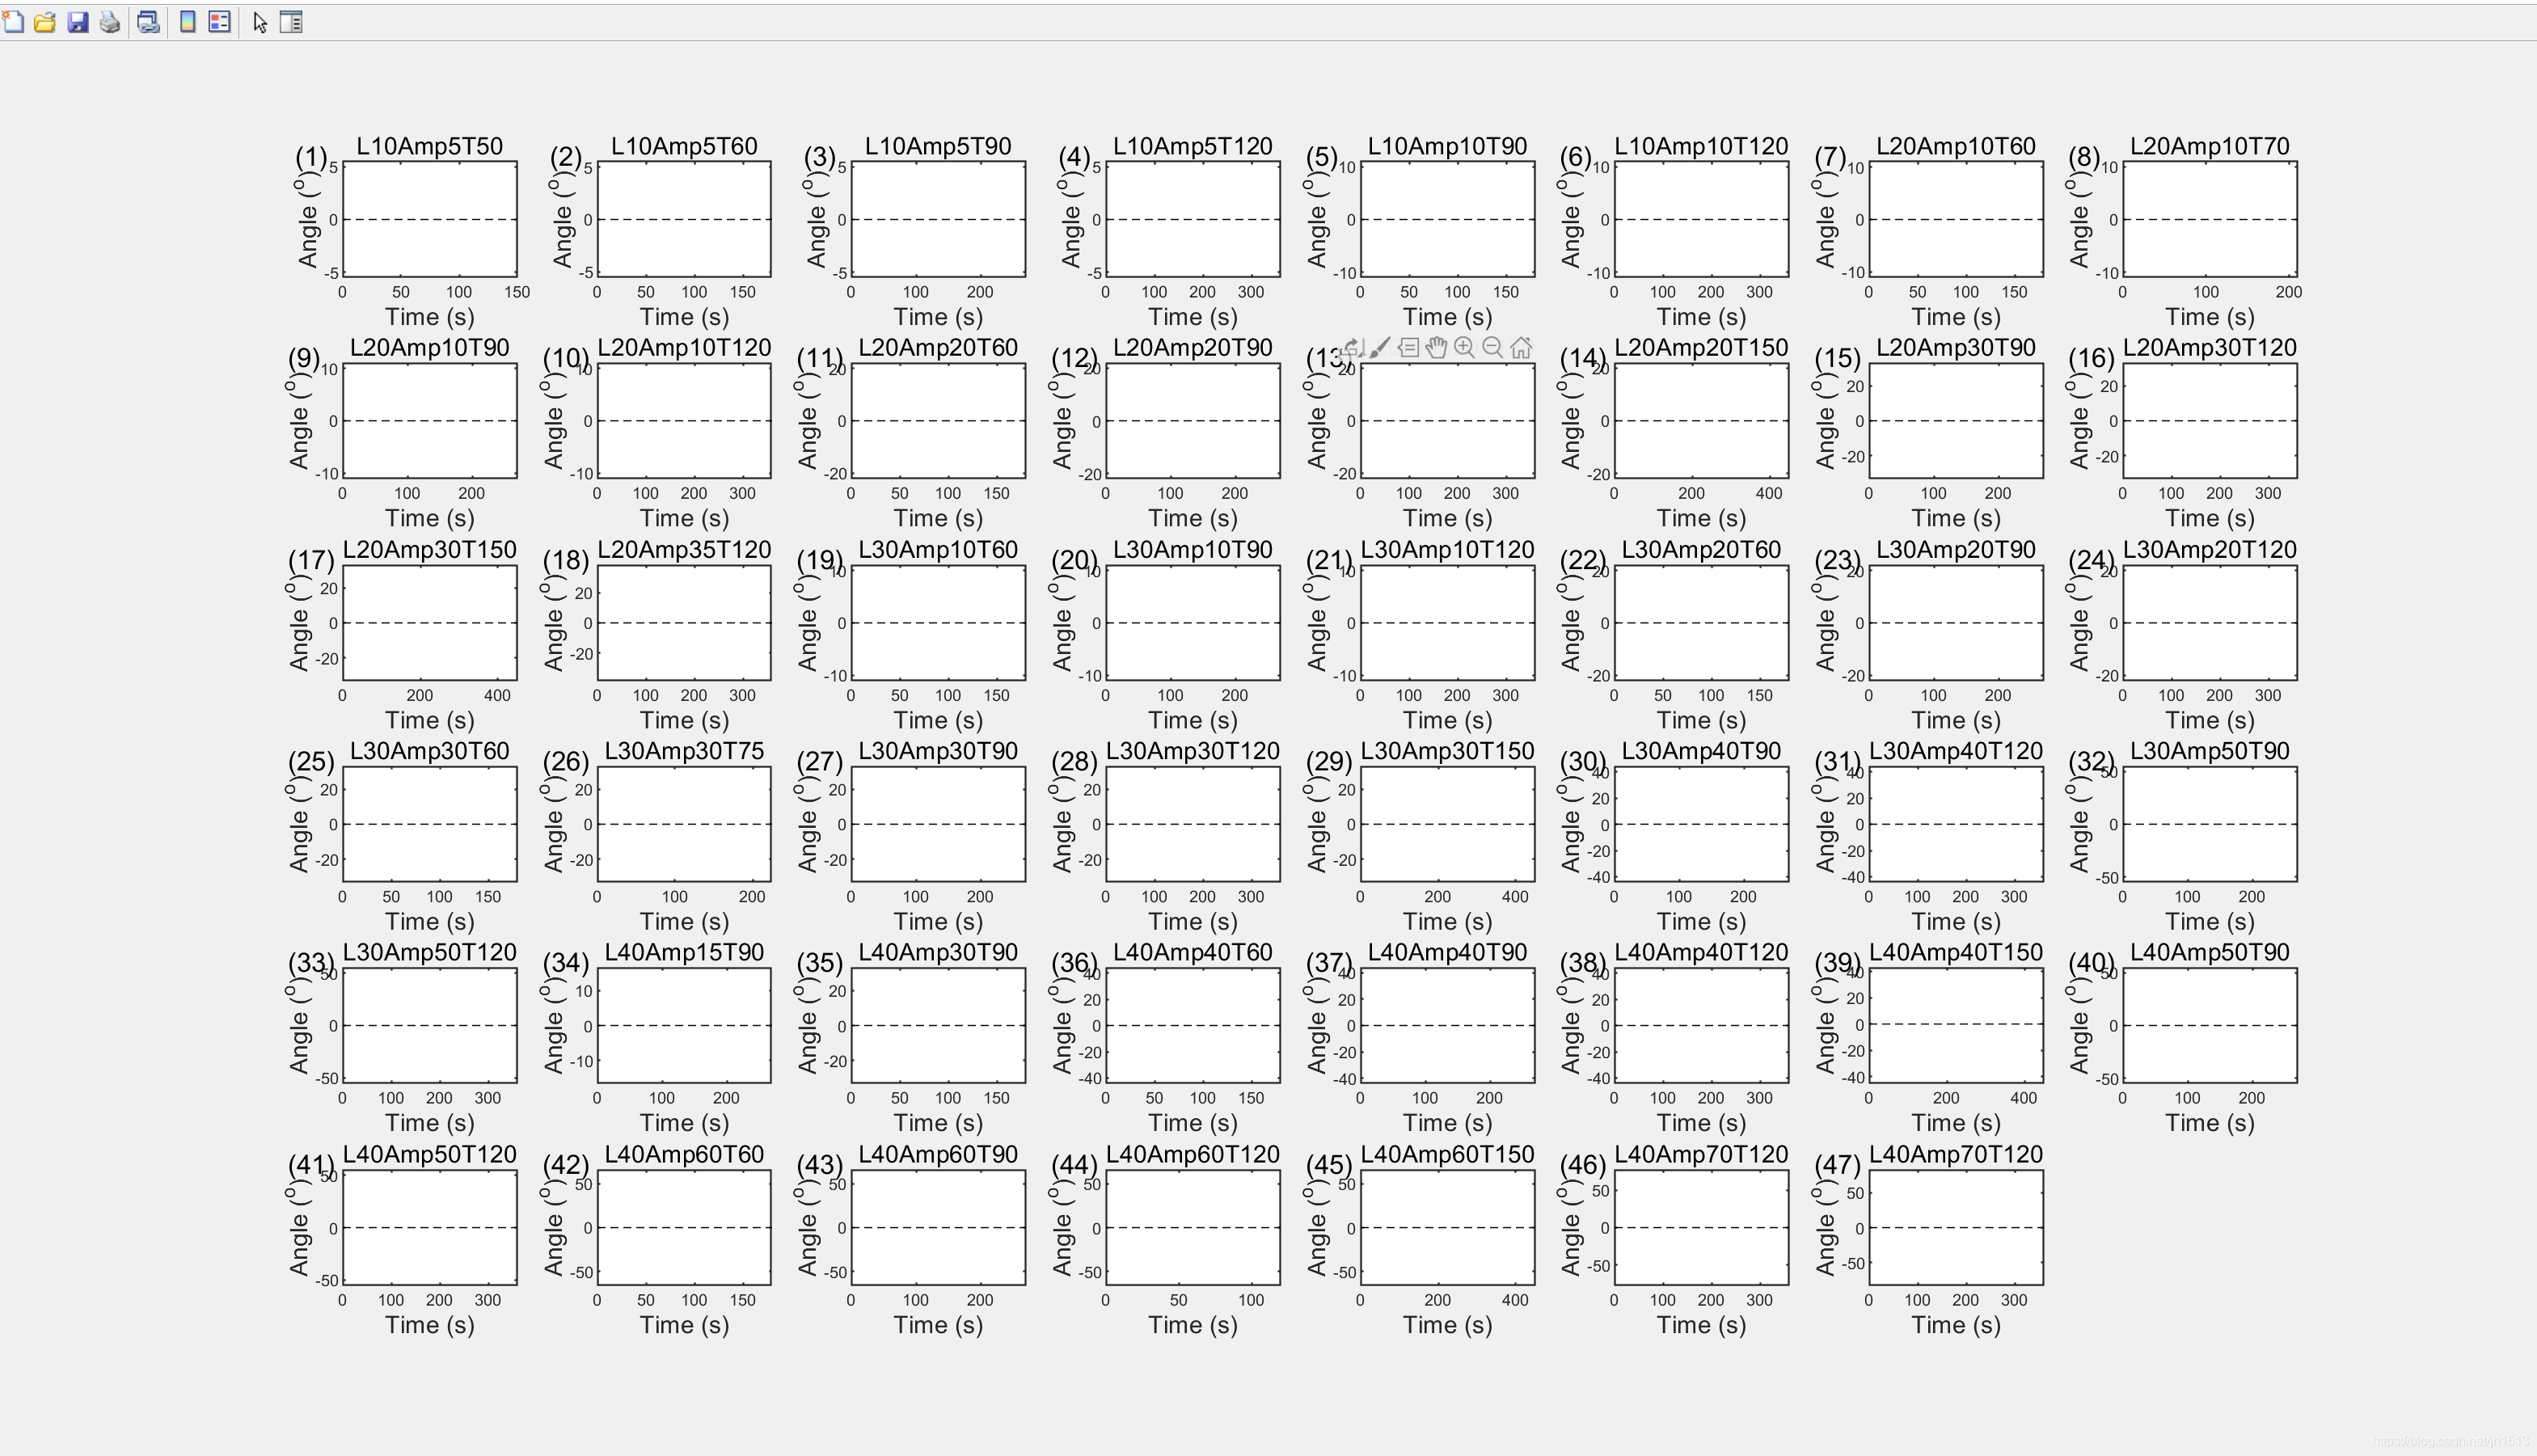
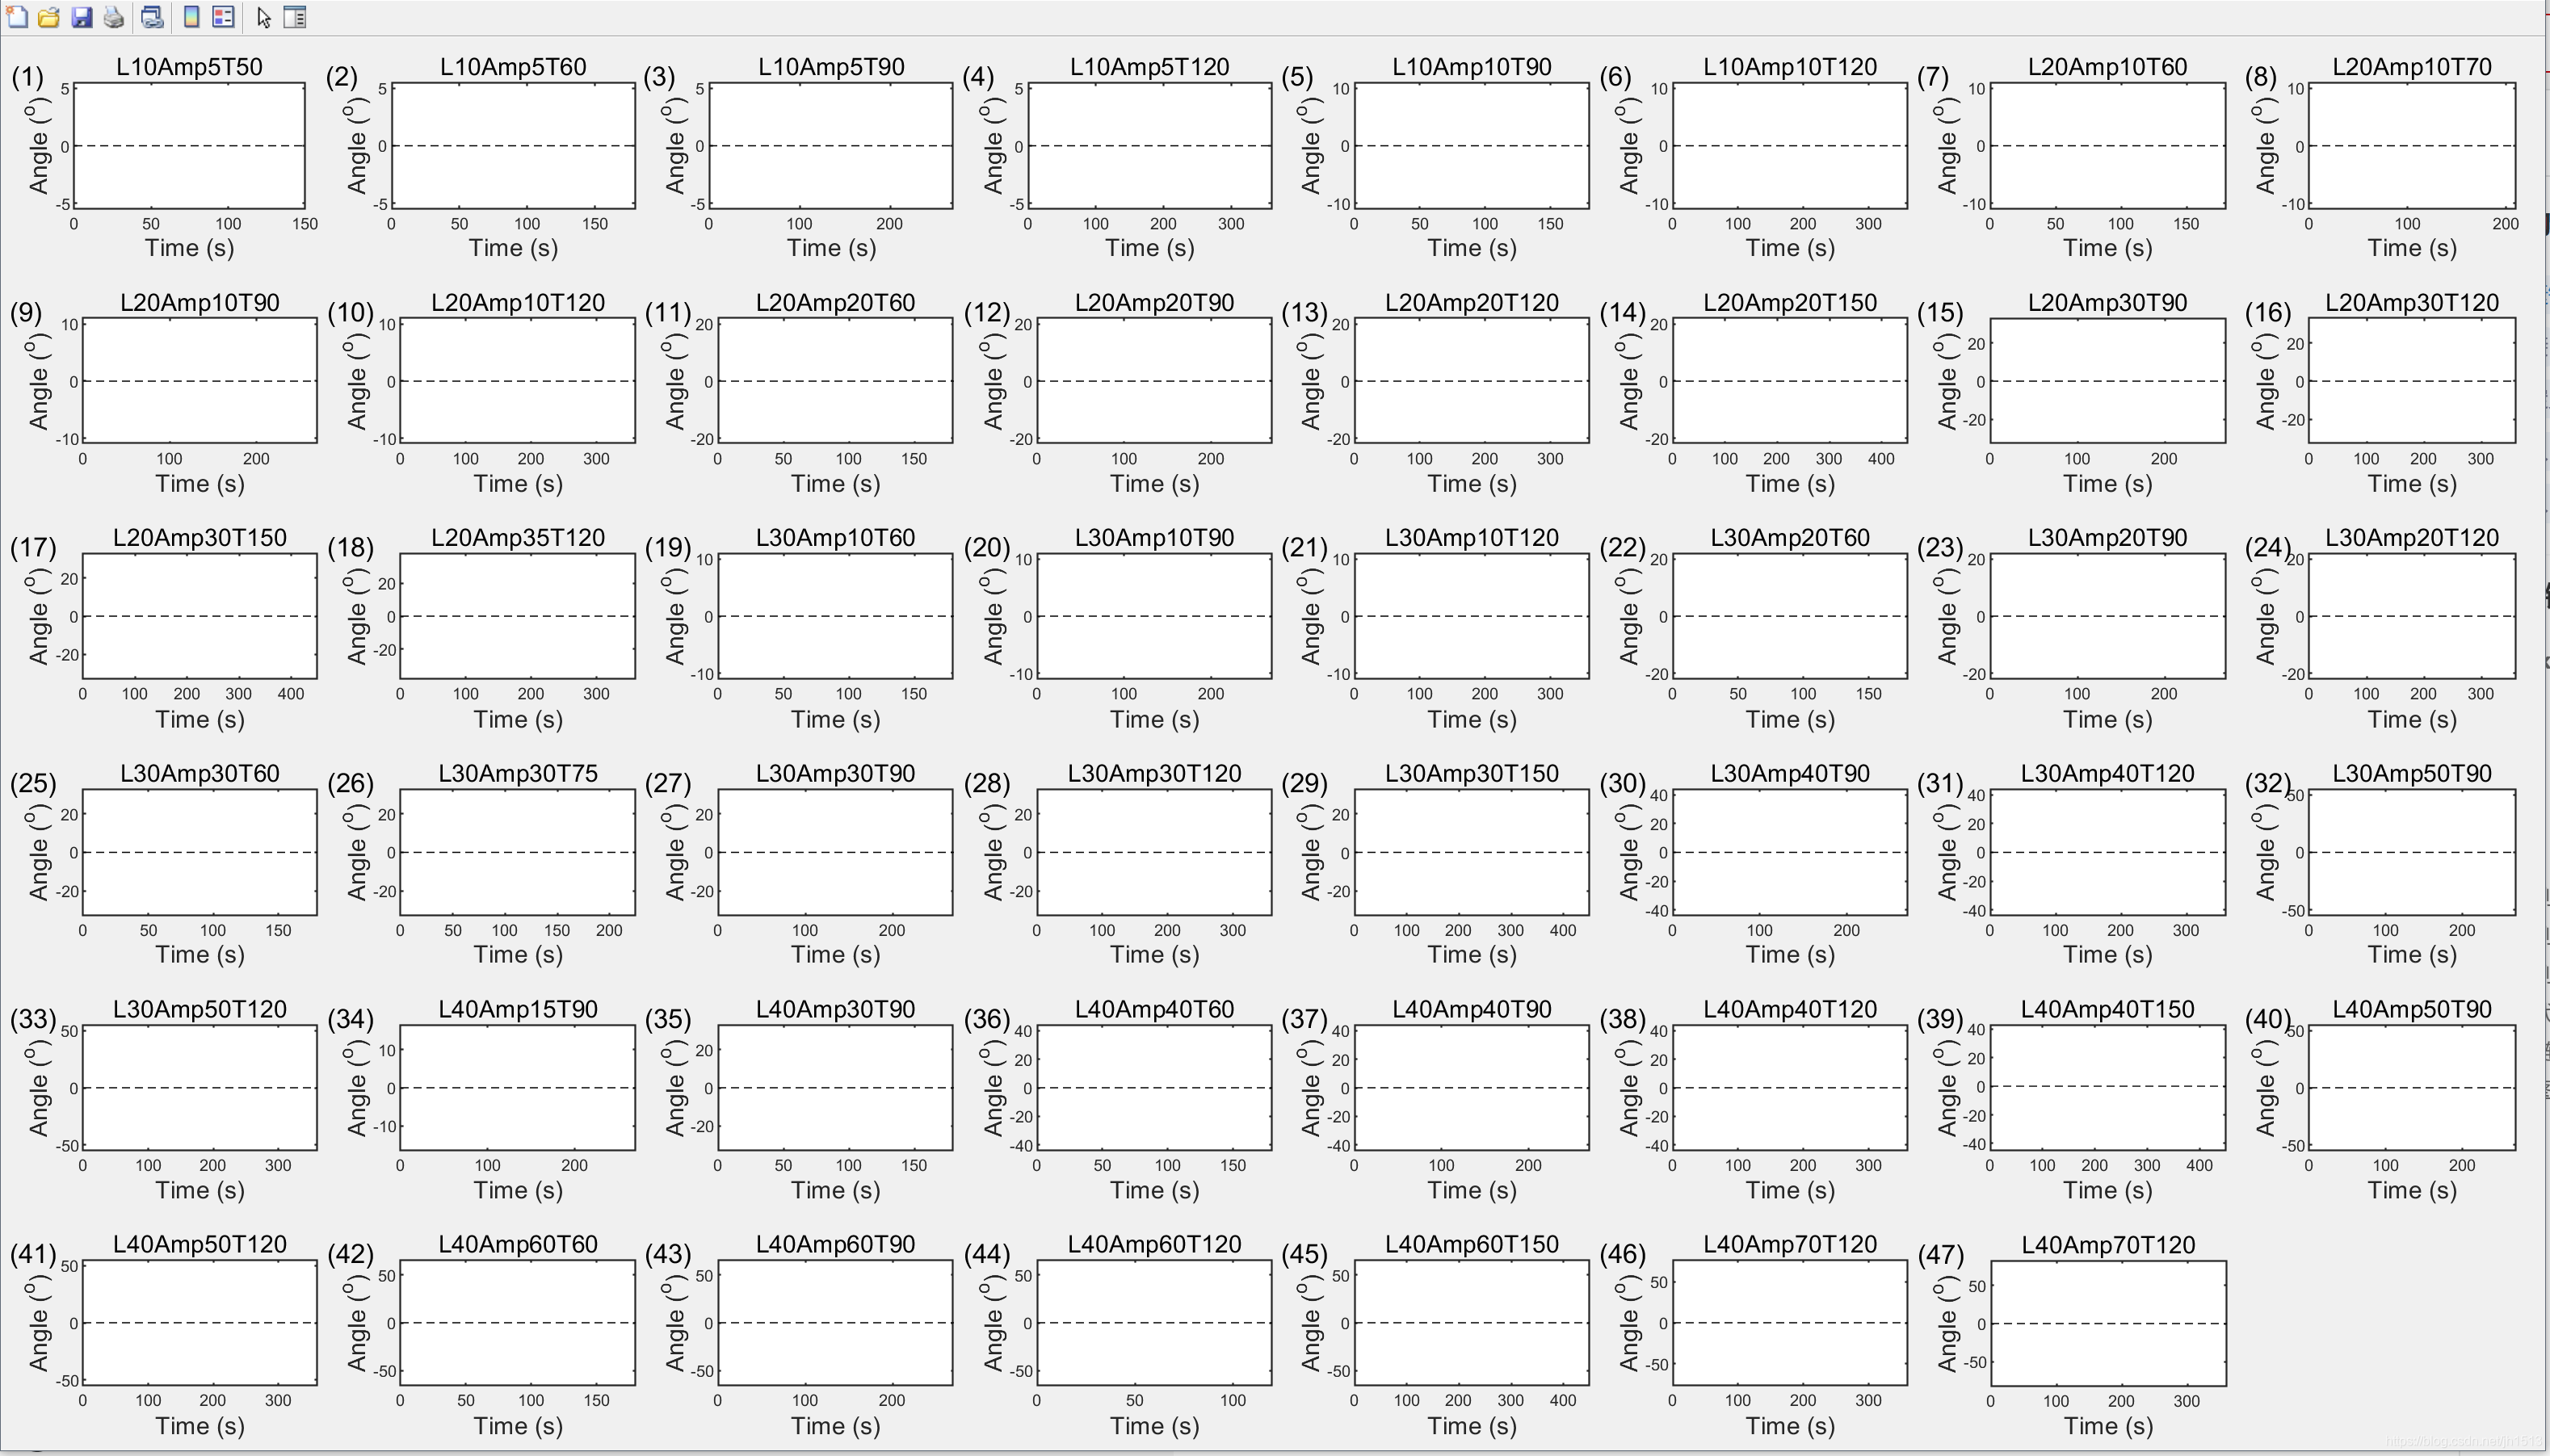
处理实验数据,由于很多个小类别,全部用个subplot绘制出来,发现两边的空白太多,想把两边空白删除。直接上图处理签和处理后的结果, 实验结果被我用hold off 取消掉了,不影响此处说明。
左上角的数字编号见我另一篇博文,Matlab使用subplot绘制子图时编号(a)(b)©(d) 。 这里由于超过26个字母改位数字了。
https://blog.csdn.net/jh1513/article/details/105660861
解决方法
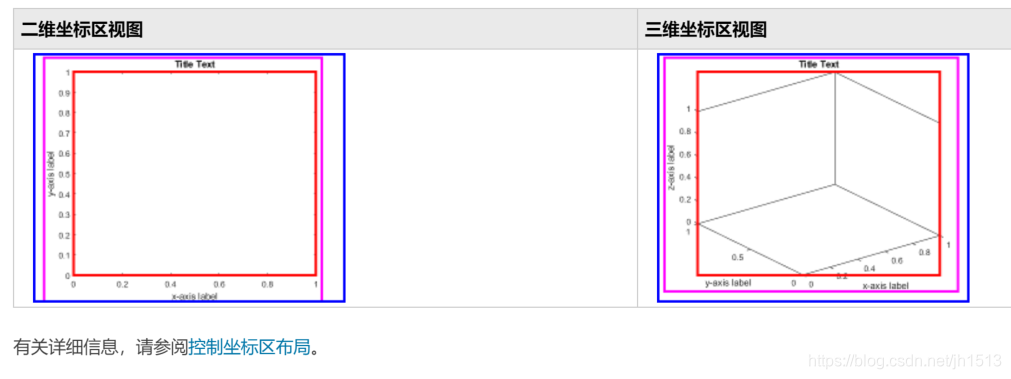
首先明确我们是可以调整matlab图形的具体位置,边框等, 相关资料见matlab参考手册以及figure, axes 等属性设置,具体我也没有整太懂,matlab所搜 控制坐标区布局. 在此给一个图,
说了这么多,直接上函数代码,首先是针对单个Figure的调整代码,然后这个代码有应用到subplot情况下。
figure类型
这个地方没有设置输出参数,可以考虑输入坐标轴句柄,但是我原来计划是针对当前激活的窗口进行调整的,所以没有输入参数,直接用 gca 获取当前窗口的坐标轴句柄。 在 subplot类型中会设置函数输入参数,具体遇到的问题待会讨论。
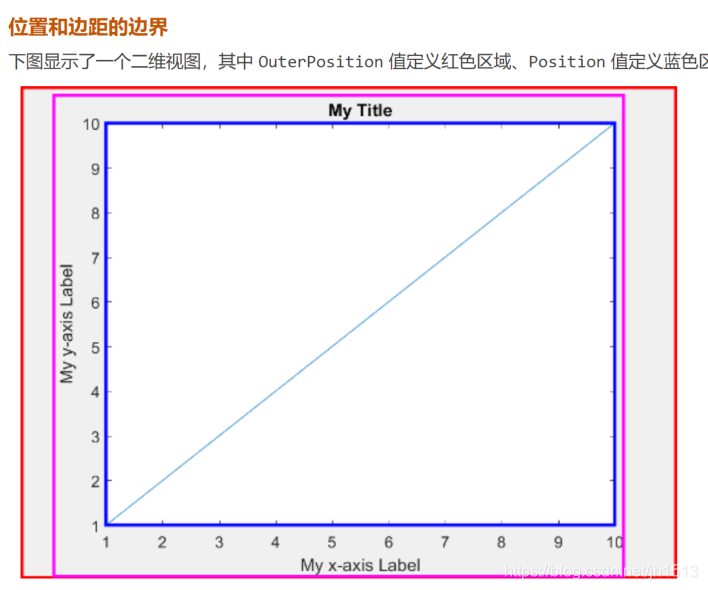
这个函数主要思想是,获取 坐标轴 TightInset 属性(具体参考 Axes 属性中相关介绍),然后获取 Position 属性, 通过两种属性重新计算出一个新的Position属性,当然就是这里把两侧空白区域干掉的。这段代码是网络上找到的,感谢那些网友。
下面的图(matlab copy的)显示由 OuterPosition 值(蓝色)、Position 值(红色)以及由 TightInset 值(品红色)外扩的 Position 定义的区域。
方法一
function [] = RemoveFigMarginArea()

inset_vectior = get(gca, 'TightInset');
% inset_vectior = get(gca, 'Position');
inset_x = inset_vectior(1);
inset_y = inset_vectior(2);
inset_w = inset_vectior(3);
inset_h = inset_vectior(4);

% OuterPosition
outer_vector = get(gca, 'OuterPosition');
pos_new_x = outer_vector(1) + inset_x; % move the orignal point of Position to that of the TightInset
pos_new_y = outer_vector(2) + inset_y;
pos_new_w = outer_vector(3) - inset_w - inset_x; % reset the width of Position
pos_new_h = outer_vector(4) - inset_h - inset_y; % reset the height of Position

% Position
set(gca, 'Position', [pos_new_x, pos_new_y, pos_new_w, pos_new_h]);

hold on
end
方法二
在matlab 官方英文问答中找到另一种简单语句, matlab官方定义为:
TightInset - 为 Position 属性值中的宽度和高度所添加的边距,指定为 [left bottom right top] 形式的向量。此属性是只读的。在添加轴标签和标题时,MATLAB® 会更新这些值以适应文本。Position 和 TightInset 属性所定义的边界大小包含所有图形文本。
他得到坐标轴外侧流出来的左侧,下侧,右侧,上侧的空白区域,归一化单位定义的, 然后用 1 减去水平方向的 left 和 right,得到水平方向宽度,同样得到竖直方向高度,然后把这些值赋值给“Position”属性,即可以消除两侧空白区。
注意,这个设置应该到导出图形的之前设置,因为更改标题,坐标轴标签会改变‘TightInset ’属性值。
figure;
AxesH = axes;
drawnow;
InSet = get(AxesH, 'TightInset');
set(AxesH, 'Position', [InSet(1:2), 1-InSet(1)-InSet(3), 1-InSet(2)-InSet(4)])
核心思想和上面一样,获取 “TightInset” 的值
subplot类型
如果把上面那段代码用在建立一个figure 后,又在subplot之前,我这里在使用subplot之后两侧空白区域还是很大,具体原因我没有分析过,然后网上又找到一段代码,我针对自己的应用改了改,如下。
我在使用中遇到过一个问题,当调整子图大小位置之后,可能出现之前的子图会消失。原因是因为,调整一个子图大小,当其和之前的子图有重合是,之前子图被删除了,详情见matlab官方论坛,相关帖子如下: 帖子一, 帖子二。
处理方法是:先把所有子图绘制出来,然后在一个一个调整,由于我的子图太多,我的方法是: 创建子图之后获取坐标轴句柄然后把他们存起来, 后面再在循环里面修改子图位置, subFig = subplot(m,n,i); subAxes = gca;
这里函数设置了输入参数,首先是要调整子图的坐标轴句柄subAxes,然后是subplot的行列数 m,n,最后是当前子图编号,中间设置了左右两边预留距离marginLeftRight 和上下边缘预留距离 marginTopBottom 。
调整子图大小思想是: 根据你创建subplot子图行列数量将整个figure划分成一个一个小块,由于默认position参数中使用的是跪一个的容器单位,整个长高都为1 则每一个的长高分别为 1/n,1/m; 然后我使用 [col, row] = ind2sub([n,m],p); 计算出当前编号的图在整个figure中的行列位置,注意subplot子图填充顺序和数组元素的顺序是不一样的。我预留 0.05 倍的长度作为 ylabel 的位置,然后上下 0.05 倍高度分别作为 xlabel 和 title 位置,这个参数往往根据整个 figure 的大小调节的,弄出函数输入参数的形式。根据上面这些位置关系我就能计算出每一个子图坐标系的起始位置以及长度和高度,然后设置子图的坐标系位置,最后调整子图外边框的大小(上面Figure类的代码)
function [] = RemoveSubplotMarginArea(subAxes, m,n,p)
% Remove the blank area in the margin of the figure/subplot of the current
% active figure/subplot

% subAxes: handle of the axes of the subplot
% m :   row of the subplot
% n :   column of the subplot
% p :   the index of the current/actived subplot

% Attention: for saving fig, using the following command to set the
% parameter, otherwise, this function cannot change the fig saved
% set(gcf, 'PaperPositionMode', 'auto');

if nargin <4
    p = 1;

end

% ind2sub: Convert linear indices to subscripts. Please note that the
% direction of subplot is different from arrays.
% col : the column of the actived subplot
% row : the row of the actived subplot
[col, row] = ind2sub([n,m],p);

% OuterPosition
% set the left and right margins for the whole figure
marginLeftRight = 0.01;
% set the top and bottom margins for the whole figure
marginTopBottom = 0.1;
% The followin code divide the whole fig to m row and n column
sub_axes_x = (col-1) * (1-2*marginLeftRight)/n                          + marginLeftRight;
sub_axes_y = (1 - 2*marginTopBottom) -row * (1 - 2*marginTopBottom)/m   + marginTopBottom;
sub_axes_w = (1-2*marginLeftRight)/n;
sub_axes_h = (1-2*marginTopBottom)/m;

% set the margin for title, xlabel, ylabel
delt_w = 0.05 * 1/n;
delt_h = 0.05 * 1/m;
% pos = [sub_axes_x + delt_w, sub_axes_y + delt_h,...
%                 sub_axes_w - delt_w, sub_axes_h - 2* delt_h]
set(subAxes, 'OuterPosition', [sub_axes_x + delt_w, sub_axes_y + delt_h,...
                sub_axes_w - delt_w, sub_axes_h - 2* delt_h]); % OuterPosition


% TightInset
inset_vectior = get(subAxes, 'TightInset');
% inset_vectior = get(gca, 'Position');
inset_x = inset_vectior(1);
inset_y = inset_vectior(2);
inset_w = inset_vectior(3);
inset_h = inset_vectior(4);

% OuterPosition
outer_vector = get(subAxes, 'OuterPosition');
pos_new_x = outer_vector(1) + inset_x; % move the orignal point of Position to that of the TightInset
pos_new_y = outer_vector(2) + inset_y;
pos_new_w = outer_vector(3) - inset_w - inset_x; % reset the width of Position
pos_new_h = outer_vector(4) - inset_h - inset_y; % reset the height of Position

% Position
set(subAxes, 'Position', [pos_new_x, pos_new_y, pos_new_w, pos_new_h]);


end
终极方法
最近看到一个调整边距的方法,如下一条语句,具体链接点我。
set(gca,'LooseInset', max(get(gca,'TightInset'), 0.02))


 5万+
5万+


 被折叠的 条评论
为什么被折叠?
被折叠的 条评论
为什么被折叠?
 到【灌水乐园】发言


